Article By RoboForex.com
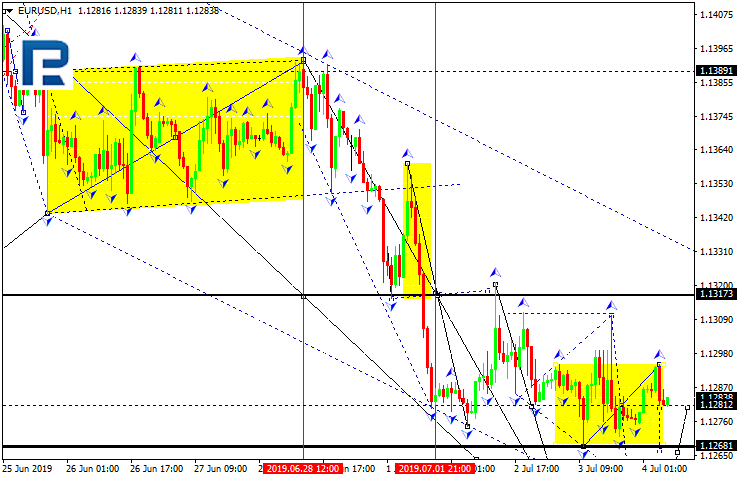
EURUSD, “Euro vs US Dollar”
EURUSD is forming the fifth descending structure. Possibly, today the pair may reach 1.1251 and then grow towards 1.1260. Later, the market may start another decline with the short-term target at 1.1242.

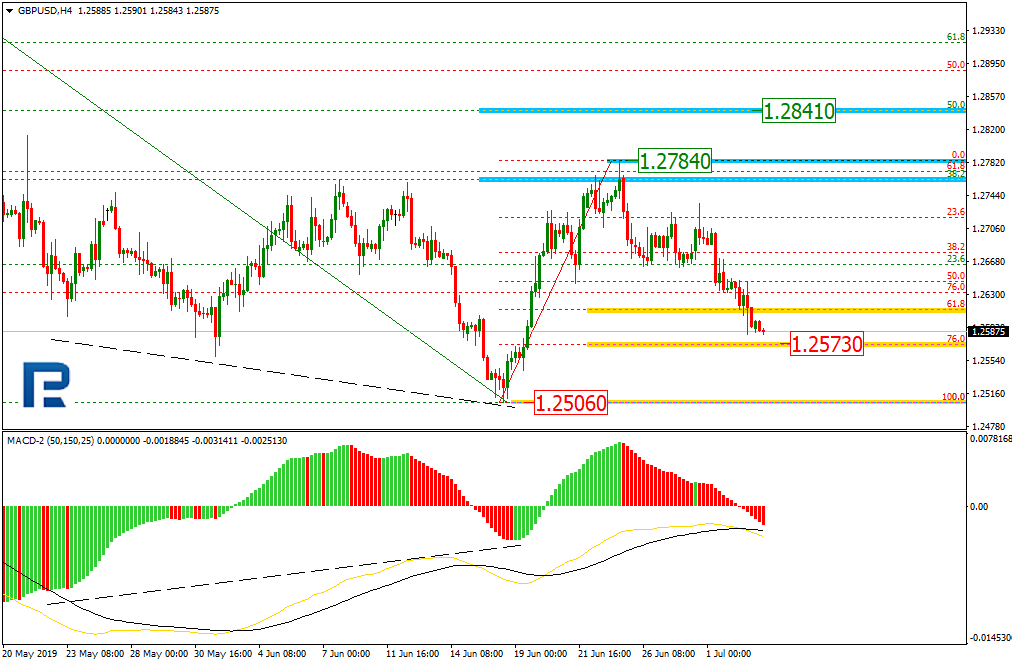
GBPUSD, “Great Britain Pound vs US Dollar”
GBPUSD is consolidating around 1.2586. Today, the pair may fall to break 1.2555 and continue trading downwards with the target at 1.2525.

USDCHF, “US Dollar vs Swiss Franc”
USDCHF is still consolidating around 0.9875. If later the price breaks the range to the upside, the instrument may form one more ascending structure towards 0.9905; if to the downside – start a new correction to reach 0.9800 and then resume trading inside the uptrend with the short-term target at 0.9950.

USDJPY, “US Dollar vs Japanese Yen”
USDJPY has broken the descending channel; right now, it is trading upwards to reach 108.18. After that, the instrument may start a new correction towards 107.87 and then form one more ascending structure with the short-term target at 108.85.

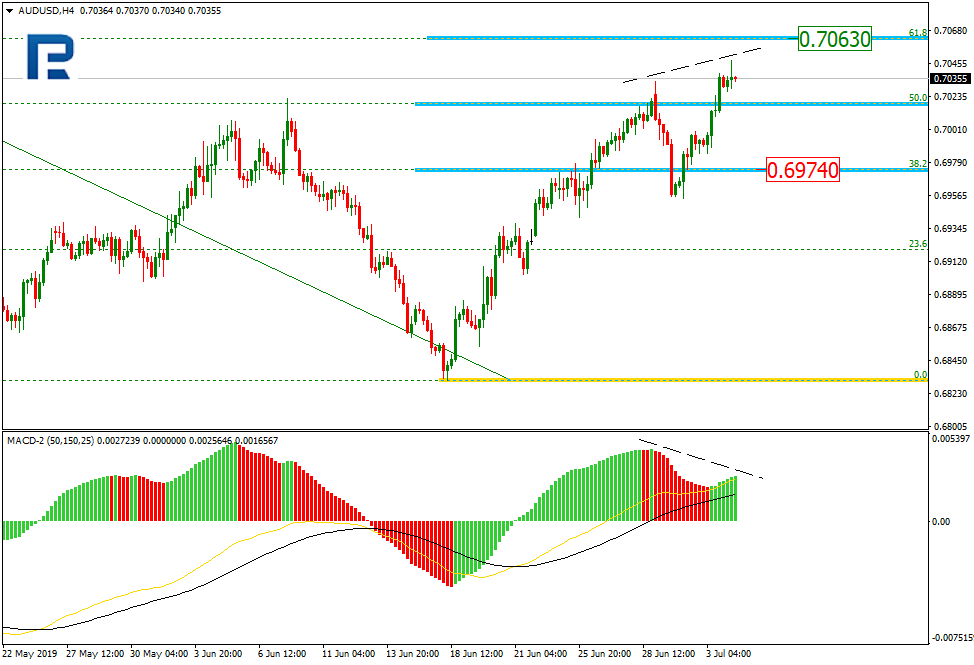
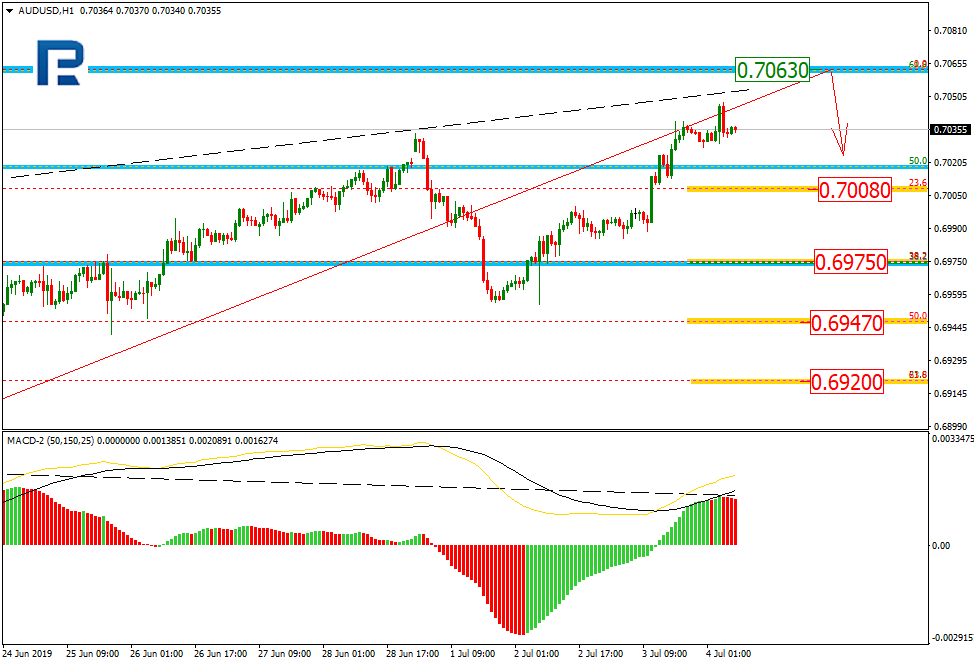
AUDUSD, “Australian Dollar vs US Dollar”
After forming the consolidation range around 0.7007, AUDUSD has broken it to the upside. Possibly, the pair may extend this ascending wave towards 0.7050 and then form a new descending structure to reach 0.7010. Later, the market may form one more ascending structure to complete the wave at 0.7070 and then resume trading downwards with the first target at 0.7000.

USDRUB, “US Dollar vs Russian Ruble”
USDRUB is still consolidating around 63.43. Possibly, the pair may break it to the upside and continue forming the third wave with the short-term target at 64.10. After that, the instrument may start another decline towards 63.60 and then continue trading upwards to reach 64.40.

XAUUSD, “Gold vs US Dollar”
Gold has broken the ascending channel. Possibly, today the pair may fall with the short-term target at 1410.60 and then start a new growth to reach 1419.55. Later, the market may continue trading downwards with the first target at 1401.70.

BRENT
Brent is trading upwards to reach 64.86. After that, the instrument may fall towards 62.00 and then form one more ascending structure to break 67.70. Later, the market may continue trading upwards to reach 70.70.

Article By RoboForex.com
Attention!
Forecasts presented in this section only reflect the author’s private opinion and should not be considered as guidance for trading. RoboForex LP bears no responsibility for trading results based on trading recommendations described in these analytical reviews.