Article By RoboForex.com
AUDUSD, “Australian Dollar vs US Dollar”
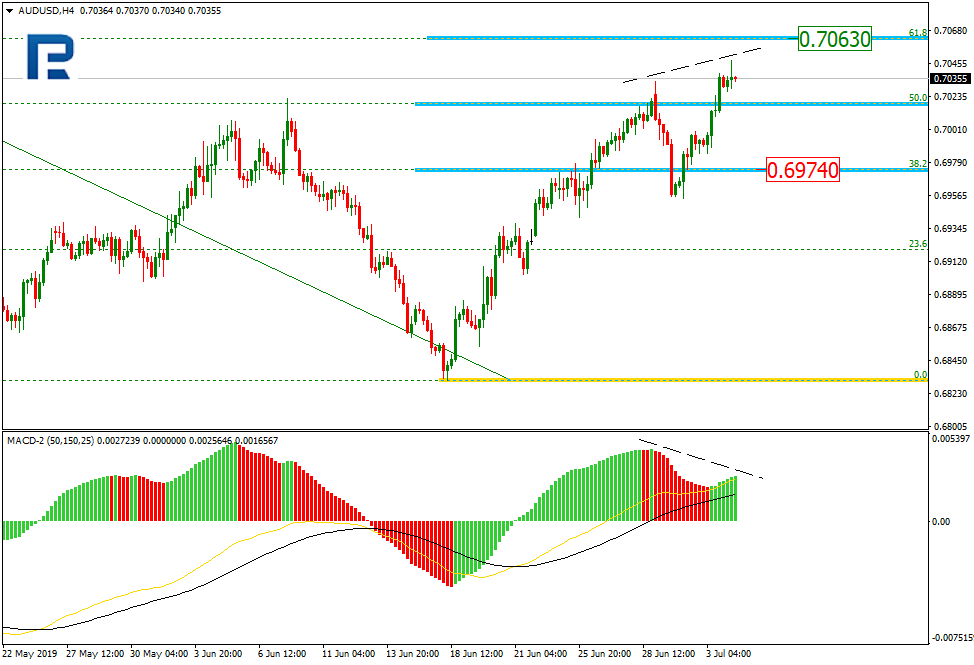
In the H4 chart, the correctional uptrend continues. AUDUSD is heading towards 61.8% fibo at 0.7062. At the same time, there is a divergence on MACD, which indicates a new decline after the current correctional uptrend. The first downside target may be 38.2% fibo at 0.6974.

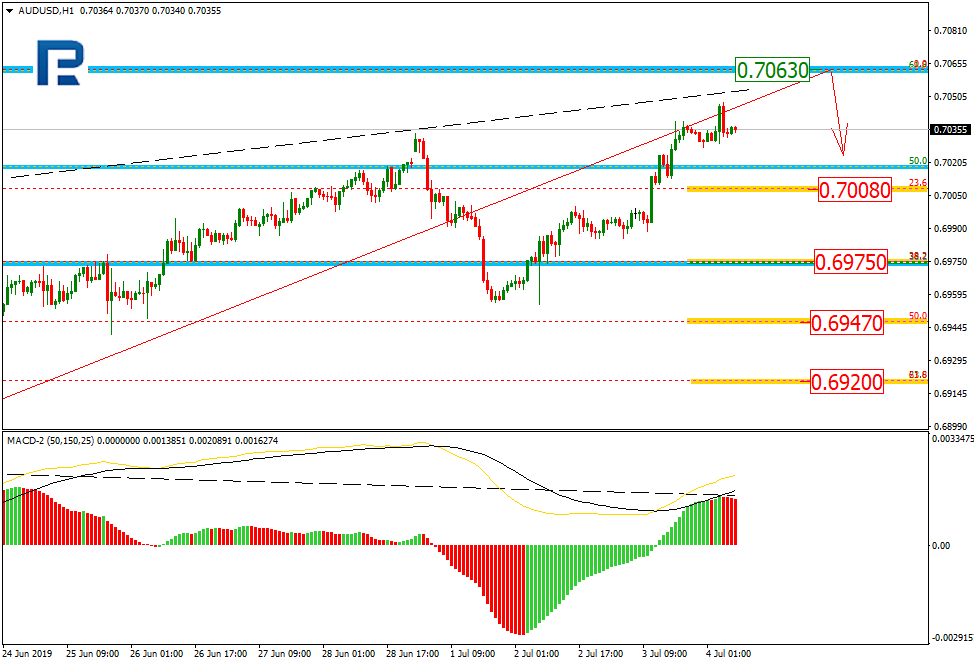
The H1 chart shows more detailed structure of the current correctional uptrend towards 61.8% fibo at 0.7063. In case the tendency reverses, the instrument may move towards 23.6%, 38.2%, 50.0%, and 61.8% fibo at 0.7008, 0.6975, 0.6947, and 0.6920 respectively.
USDCAD, “US Dollar vs Canadian Dollar”
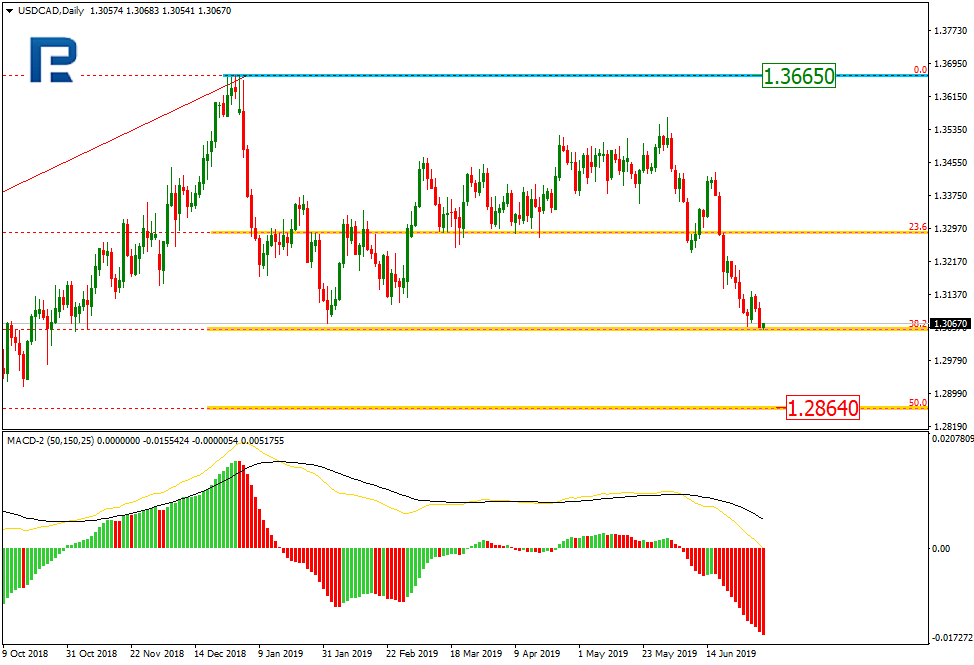
As we can see in the daily chart, the current descending wave has reached 38.2% fibo. The next downside target may be 50.0% fibo at 1.2864. The key resistance is at 1.3665.
Free Reports:
 Get Our Free Metatrader 4 Indicators - Put Our Free MetaTrader 4 Custom Indicators on your charts when you join our Weekly Newsletter
 Get our Weekly Commitment of Traders Reports - See where the biggest traders (Hedge Funds and Commercial Hedgers) are positioned in the futures markets on a weekly basis.
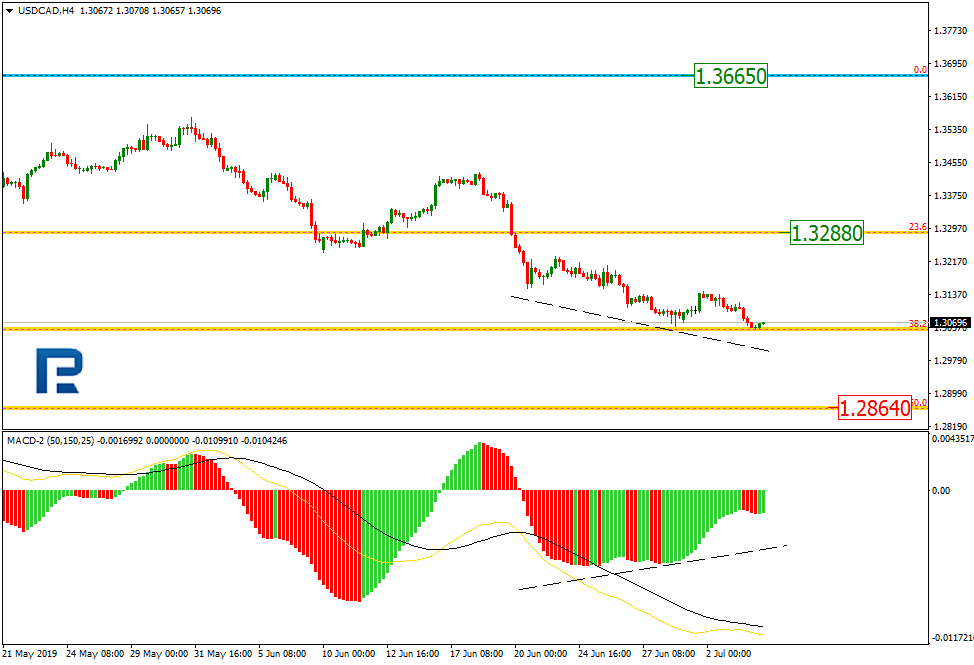
In the H4 chart, USDCAD has reached 38.2% fibo; right now, there is a convergence on MACD. In this case, the pair may start a new pullback towards the current resistance at 23.6% fibo at 1.3288.
Article By RoboForex.com
Attention!
Forecasts presented in this section only reflect the author’s private opinion and should not be considered as guidance for trading. RoboForex LP bears no responsibility for trading results based on trading recommendations described in these analytical reviews.