Author Archive for InvestMacro – Page 212

The Oil Crisis Saudi Arabia Can’t Solve

By OilPrice.com

Saudi Arabia’s CEO Amin Nasr’s message to the press that oil flows to the market are guaranteed, should be taken with a pinch of salt.

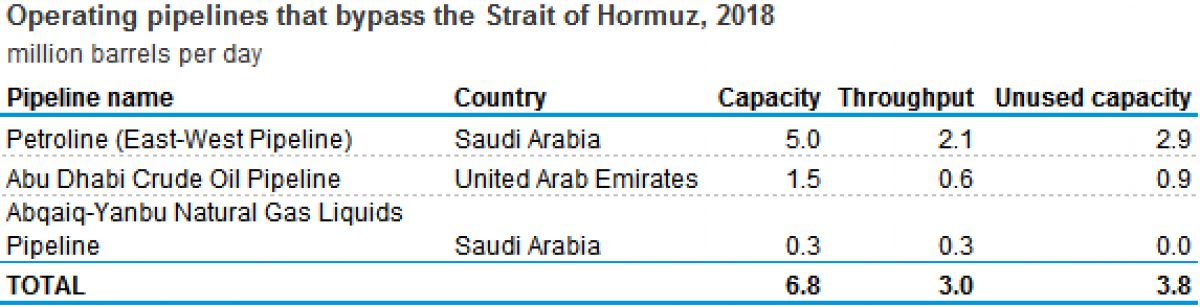
Looking at the current volatility in the Persian/Arabian Gulf and the possibility of a temporary closure of the Strait of Hormuz, the Aramco CEO’s message might be a bit overoptimistic. In reality, Aramco will not be able to keep the necessary crude oil and products volumes flowing to Asian and European markets in the case of a full Strait of Hormuz blockade. Even that Aramco owns and operates a crude oil pipeline with a capacity of 5 million bpd, carrying crude 1,200 kilometers between the Arabian Gulf and Red Sea, much more is needed to keep the oil market stable.

Nasr’s move to stabilize the market is praiseworthy but should be seen as an attempt to quell fears of traders and financial analysts, especially just before the OPEC+ meeting in Vienna next week. Nasr reiterated that Aramco (aka the Kingdom) is able to supply sufficient crude through the Red Sea, reiterating that the necessary pipeline and terminal infrastructure is there. However, what analysts tend to forget, Nasr’s statement is only linked to Saudi’s oil export volumes, which will likely be not higher this summer than around the level this pipeline can support. The real issue, if it comes to a full-blown conflict, is that not only Saudi oil is being threatened.


At present, between 20-21 million bpd of crude and petroleum products are transported via the Strait of Hormuz. Saudi exports are a vast part of it, but also the UAE, Iraq, Kuwait, Bahrain, Qatar and Iran, will have to look at additional routes. A closure or military action in the region will cause a temporary disruption for all maritime traffic. Besides the options that are the already on the table, such as the Saudi onshore pipeline and the UAE’s Fujairah pipeline, no other real alternatives are available, as overland trucking or rail transport is minimal. Transferring volumes via the Saudi and UAE’s pipelines is not an option at all, as the total capacity of the two is less than 10 million bpd, representing not even 50% of the current maritime flows through Hormuz. Another thing that should be noted is that pipelines can’t ship crude and crude products at the same time.


Another consequence of a blockade would be that most available VLCCs and other tankers will either be in the Persian Gulf (and blocked) or will not be able to be rerouted. Before the market will have found a solution for this, days and probably weeks will have gone by, and a price spike for all products is to be expected. This will likely also be the case for LNG and other commodity flows.

Few analysts are talking about oilfield security and pipeline availability. Any military advisor will put these options as part of his or her 1st phase military action plan. If Iran were to be attacked, or faces a surgical strike by an opponent, all Arab oil and gas infrastructure will become a legitimate offensive target (at least in the eyes of Tehran and its proxies). Geographically seen, Tehran has been dealt the best cards. Looking at the majority of oil and gas production assets and infrastructure in the Arab world, especially in Saudi Arabia, UAE or even Iraq, everything is in reach of short-distance missiles, fighter jets and even drones. Any move against Iran will result in a full-scale attack on Saudi’s Eastern Province (which produces 80% of all its oil and gas), Abu Dhabi’s offshore oil infrastructure and the regional pipelines. Looking at history, denying energy access and diminishing the opponents stability is a no-brainer in military strategy.

It can be taken for granted that Iran, the Houthis, Hezbollah and others, already have prepared their oil and gas infrastructure strategy. Washington, Riyadh, Abu Dhabi and even Manama, will be frantically looking for answers, but the geographical situation is disastrous.

Quelling fears in the market is the right thing to do, but reality also needs to be addressed. Nasr’s message is that of an oil company CEO, taking all precautions to deal with a calamity. ADNOC’s Sultan will be doing the same. Still, the oil market is at present a victim of geopolitical power projections of emotional leaders superseding rationality. This confrontation is one of a possibly unprecedented order, not for oil (as sceptics again will state) but with oil as a weapon for defeat or survival. The continuing reference to the Iran-Iraq tanker war during 1980-1988 is out of touch with reality. At this time, it is not going to be Iran denying support or trade with Iraq, but a possible Arab-Iranian confrontation, led by the USA if no countermeasures are being implemented.

Asian consumers will need to prepare for severe price hikes in the most optimistic scenario, but also for a shutdown of vast parts of their economy. Hormuz will not be standing on its own, more is to be taken into account, especially proxy reactions in Yemen (Gulf of Aden) or East Med (Hezbollah). Negative repercussions for Europeans are also in the picture. Saudi Arabia can do a lot, but saving the global economy if the Gulf explodes is not one of their capabilities.

Link to article: https://oilprice.com/Energy/Crude-Oil/The-Oil-Crisis-Saudi-Arabia-Cant-Solve.html

By Cyril Widdershoven for Oilprice.com


The Week Ahead: Friday 28th June 2019 – Currency Point: USD trades

By Evan Lucas, FPMarkets.com

Currency Point: USD trades

Trade idea: Sell USD/JPY

Enter: above ¥108, Stop at ¥111.00, Target ¥1.04

Opening a trade in USD/JPY after a jump up in the pair over the past week or so that is creating an entry point. The outlook from the Federal Reserve around rates is putting real pressure on the USD with the market is pricing in 4 rate cuts from the Federal Reserve by June 2020 and a 65% chance the first cut will come this month.

The US outlook is also worrying from a currency perspective as corporate earnings are starting to disappoint, forward indicators such as the Empire State PMI, Jobs claims and Building Surveys are beginning to slide. Risk off flows look likely and flows to safety are growing.

Risk for the trade: Trade wars abate.

Trade Idea: Buy AUD/USD (Post RBA meeting)

Enter: below $0.70, Stop: $0.6840 (recent low), Target $0.7280

Market currently pricing a 25-basis point cut at Tuesday’s RBA meeting at 78%. The market has completely priced in a further 50 basis points out of the cash rate by December 2019.

However, the flow in the pair is heavily skewed to the USD side and the likely unwinding of USD longs over the coming month with the Federal Reserve in play puts upside into the pair. The RBA governor Philip Lowe highlighted this exact point last week stating that if all central banks are looking to stimulus simultaneously those smaller players (Australia) will not see the economic benefit of a lower currency.

Risk for the trade: Iron ore prices falling back below US$100 a tonne, trade wars intensify.

Trade Idea: Sell USD/CAD

Enter: above $1.32, Stop: $1.338, Target $1.291

Pair should trade lower over the coming months as Canadian economics remains robust even in the face of a slowing global market while the US is slowing. Governor Poloz should be happy core inflation came in above expectations at the recent release and that should see the Bank of Canada on hold for the coming period. Couple this with Canadian corporate earnings which are holding the line – CAD looks attractive.

We also expect the unwinding of USD long positions to drive this position lower.

Risk to the trade: negative outcomes from G20, collapse of oil below $50 a barrel.

By Evan Lucas, FPMarkets.com


Forex Technical Analysis & Forecast 28.06.2019 (EURUSD, GBPUSD, USDCHF, USDJPY, AUDUSD, USDRUB, GOLD, BRENT)

Article By RoboForex.com

EURUSD, “Euro vs US Dollar”

EURUSD is still consolidating around 1.1360. Today, the pair may continue forming the descending wave with the target at 1.1331. After that, the instrument may form a new consolidation range. Later, the market may break it to the downside and then resume trading downwards with the target at 1.1272.

EURUSD_Технический анализ
Risk Warning: the result of previous trading operations do not guarantee the same results in the future

GBPUSD, “Great Britain Pound vs US Dollar”

GBPUSD continue trading downwards to reach 1.2647. Possibly, today the pair may reach this level and then start a new correction with the target at 1.2724.

GBPUSD_Технический анализ
Risk Warning: the result of previous trading operations do not guarantee the same results in the future

USDCHF, “US Dollar vs Swiss Franc”

USDCHF is being corrected towards 0.9750. After that, the instrument may form one more ascending structure with the first target at 0.9832 and start a new correction towards 0.9750.

USDCHF_Технический анализ
Risk Warning: the result of previous trading operations do not guarantee the same results in the future

USDJPY, “US Dollar vs Japanese Yen”

After forming the consolidation range around 107.80, USDJPY has broken it downwards. Possibly, the pair may continue trading downwards to reach 107.42. Later, the market may form one more ascending structure with the target at 108.18.

USDJPY_Технический анализ
Risk Warning: the result of previous trading operations do not guarantee the same results in the future

AUDUSD, “Australian Dollar vs US Dollar”

AUDUSD continues trading upwards. Possibly, today the pair may reach 0.7020 and then start another with the first target at 0.6926.

AUDUSD_Технический анализ
Risk Warning: the result of previous trading operations do not guarantee the same results in the future

USDRUB, “US Dollar vs Russian Ruble”

USDRUB is still consolidating around 62.95. If later the price breaks this range to the upside, the instrument may resume trading upwards with the first target at 63.43.

USDRUB_Технический анализ
Risk Warning: the result of previous trading operations do not guarantee the same results in the future

XAUUSD, “Gold vs US Dollar”

Gold is consolidating around 1407.33 and forming Divergent Triangle pattern; the price has reached its upside border. Today, the pair may form a new descending structure with the first target at 1395.78.

GOLD_Технический анализ
Risk Warning: the result of previous trading operations do not guarantee the same results in the future

BRENT

Brent is still consolidating around 65.65 without any particular direction. If later the price breaks the range to the upside, the instrument may continue trading inside the uptrend to reach 67.67; if to the downside – start a new correction with the target at 64.00.

BRENT_Технический анализ

Article By RoboForex.com

Attention!
Forecasts presented in this section only reflect the author’s private opinion and should not be considered as guidance for trading. RoboForex LP bears no responsibility for trading results based on trading recommendations described in these analytical reviews.

Fibonacci Retracements Analysis 28.06.2019 (BITCOIN, ETHEREUM)

Article By RoboForex.com

BTCUSD, “Bitcoin vs US Dollar”

As we can see in the daily chart, there was a divergence on MACD, which made BTCUSD reverse at 13857.20 and start a new decline. This decline may be considered as a correction, which may be followed by a new rising wave. The current descending impulse has already broken 23.6% fibo and may continue falling towards 38.2%, 50.0%, and 61.8% fibo at 9837.00, 8590.00, and 7370.00 respectively. The resistance is the high at 13857.20.

BTCUSD_Анализ по Фибоначчи
Risk Warning: the result of previous trading operations do not guarantee the same results in the future

The H4 chart shows more detailed structure of the current movement.

BITCOIN_Анализ по Фибоначчи
Risk Warning: the result of previous trading operations do not guarantee the same results in the future

ETHUSD, “Ethereum vs. US Dollar”

As we can see in the daily chart, there was a divergence on MACD, which made ETHUSD start moving downwards. The resistance is the high at 363.18. The current decline is heading towards 38.2%, 50.0%, and 61.8% fibo at 262.65, 232.13, and 200.91 respectively.

ETHUSD_Анализ по Фибоначчи
Risk Warning: the result of previous trading operations do not guarantee the same results in the future

In the H4 chart, the pair is getting back to 23.6% fibo 262.65.

ETHEREUM_Анализ по Фибоначчи

Article By RoboForex.com

Attention!
Forecasts presented in this section only reflect the author’s private opinion and should not be considered as guidance for trading. RoboForex LP bears no responsibility for trading results based on trading recommendations described in these analytical reviews.

The Analytical Overview of the Main Currency Pairs on 2019.06.27

by JustForex

The EUR/USD currency pair

Technical indicators of the currency pair:
  • Prev Open: 1.13665
  • Open: 1.13677
  • % chg. over the last day: +0.02
  • Day’s range: 1.13478 – 1.13748
  • 52 wk range: 1.1111 – 1.2009

The EUR/USD stabilized after a rather long rally. The trading instrument is consolidating. Local levels of support and resistance are 1.13400 and 1.13750. Concerns about an aggressive reduction in interest rates (by 50 basis points) dropped significantly after the comments of Fed Chairman Jerome Powell on Tuesday. At the same time, more than 75% of financial market participants believe that the regulator will reduce the range of key interest rate by 25 basis points to 2.00% -2.25% at a meeting in July. Investors took a wait-and-see stance before the G20 summit, at which the leaders of the United States and China should once again discuss trade disputes. Recall that the G20 summit will be held in Osaka from 28 to 29 June. Today we recommend to pay attention to economic releases from the USA. Positions must be opened from key levels.

The Economic News Feed for 27.06.2019:

  • – GDP report (US) – 15:30 (GMT+3:00);
  • – Unfinished Real Estate Sales Index (US) – 17:00 (GMT+3:00);
EUR/USD

The indicators do not provide precise signals, the price has crossed 50 MA and 100 MA.

The MACD histogram is close to 0.

The Stochastic Oscillator is in the oversold zone, the %K line is crossing the %D line. There are no signals at the moment.

Trading recommendations
  • Support levels: 1.13400, 1.13100, 1.12700
  • Resistance levels: 1.13750, 1.14100, 1.14500

If the price fixes below 1.13400, expect further correction towards 1.13100-1.12800.

Alternatively, the quotes can grow towards 1.14100-1.14400.

The GBP/USD currency pair

Technical indicators of the currency pair:
  • Prev Open: 1.26861
  • Open: 1.26840
  • % chg. over the last day: -0.02
  • Day’s range: 1.26743 – 1.26973
  • 52 wk range: 1.2438 – 1.3631

An ambiguous technical picture emerged on the GBP/USD currency pair. Streling is trading in a flat. GBP/USD quotes test local support and resistance levels: 1.26650 and 1.27150, respectively. Boris Johnson, the main contender for the post of Prime Minister of the United Kingdom, said that he was “serious” about withdrawing Britain from the EU by October 31 without concluding a deal if the block refuses to negotiate a new withdrawal agreement. We recommend to keep track of current information on the issue of Brexit. The trading instrument has the potential for further correction. Positions must be opened from key levels.

The Economic News Feed for 27.06.2019 is calm.

GBP/USD

The indicators do not provide precise signals, 50 MA has crossed 100 MA.

The MACD histogram is close to 0.

The Stochastic Oscillator is in the neutral zone, the %K line is crossing the %D line. There are no signals.

Trading recommendations
  • Support levels: 1.26650, 1.26400, 1.26000
  • Resistance levels: 1.27150, 1.27600, 1.27850

If the price fixes below 1.26650, expect further correction towards 1.26300-1.26000.

Alternatively, the quotes can grow towards 1.27500-1.27700.

The USD/CAD currency pair

Technical indicators of the currency pair:
  • Prev Open: 1.31687
  • Open: 1.31258
  • % chg. over the last day: -0.37
  • Day’s range: 1.31173 – 1.31380
  • 52 wk range: 1.2727 – 1.3664

The USD/CAD has once again moved to a decline. Yesterday, the drop in quotes exceeded 50 points, CAD updated the key lows. At the moment, the trading instrument is consolidating. The quotes found support at 1.31100. Mark 1.31600 is already a “mirror” resistance. The pair has the potential to decline further. Additional support for the Canadian dollar is caused by a positive trend in prices for oil. Open positions from key levels.

The Economic News Feed for 27.06.2019:

USD/CAD

The price fixed below 50 MA and 100 MA which points to the power of the sellers.

The MACD histogram is in the negative zone but above the signal line which gives a weak signal to sell USD/CAD.

The Stochastic Oscillator is in the overbought zone, the %K line is crossing the %D line. There are no signals.

Trading recommendations
  • Support levels: 1.31100, 1.31000, 1.30600
  • Resistance levels: 1.31600, 1.32000, 1.32250

If the price fixed below 1.31100, expect further descend towards 1.30800-1.30600.

Alternatively, the quotes can correct towards 1.32000-1.32250.

The USD/JPY currency pair

Technical indicators of the currency pair:
  • Prev Open: 107.170
  • Open: 107.776
  • % chg. over the last day: +0.52
  • Day’s range: 107.647 – 108.132
  • 52 wk range: 104.97 – 114.56

The USD / JPY currency pair shows a positive trend. The trading instrument has updated local maxima. At the moment, the quotes are testing the key resistance level of 108.100. 107.750 is already a “mirror” support. The USD/JPY currency pair has the potential for further recovery. We recommend to pay attention to economic releases from the United States. Positions must be opened from key levels.

The Economic News Feed for 27.06.2019 is calm.

USD/JPY

The price fixed above 50 MA and 100 MA which points to the power of the buyers.

The MACD histogram is in the positive zone and abov the signal line which gives a strong signal to buy USD/JPY.

The Stochastic Oscillator is in the overbought zone, the %K line is crossing the %D line. There are no signals.

Trading recommendations
  • Support levels: 107.750, 107.500, 107.100
  • Resistance levels: 108.100, 108.450, 108.700

If the price fixes above 108.100, expect further growth towards 108.400-108.600.

Alternatively, the quotes can fall towards 107.500-107.300.

by JustForex

Investors Have Taken a Wait-and-See Attitude Before the G20 Summit in Japan

by JustForex

The US dollar shows mixed results against a basket of world currencies. Investors have taken a wait-and-see attitude before the G20 summit in Japan, which will start tomorrow. Financial market participants are counting on a breakthrough in the US-China trade relations. The US currency was supported by statements by US Treasury Secretary, Steven Mnuchin, that the US-China trade agreement was almost 100% done, and he believed that negotiations between Donald Trump and Xi Jinping in Japan would succeed. The US dollar index (#DX) closed yesterday in a positive zone (+0.08%).

Trump and Xi Jinping should meet on Saturday at the G20 summit. The result of this meeting will affect not only the world economy but also all financial markets that have been suspended for the last two years. According to the South China Morning Post, the United States and China intend to declare a truce in the trade war ahead of the G20 summit to resolve disputes during the meeting. The condition for holding a meeting between Xi Jinping and Donald Trump in Osaka was to delay the imposition of additional duties by the United States on Chinese goods.

The “black gold” prices have been declining after a significant increase the day before. At the moment, futures for the WTI crude oil are testing the mark of $59.00 per barrel.

Market Indicators

Yesterday, there was a variety of trends in the US stock market: #SPY (-0.10%), #DIA (-0.02%), #QQQ (+0.47%).

The 10-year US government bonds yield has been growing. Currently, the indicator is at the level of 2.06-2.07%.

The news feed on 2019.06.27:

– Data on US GDP at 15:30 (GMT+3:00);
– Pending home sales in the US at 17:00 (GMT+3:00).

by JustForex

EURUSD: bulls exploiting the bears’ stop levels

By Alpari.com

Previous:

On Thursday the 27th of June, trading on the euro closed at the same level as on Wednesday (1.1369). Trading on the euro was stable against the dollar throughout the day. I think the reason for this is the upcoming G20 summit along with a lack of remarks from Trump directed at China. A Chinese representative said that China is ready to conclude a balanced trade agreement with the US, although the US isn’t interested in this.

US President Donald Trump said that there’s a possibility of reaching a trade agreement with China during the meeting. There are rumours that there’s already a preliminary agreement in the works that will see China avoid tariffs on 300bn USD of Chinese goods.

Day’s news (GMT+3):

  • 11:30 UK: current account (Q1).
  • 15:30 Canada: GDP (Apr).
  • 15:30 US: personal income (May), personal spending (May)
  • 16:45 US: Chicago PMI (Jun).
  • 17:00 US: Michigan consumer sentiment index (Jun).
  • 17:30 Canada: Bank of Canada outlook survey.
  • 20:00 US: Baker Hughes US oil rig count.

EURUSD H1Current situation:

At the time of writing, the euro is trading at 1.1375. The bulls have broken the resistance and have set their sights on 1.1395. I can’t see the pair rising any further than the 45th degree given that traders are being cautious ahead of the G20 summit this weekend. Investors expect the US and China to agree to a truce in their trade conflict. However, uncertainty remains due top Trump’s volatility. In today’s forecast, I’m expecting the bulls to trigger the stop levels above 1.1376, 1.1391, and 1.1391. As soon as they’re triggered, we should see a drop to 1.1370.

By Alpari.com

USD/JPY positive on Mnuchin’s trade deal comment – sell the bounce?

By Admiral Markets

Source: Economic Events June 28, 2019 – Admiral Markets’ Forex Calendar

As we go into the weekly close, we want to have a look at a currently very interesting currency pair: USD/JPY. The excitement results mainly out of the upcoming G20 summit where market participants hope to get clear signs in regards to a potential between the US and China.

On Wednesday, US Treasury Secretary Mnuchin said a US-China trade deal is 90% complete

Unfortunately, this is not shocking news, and was announced in a very similar way in April. We all know that shortly after the negotiations between the USA and China collapsed shortly after with US president Trump announcing a new round of tariffs on Chinese goods and putting Huawei on a blacklist.

That said, the initial bullish reaction in USD/JPY back towards and slightly above 108.00 on Wednesday/Thursday may be short-lived with the currency pair finding a potential short-trigger around 107.80/108.00 and taking on bearish momentum again.

If, over the weekend and during the G20 summit in Osaka/Japan, it appears that still no deal between the USA and China is coming, the path down to the Flash Crash lows from January around 105.00 seems levelled.

Technically this bearish outlook stays true as long as we trade below 108.70/109.00 on a daily time frame:

Source: Admiral Markets MT5 with MT5-SE Add-on USD/JPY Daily chart (between March 29, 2018, to June 27, 2019). Accessed: June 27, 2019, at 10:00pm GMT – Please note: Past performance is not a reliable indicator of future results, or future performance.

In 2014, the value of USD/JPY increased by 13.7%, in 2015, it increased by 0.5%, in 2016, it fell by 2.8%, in 2017, it fell by 3.6%, in 2018, it fell by 2.7%, meaning that after five years, it was up by 4.1%.

Investing in Forex with Admiral Markets

Admiral Markets offers professional traders the ability to trade with a custom, upgraded version of MetaTrader 5, allowing you to experience trading at a significantly higher, more rewarding level. Experience benefits such as the addition of the Market Heat Map, so you can compare various currency pairs to see which ones might be lucrative investments, access real-time trading data, and so much more. Click the banner below to start your FREE download of MT5 Supreme Edition!

Download MetaTrader 5 and begin trading today!

Disclaimer: The given data provides additional information regarding all analysis, estimates, prognosis, forecasts or other similar assessments or information (hereinafter “Analysis”) published on the website of Admiral Markets. Before making any investment decisions please pay close attention to the following:

  1. This is a marketing communication. The analysis is published for informative purposes only and are in no way to be construed as investment advice or recommendation. It has not been prepared in accordance with legal requirements designed to promote the independence of investment research, and that it is not subject to any prohibition on dealing ahead of the dissemination of investment research.
  2. Any investment decision is made by each client alone whereas Admiral Markets shall not be responsible for any loss or damage arising from any such decision, whether or not based on the Analysis.
  3. Each of the Analysis is prepared by an independent analyst (Jens Klatt, Professional Trader and Analyst, hereinafter “Author”) based on the Author’s personal estimations.
  4. To ensure that the interests of the clients would be protected and objectivity of the Analysis would not be damaged Admiral Markets has established relevant internal procedures for prevention and management of conflicts of interest.
  5. Whilst every reasonable effort is taken to ensure that all sources of the Analysis are reliable and that all information is presented, as much as possible, in an understandable, timely, precise and complete manner, Admiral Markets does not guarantee the accuracy or completeness of any information contained within the Analysis. The presented figures refer that refer to any past performance is not a reliable indicator of future results.
  6. The contents of the Analysis should not be construed as an express or implied promise, guarantee or implication by Admiral Markets that the client shall profit from the strategies therein or that losses in connection therewith may or shall be limited.
  7. Any kind of previous or modeled performance of financial instruments indicated within the Publication should not be construed as an express or implied promise, guarantee or implication by Admiral Markets for any future performance. The value of the financial instrument may both increase and decrease and the preservation of the asset value is not guaranteed.
  8. The projections included in the Analysis may be subject to additional fees, taxes or other charges, depending on the subject of the Publication. The price list applicable to the services provided by Admiral Markets is publicly available from the website of Admiral Markets.

Leveraged products (including contracts for difference) are speculative in nature and may result in losses or profit. Before you start trading, you should make sure that you understand all the risks.

By Admiral Markets

Silver, Platinum Gaining New Interest

By TheTechnicalTraders.com

BECOME A TECHNICAL TRADER TODAY AND
TRADE WHAT MATTERS – PRICE ACTION!
CLICK HERE

Chris Vermeulen

TheTechnicalTraders.com


Ichimoku Cloud Analysis 27.06.2019 (AUDUSD, NZDUSD, USDCAD)

Article By RoboForex.com

AUDUSD, “Australian Dollar vs US Dollar”

AUDUSD is trading at 0.6990; the instrument is moving above Ichimoku Cloud, thus indicating an ascending tendency. The markets could indicate that the price may test the cloud’s upside border at 0.6975 and then resume moving upwards to reach 0.7065. Another signal to confirm further ascending movement is the price’s rebounding from the channel’s downside border. However, the scenario that implies further growth may be cancelled if the price breaks the cloud’s downside border and fixes below 0.6945. In this case, the pair may continue falling towards 0.6895.

AUDUSD_Анализ индикатора Ишимоку
Risk Warning: the result of previous trading operations do not guarantee the same results in the future

NZDUSD, “New Zealand Dollar vs US Dollar”

NZDUSD is trading at 0.6675; the instrument is moving above Ichimoku Cloud, thus indicating an ascending tendency. The markets could indicate that the price may test the cloud’s downside border at 0.6650 and then resume moving upwards to reach 0.6770. Another signal to confirm further ascending movement is the price’s rebounding from the support level. However, the scenario that implies further growth may be cancelled if the price breaks the cloud’s downside border and fixes below 0.6615. In this case, the pair may continue falling towards 0.6545.

NZDUSD_Анализ индикатора Ишимоку
Risk Warning: the result of previous trading operations do not guarantee the same results in the future

USDCAD, “US Dollar vs Canadian Dollar”

USDCAD is trading at 1.3130; the instrument is moving below Ichimoku Cloud, thus indicating a descending tendency. The markets could indicate that the price may test the cloud’s downside border at 1.3145 and then resume moving downwards to reach 1.3030. Another signal to confirm further descending movement is the price’s rebounding from the resistance level. However, the scenario that implies further decline may be cancelled if the price breaks the cloud’s upside border and fixes above 1.3190. In this case, the pair may continue growing towards 1.3275.

USDCAD_Анализ индикатора Ишимоку
Risk Warning: the result of previous trading operations do not guarantee the same results in the future

Article By RoboForex.com

Attention!
Forecasts presented in this section only reflect the author’s private opinion and should not be considered as guidance for trading. RoboForex LP bears no responsibility for trading results based on trading recommendations described in these analytical reviews.