Article By RoboForex.com
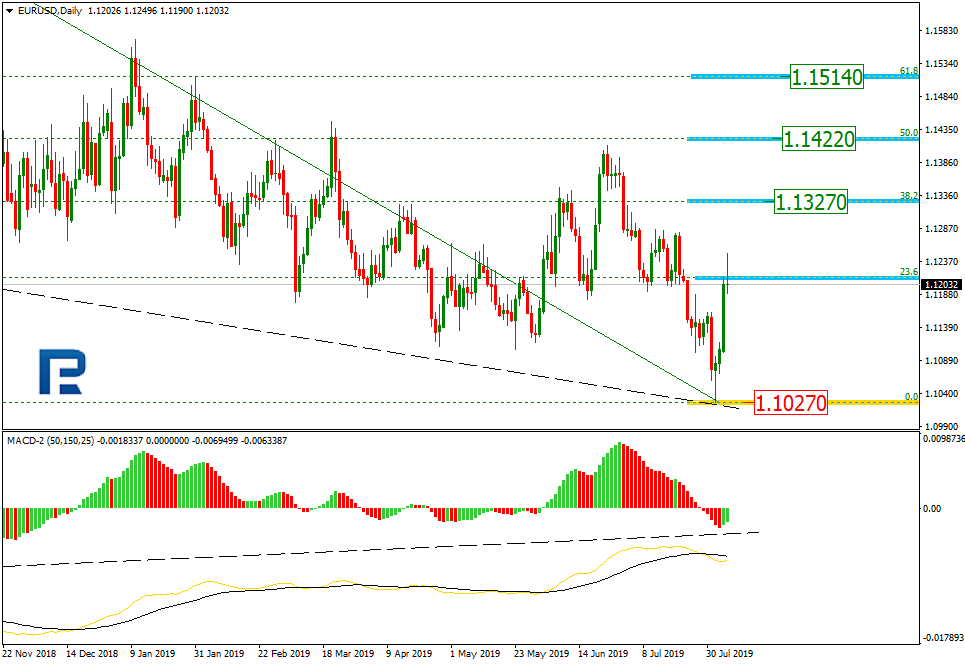
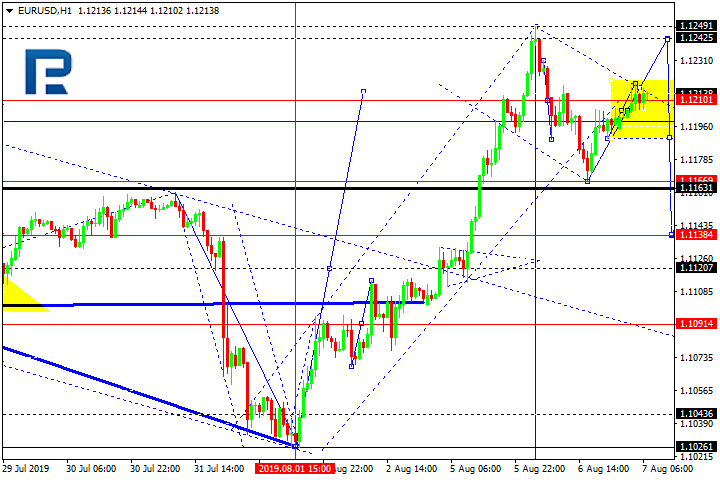
EURUSD, “Euro vs US Dollar”
EURUSD has finished the first descending impulse along with the correction at 1.1210. According to the main scenario, the price may form the second descending impulse to break 1.1166 and then continue trading inside the downtrend with the short-term predicted target at 1.1120. However, an alternative scenario implies that the pair may form one more ascending structure to reach 1.1242 and then resume trading downwards.

GBPUSD, “Great Britain Pound vs US Dollar”
GBPUSD has reached the target of Flag pattern. Today, the pair may continue trading inside the downtrend towards 1.2000. The first downside target is at 1.2133. Later, the market may form one more ascending structure towards 1.2171 and then start another decline to reach 1.2078. After that, the instrument may grow towards 1.2130 and then continue trading downwards with the key downside target at 1.2000.

USDCHF, “US Dollar vs Swiss Franc”
USDCHF has completed the first ascending wave along with the correction. Possibly, today the pair may form the second impulse to break 0.9815 and then continue trading inside the uptrend with the predicted target at 0.9870. However, an alternative scenario implies that the price may form a new descending structure to reach 0.9725 and then resume moving upwards.

USDJPY, “US Dollar vs Japanese Yen”
USDJPY is still consolidating around 106.10 in the center of the range. Today, the pair may fall towards 105.60 and then start a new growth to return to 106.10. Later, the market may continue trading downwards with the key downside target at 105.11. However, an alternative scenario implies that the price may continue the correction to reach 106.60.

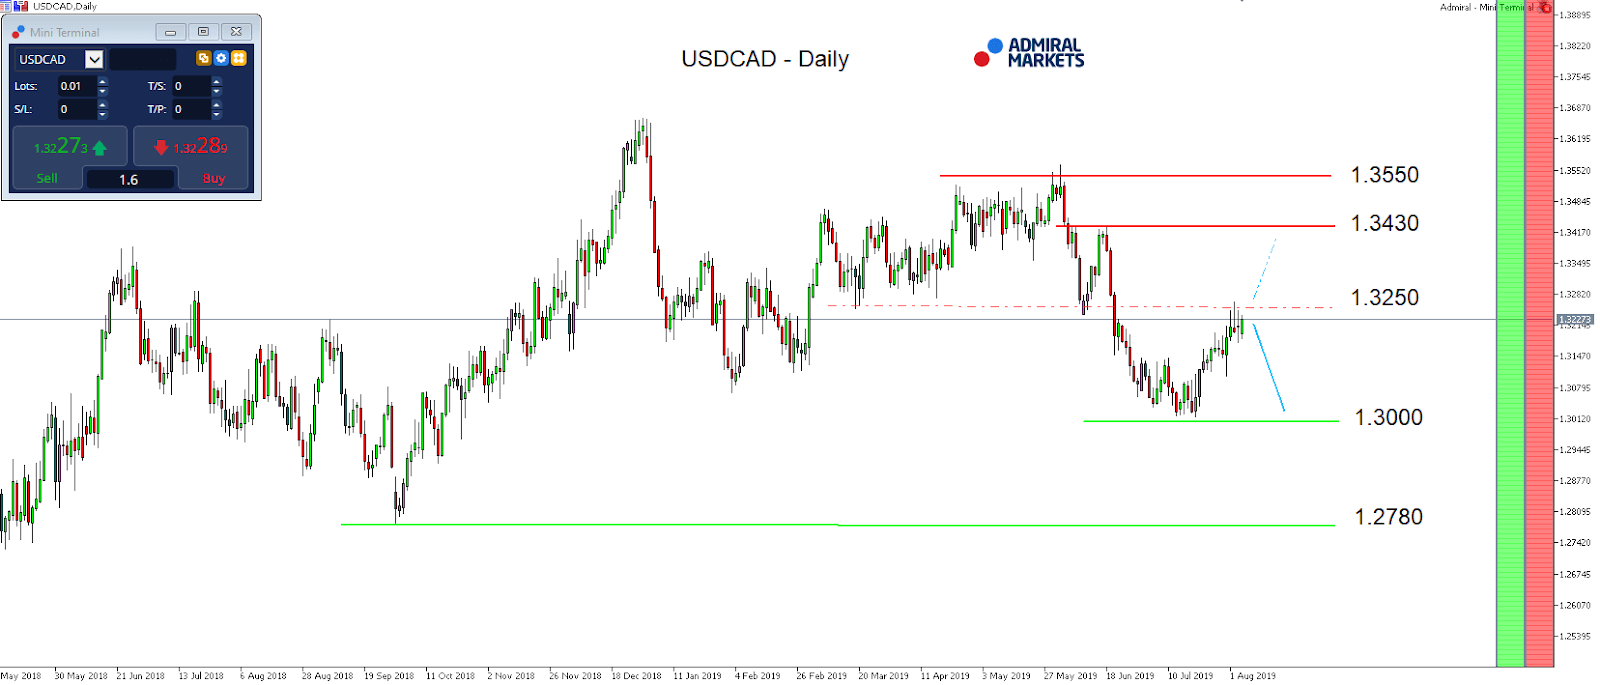
AUDUSD, “Australian Dollar vs US Dollar”
AUDUSD has reached its downside target. Possibly, today the pair may form a new consolidation range near the lows. Possibly, the pair may start another decline towards 0.6670 and then form one more ascending structure with the target at 0.6770.

USDRUB, “US Dollar vs Russian Ruble”
USDRUB is consolidating at the top of the ascending wave. Possibly, the pair may update 65.50 and then resume trading downwards with the first target at 64.15.

XAUUSD, “Gold vs US Dollar”
Gold is moving upwards. After breaking 1475.80 and forming a continuation pattern, today the pair may extend this structure towards 1497.11 (an alternative scenario). According to the main scenario, the price may start forming the first descending wave with the target at 1440.00.

BRENT
Brent is still moving downwards; it has broken 59.90 and may continue falling towards 58.45. After that, the instrument may form a new consolidation range with a reversal pattern. The pair is expected to start the first ascending wave with the target at 63.15.

Article By RoboForex.com
Attention!
Forecasts presented in this section only reflect the author’s private opinion and should not be considered as guidance for trading. RoboForex LP bears no responsibility for trading results based on trading recommendations described in these analytical reviews.