On Thursday the 8th of August, trading on the euro closed down. The EURUSD pair remained within Wednesday’s range. Markets have stabilised for the time being following reports that the US and China are set to continue trade talks in September. Investors were also calmed by the PBOC’s statement that it has not manipulated the value of the yuan to mitigate the effects of increased tariffs from the US on Chinese goods.
Day’s news (GMT+3):
11:30 UK: GDP (Q2), industrial production (Jun), manufacturing production (Jun), trade balance (Jun).
15:15 Canada: housing starts (Jul).
15:30 Canada: unemployment rate (Jul), net change in employment (Jul), building permits (Jun).
15:30 US: PPI (Jul).
16:00 UK: NIESR GDP estimate (Jul).
20:00 US: Baker Hughes US oil rig count.
Current situation:
The bears didn’t make it to the 67th degree (1.1162) on Thursday. The drop came to an end at around 1.1180. We can’t rule out an upwards rebound here given Donald Trump’s dissatisfaction with the strong US dollar.
On Friday the 9th of August, the majors are trading slightly up against the dollar. Taking into account the pricing model that we’ve drawn based on the 1.1250 high, I’m leaning more towards a drop to the lower boundary of the B-B channel and the 67th degree. I think this needs to happen before we can get a new rally.
Investors are mostly focused on the movements of the yuan. If they start to move towards safe haven assets ahead of the weekend, we can expect the euro to rise. Judging by the indicators, we should expect a decline ahead of the US session, followed by a rise to 1.1195.
We’re borrowing a term from the movie Red October (source) that describes an unusual change of direction for a Russian submarine with the intent to seek out enemies and unknown targets – called a “Crazy Ivan”. We are using this term because we believe the markets are about to pull a very unusual “Crazy Ivan” move of their own – reverting to unknown price levels while the US/Global markets attempt to seek out risk, support, resistance and other unknown “revaluation” targets in the process.
Our belief is that a key cycle date, August 19, 2019, will be the start of a breakdown in the US markets that aligns with some outside type of catalyst event. It could be that foreign central banks issue some news or warning at that time or it could be that Asia/China issue some type of catalyst to the event. We don’t know what the catalyst will be but we can guess that it will be related to geopolitics or the global economy/credit/debt issues. God forbid it to be some type of war or human crisis event – we really don’t need that right now.
Please review these earlier research posts for more information :
Our job as research analysts is to highlight what we believe is likely to happen and why we believe it is likely to happen. Therefore, without guessing as to the cause of the event, let’s focus on the “Crazy Ivan” event and how we can attempt to profit from it.
First, let’s take a look at the VIX chart. The VIX basing level (the lowest level the VIX has attained between price spikes) has been increasing as US stock market volatility continues to increase. The nature of the calculations that make up the VIX would suggest this increase in basing levels would happen as extended volatility continues to be present in the markets – so this is expected. What is not expected is the August 19th price inflection point that we believe will drive an unexpected price reversion in the US and global stock markets. We believe this cycle inflection date is key to understanding how the markets will react going into the end of 2019 and beyond.
If our analysis is correct, then we believe a breakdown in the US and global markets will occur on or shortly after August 19, 2019, where the US stock markets are poised for a -15% to -25% price reversion. This downside move in the US stock market would set up an incredible “price anomaly” for skilled technical traders that should provide an incredible opportunity for future profits.
We believe the ultimate downside potential for this move may last all the way through the end of 2019 and into early 2020 – although we can’t be certain yet as to the depth and severity of this move using our predictive modeling tools and utilities. All we know is that it is about to happen based on what our predictive modeling tools are telling us and we have continued to try to warn you of this move for the past few months. So here it is – the Crazy Ivan (as we’re calling it).
Any VIX rally that pushes the price above 30 or 40 would have to be rather severe compared to previous rotations. The spikes on this chart related as follows on the NQ chart :
Early May VIX Spike to 23.31 resulted in a -938.25 point move (-11.91%) in the NQ
The current August VIX spike to 24.80 resulted in a -848.75 point move (-10.54%) in the NQ.
What would a move to above 32 in the VIX look like on the NQ chart? How about a move to above 42 on the VIX? Hello Crazy Ivan.
This next chart of the NQ on a monthly basis highlights our Adaptive Dynamic Learning (ADL) predictive modeling system at work. This utility helps us to understand where the price will want to target in the future and also helps us to understand trend and outlying price trends (or price anomalies). Price anomalies happen when price moves substantially away from where the ADL predictive modeling system is suggesting price wants to be at. Thus, if the price of the NQ were to fall below $5500 very quickly (think Crazy Ivan) and our ADL modeling tool suggests that price really wants to be at $6800 at that time, then we have a $3300 price anomaly setting up. This is a type of reactive price anomaly that suggests price is way off target and will attempt to revert to levels closer to the ADL predictive price levels.
We believe the Crazy Ivan event could push the price of the NQ much lower than our ADL predictive modeling system is suggesting and create a price anomaly that may become one of the most profitable trades near the end of 2019.
You can see from this ADL predictive modeling chart that price is expected to be lower near the end of 2019, but steadily climb higher into early 2020. If price were to end up below 6400 by the end of 2019, that would set up a 1000+ point price anomaly setup that could become an incredible upside price move in early 2020. Time will tell as this Crazy Ivan event plays out.
CONCLUDING THOUGHTS:
In the second part of this article, we’ll study the Crazy Ivan event in the metals and show you what we believe will happen to both Gold and Silver as this event plays out. You won’t want to miss this one.
WARNING SIGNS ABOUT GOLD, SILVER, MINERS, AND S&P 500
In early June I posted a detailed video explaining in showing the bottoming formation and gold and where to spot the breakout level, I also talked about crude oil reaching it upside target after a double bottom, and I called short term top in the SP 500 index. This was one of my premarket videos for members it gives you a good taste of what you can expect each and every morning before the Opening Bell. Watch Video Here.
I then posted a detailed report talking about where the next bull and bear markets are and how to identify them. This report focused mainly on the SP 500 index and the gold miners index. My charts compared the 2008 market top and bear market along with the 2019 market prices today. See Comparison Charts Here.
On June 26th I posted that silver was likely to pause for a week or two before it took another run up on June 26. This played out perfectly as well and silver is now head up to our first key price target of $17. See Silver Price Cycle and Analysis.
More recently on July 16th, I warned that the next financial crisis (bear market) was scary close, possibly just a couple weeks away. The charts I posted will make you really start to worry. See Scary Bear Market Setup Charts.
In barely a week, President Trump made two great miscalculations. First, he undermined the trade talks in Shanghai. Then US Treasury declared China a currency manipulator.
The two miscalculations will prove costly not just in the US-Sino trade war but for global economic prospects.
Divisions at the White House and the Fed
At the eve of the recent trade talks in Shanghai, President Trump’s tweets undermined the meeting before it even began.
Afterwards in the Oval Office, President Trump overruled his advisers to ramp up tariffs on China. Reportedly, the decision ensued after a heated debate in which he insisted levies would force China to comply with US demands.
Except for Peter Navarro, Trump’s China-bashing trade adviser, Trump’s highest-level team adamantly objected to the tariffs. That spurred an intense debate lasting nearly two hours. Trump desperately needed secured commitments China would boost the purchases of US agricultural exports; and he saw tariffs as the best bullying tactic. Eventually, Trump’s advisers gave in and helped him to draft the tweet announcing an extension of tariffs to essentially all Chinese imports.
Soon thereafter, US Treasury Department declared China a currency manipulator and threatened to “engage with the International Monetary Fund” to stop the Chinese yuan from gaining “unfair advantage” in trade. That designation does not reflect economic realities, but political desperation, however. Neither the IMF (nor US Treasury) has expressed concerns about Chinese currency manipulation for a long while. The Chinese yuan joined the IMF’s international reserve currencies a few years ago; and more recently, China has joined vital global benchmark indices.
Conversely, in the US, the political background forces behind the recent Fed rate cut, which did weaken the US dollar, have given rise to high-level concerns about the Fed’s independence, as evidenced by the recent Wall Street Journal op-ed by former Fed chairs Paul Volcker, Ben Bernanke and Janet Yellen.
Trump’s tariffs undermine cheaper dollar and rising equities
True, the US administration desperately needs a cheaper dollar. Yet, Trump’s tariff wars and geopolitical ploys (e.g., Iran, Venezuela, new cold war against Russia) work against such goals.
Before summer, the White House lifted tariffs to 25% from 10% on $200 billion of Chinese goods, while targeting another $300 billion worth of Chinese imports for potential punitive tariffs. Unsurprisingly, the renminbi depreciated from 6.7 to more than 6.9 against the US dollar, mainly on renewed trade tensions.
China retaliated by imposing duties on $60 billion of US goods, starting June 1. China could have retaliated harder, but opted for a mild response to keep the door open for trade talks.
Until Trump’s tariff escalation, Chinese renminbi was around 6.80 against the US dollar. But that was predicated on the idea that cooler heads would prevail in the White House and a broad-scale trade war was avoidable. When Trump opted for tariff escalation, markets reacted expectedly. By the summer, the appreciation of Chinese yuan was reversed. Things were about to get tougher.
As the collateral damage of the US tariffs began to spread in the US economy in the summer, Trump largely ignored the economic impact of the trade friction. Naively, he thought that the Fed’s rate cut (which he expected to result in new cuts over the fall) would accommodate his trade policy. Emboldened, he opted for the “more tariffs and still more tariffs” stance.
In the past few days, the market response has been dramatic, however. Following Shanghai talks and the new tariff escalation, US stocks plunged on prospects of a prolonged trade fight, and business groups warned about the impact on consumer spending.
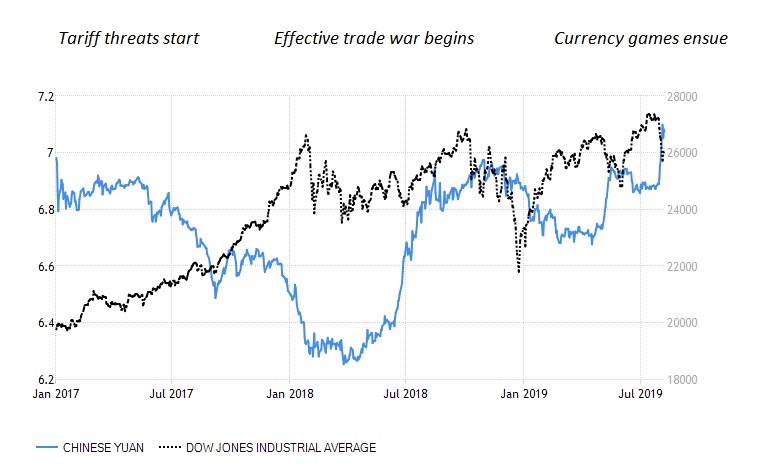
Indeed, Trump’s tariffs have paced the renminbi fluctuations ever since the start of his trade wars (see Figure).
FigureThe interplay of Trump’s tariffs, US equities and Chinese yuan
In light of the economic realities, the US Treasury’s claim that China is depreciating the Chinese yuan is simply flawed. In fact, depreciation is what China seeks to avoid. When exports shrink, a light depreciation of the currency is of no help. And if the yuan would depreciate significantly in a short period of time, it would foster worries about capital flight.
Paradoxically, the more the Trump administration will escalate the trade wars, the more likely it is that US dollar will push the yuan closer to 7 per US dollar or beyond it, as I projected in China Daily last May. While that may impair market sentiment in China in a short-term, it is likely to cause collateral damage in the US stock market, as evidenced by recent market volatility.
The Trump administration’s yuan allegations are motivated by political objectives, not by economic realities. What President Trump needs for his domestic initiatives is a cheaper dollar and soaring equities. What his miscalculations have caused is precisely the reverse.
About the Author:
Dr. Dan Steinbock is the founder of Difference Group. He has served at India, China and America Institute (US), Shanghai Institutes for International Studies (China) and the EU Center (Singapore). For more, see https://www.differencegroup.net/
The US dollar strengthened slightly against a basket of major currencies. Yesterday, the US dollar index (#DX) closed the trading session in the positive zone (+0.09%). So far, there has been no news regarding the trade war between the United States and China. Financial market participants expect additional drivers.
The Chinese yuan has strengthened after the publication of optimistic economic data. So, yesterday, reports on the volume of exports and imports were published in China. Thus, the volume of exports grew by 3.3% in July, while experts forecasted a decrease by 2.0%. The volume of imports fell by only 5.6% in June instead of 8.3%. Today, China’s consumer price index (y/y) has been published during the Asian trading session, which has risen by 2.8% instead of 2.7%. All these data improved investors’ sentiment and made it clear that the market situation was not as bad as it seemed.
Also, during the Asian trading session, positive data on Japan’s GDP have been published. Thus, GDP (y/y) grew by 1.8% in the second quarter instead of 0.4%. GDP (q/q) increased by 0.4% in the second quarter, while experts forecasted growth by 0.2%.
The “black gold” prices have moved away from the lows for seven months after Saudi Arabia said it did not intend to put up with such a reduction in prices. Currently, futures for the WTI crude oil are testing the $52.80 mark per barrel.
Market Indicators
Yesterday, aggressive purchases were observed in the US stock markets: #SPY (+1.96%), #DIA (+1.49%), #QQQ (+2.18%).
The 10-year US government bonds yield won back part of the losses. At the moment, the indicator is at the level of 1.71-1.72%.
The news feed for 2019.08.09:
– UK GDP data at 11:30 (GMT+3:00); – UK manufacturing production at 11:30 (GMT+3:00); – US producer price index at 15:30 (GMT+3:00); – Report on the labor market in Canada at 15:30 (GMT+3:00).
AUDUSD is trading at 0.6774; the instrument is moving below Ichimoku Cloud, thus indicating a descending tendency. The markets could indicate that the price may test the cloud’s upside border at 0.6820 and then resume moving downwards to reach 0.6555. Another signal to confirm further descending movement is the price’s rebounding from the resistance level. However, the scenario that implies further decline may be canceled if the price breaks the cloud’s upside border and fixes above 0.6845. In this case, the pair may continue growing towards 0.6965.
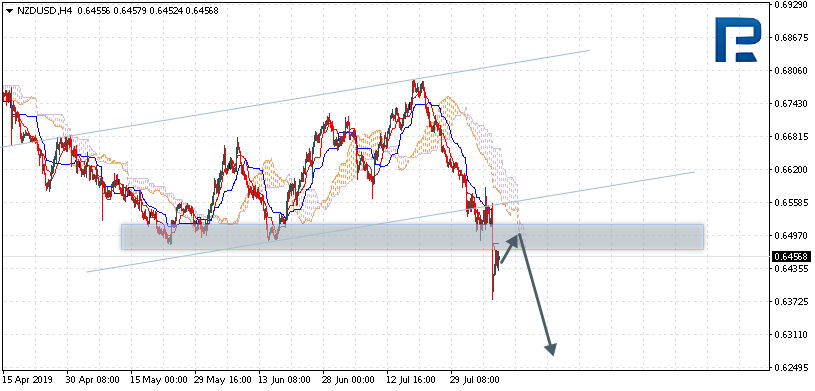
NZDUSD, “New Zealand Dollar vs US Dollar”
NZDUSD is trading at 0.6456; the instrument is moving below Ichimoku Cloud, thus indicating a descending tendency. The markets could indicate that the price may test the cloud’s downside border at 0.6495 and then resume moving downwards to reach 0.6275. Another signal to confirm further descending movement is the price’s rebounding from the resistance level. However, the scenario that implies further decline may be canceled if the price breaks the cloud’s upside border and fixes above 0.6605. In this case, the pair may continue growing towards 0.6695.
USDCAD, “US Dollar vs Canadian Dollar”
USDCAD is trading at 1.3279; the instrument is moving above Ichimoku Cloud, thus indicating an ascending tendency. The markets could indicate that the price may test Tenkan-Sen and Kijun-Sen at 1.3250 and then resume moving upwards to reach 1.3425. Another signal to confirm further ascending movement is the price’s rebounding from the rising channel’s downside border. However, the scenario that implies further growth may be canceled if the price breaks the cloud’s downside border and fixes below 1.3155. In this case, the pair may continue falling towards 1.3065.
Attention! Forecasts presented in this section only reflect the author’s private opinion and should not be considered as guidance for trading. RoboForex LP bears no responsibility for trading results based on trading recommendations described in these analytical reviews.
Limassol, Cyprus, Aug. 8, 2019 — As a part of strategic development plans and international expansion, Robomarkets / RoboForex group is pleased to announce receipt of the license that allows providing services on Forex and CFD markets from Malaysia. RoboMarkets Asia Ltd has received the Malaysian license from the Labuan FSA and opened a regional headquarters in Labuan.
RoboMarkets Asia Ltd has received the license No. MB/19/0034 from the Labuan (Malaysia) financial regulator. The Company’s headquarters is located in the very heart of the Financial Park complex in Labuan. In addition to that, a marketing office, which is located in Shah Alam, has been already opened to clients.
RoboMarkets is constantly working on the improvement of trading conditions and committed to perfecting the quality of services provided to clients. The Company is very proud of a new milestone in its development and emphasizes the brand’s commitment to operating in accordance with the highest standards of the industry.
Rostyslav Prus, CEO at RoboMarkets Asia Ltd: “Malaysia is one of the most dynamically developing countries in South-East Asia with a population of many millions. It’s a country that offers a lot of advantages for brokerage activities and it is backed by sound economic fundamentals with promising prospects. The goal of RoboMarkets Asia is to provide quality financial services for Asian traders to enter the global FX and CFD markets and do our best to deliver excellent trading experience to our clients”.
RoboMarkets / RoboForex group is an alliance, which includes:
RoboForex Ltd, an international broker regulated by the IFSC, license No. IFSC/60/271/TS.
RoboMarkets Ltd, a European broker, with CySEC license No. 191/13.
“RoboMarkets” LLC with license No. 15 of the National Bank of the Republic of Belarus.
RoboMarkets Asia Ltd with license No. MB/19/0034 issued by the Labuan FSA.
As we can see in the H4 chart, USDCHF is moving inside the “oversold area”. In this case, the pair may break 0/8 and continue growing towards the resistance at 3/8. However, as long as the price is trading below 0/8, the descending tendency may continue to reach the support at -2/8.
In the M15 chart, the pair may break the upside line of the VoltyChannel indicator and, as a result, continue moving upwards to reach 3/8 from the H4 chart.
XAUUSD, “Gold vs US Dollar”
As we can see in the H4 chart, XAUUSD is trading close to the “overbought area”. In this case, the price may rebound from 8/8 and then resume falling to reach the support at 7/8.
In the M15 chart, the pair may the downside line of the VoltyChannel indicator and, as a result, continue moving downwards.
Attention! Forecasts presented in this section only reflect the author’s private opinion and should not be considered as guidance for trading. RoboForex LP bears no responsibility for trading results based on trading recommendations described in these analytical reviews.
An ambiguous technical picture has developed on the EUR/USD currency pair. A trading instrument is consolidating. EUR/USD quotes continue to test local support and resistance levels at 1.11850 and 1.12150. Participants in the financial markets expect additional drivers. We do not rule out further recovery of the single currency. We recommend keeping track of up-to-date information regarding the trade conflict between the USA and China. Positions must be opened from key levels.
Today, the news background is pretty calm. At 15:30 (GMT+3:00), the US will publish a report on the number of initial jobless claims.
Indicators do not provide precise signals, the price has crossed 50 MA.
The MACD histogram is close to 0.
The Stochastic Oscillator is in the neutral zone, the %K line is above the %D line which points to a bullish sentiment.
Trading recommendations
Support levels: 1.11850, 1.11600, 1.11150
Resistance levels: 1.12150, 1.12450, 1.12800
If the price fixes above 1.12150, expect further growth toward 1.12450-1.12600.
Alternatively, the quotes can decrease toward 1.11600-1.11400.
The GBP/USD currency pair
Technical indicators of the currency pair:
Prev Open: 1.21368
Open: 1.21678
% chg. over the last day: +0.23
Day’s range: 1.21451 – 1.21908
52 wk range: 1.2080 – 1.3385
The GBP is still in a lateral movement. There is no defined trend. At the moment, the local support and resistance levels are 1.21300 and 1.21850. Uncertainty around Brexit continues to put pressure on the British currency. Earlier, the government of Boris Johnson reported that Britain did not intend to resume negotiations with the EU on Brexit. We recommend tracking information on this issue. Positions must be opened from key levels.
The Economic News Feed for 08.08.2019 is calm.
The indicators do not provide precise signals, the price crossed 50 MA and 100 MA.
The MACD histogram is close to 0.
The Stochastic Oscillator is in the neutral zone, the %K line crossed the %D line. There are no signals at the moment.
Trading recommendations
Support levels: 1.21300, 1.20850, 1.20500
Resistance levels: 1.21850, 1.22500, 1.23000
If the price consolidates above 1.21850, expect further recovery toward 1.22300-1.22500.
Alternatively, the price could reduce toward 1.20850-1.20700.
The USD/CAD currency pair
Technical indicators of the currency pair:
Prev Open: 1.32756
Open: 1.33038
% chg. over the last day: +0.26
Day’s range: 1.32720 – 1.33140
52 wk range: 1.2727 – 1.3664
The USD/CAD currency pair stabilized after a rather protracted rally. CAD is currently consolidating. The local support and resistance levels are: 1.32650 and 1.33100, respectively. Support for the Canadian dollar is provided by positive data on business activity from Ivey. We recommend paying attention to the dynamics of oil quotes. Positions must be opened from key levels.
The news background on the Canadian economy is pretty calm today.
Indicators do not give accurate signals: the price is consolidating near 50 MA.
The MACD histogram is located near the 0 mark.
The Stochastic Oscillator is near the oversold zone, the %K line crossed the %D line. There are no signals at the moment.
Trading recommendations
Support levels: 1.32650, 1.32400, 1.3200
Resistance levels: 1.33100, 1.33400
If the price consolidates above 1.33100, expect further growth toward 1.33400-1.33600.
Alternatively, the quotes can drop toward 1.32400-1.32100.
The USD/JPY currency pair
Technical indicators of the currency pair:
Prev Open: 106.460
Open: 106.260
% chg. over the last day: -0.35
Day’s range: 106.005 – 106.299
52 wk range: 104.97 – 114.56
The USD/JPY is still in a sideways movement. There is no defined trend. At the moment, the trading instrument is consolidating near the round level of 106,000. The 106.550 mark is a key resistance. USD/JPY quotes hcan correct further after a significant collapse since the beginning of the current month. We recommend that you pay attention to the dynamics of yield on US government bonds. Positions must be opened from key levels.
Japan has recently published an optimistic report on the payment balance.
Indicators do not give accurate signals, the price crossed 50 Ma and 100 MA.
The MACD histogram is close to 0.
The Stochastic Oscillator is in the neutral zone, the %K line is below the %D line which points to a bearish sentiment.
Trading recommendations
Support levels: 106.000, 105.550
Resistance levels: 106.550, 107.100, 107.500
If the price consolidates above 106.550, expect a correctiont toward 107.000.
Alternatively, the price could decrease toward 105.600-105.400.
The US dollar is consolidating near local lows against a basket of major currencies. Yesterday, the US dollar index (#DX) closed the trading session with a slight decrease (-0.07%). The trade conflict between Washington and Beijing, as well as the uncertainty concerning Brexit, is still in the spotlight. New Zealand and Australian dollars have been recovering after a sharp collapse the day before. It should be recalled that the RBNZ unexpectedly lowered its key interest rate to a record low of 1.00%.
US President Donald Trump supports the decision of the US Treasury to designate China as a currency manipulator. Trump emphasized: “Companies are moving out of China by the thousands, and our country is doing very well. We’re going to see how it all works out. Somebody had to do this with China because they were taking hundreds of billions of dollars a year out of the United States and somebody had to make a stand. So I think our country is doing really well. ” Trump also criticized the Fed again. The US President believes that the Federal Reserve is the problem of the American economy but not China.
The “black gold” prices have been recovering after a significant drop since the beginning of this month. Currently, futures for the WTI crude oil are testing the $52.50 mark per barrel.
Market Indicators
Yesterday, there was a variety of trends in the US stock markets: #SPY (+0.06%), #DIA (-0.02%), #QQQ (+0.54%).
The 10-year US government bonds yield won back part of the losses. At the moment, the indicator is at the level of 1.72-1.72%.
Today, the news feed is calm enough. At 15:30 (GMT+3:00), data on the initial jobless claims will be published in the US.
On Wednesday the 7th of August, trading on the euro closed slightly up. The EURUSD pair rose to 1.1242 on the back of increased demand for safe haven assets. The euro was also pushed upwards by the US dollar index’s decline, which dropped in response to comments made by US President Donald Trump. He called on the US Federal Reserve to lower interest rates as soon as possible to allow the US to be competitive with other countries. By the time trading closed, the euro had dropped to 1.1197. Trader attention has been fixed on the US-China trade conflict, so there’s nothing more to say about yesterday’s movements.
Day’s news (GMT+3):
11:00 Eurozone: ECB economic bulletin.
15:30 Canada: new housing price index (Jun).
15:30 US: initial jobless claims (2 Aug).
Current situation:
Yesterday’s predictions were completely accurate, with the pair creating a false breakout of the trend line followed by a recovery to 1.1212.
At the time of writing, the euro is trading at 1.1206. The wedge formation made it difficult to draw a channel, but I eventually settled with the B-B channel. I expect the euro to drop to the 67th degree at 1.1162. I was very tempted to predict a bounce from 1.1195 with a target of 1.1236, but my mind was changed by the fact that despite an increase in tensions between the US and China, Chinese authorities have confirmed that they are still planning to send a delegation to the US in September to continue trade talks.
An additional factor for consideration is that the 1.1167 and 1.1179 lows are very close to one another. I’m sure that there are some stop levels on long positions a bit further down. The bears may clear them before the pair starts rising again. If safe haven assets start to rise, my prediction will probably fail. I’m waiting for a sharp upwards rebound from the 67th degree.
 Current situation: