As we can see in the daily chart, the descending tendency has almost reached the post-correctional extension area between 138.2% and 161.8% fibo at 1.2019 and 1.1788 respectively. At the same time, there is a convergence on MACD, which indicates further growth. The resistance is at 1.2395.
The short-term scenario is shown on the H1 chart. Here, there is a convergence, which may indicate a new correction soon. The possible correctional targets may be 23.6%, 38.2%, and 50.0% fibo at 1.2143, 1.2222, and 1.2286 respectively.
EURJPY, “Euro vs. Japanese Yen”
As we can see in the daily chart, after testing the low again, the price has rebounded from it. At the same time, there is a convergence on MACD, which may indicate a possible reverse and a pullback. After breaking the low, the descending tendency may continue towards the post-correctional extension area between 138.2% and 161.8% fibo at 114.34 and 112.09 respectively.
In the H4 chart, the pair has already been corrected to the upside by 23.6%. Judging by the convergence on MACD, the correction may yet continue to reach 38.2%, 50.0%, and 61.8% fibo at 119.74, 120.43, and 121.11 respectively. The support is the low at 117.51.
Attention! Forecasts presented in this section only reflect the author’s private opinion and should not be considered as guidance for trading. RoboForex LP bears no responsibility for trading results based on trading recommendations described in these analytical reviews.
The EUR/USD currency pair is still in a sideways trend. A unidirectional trend is not observed. Currently, the EUR/USD quotes are consolidating. The local support and resistance levels are 1.11600 and 1.11900, respectively. The demand for greenback has risen after positive inflation data in the US. Washington plans to postpone the introduction of 10% tariffs on a number of Chinese imports until December 15. We recommend opening positions from the key levels.
The News Feed on 14.08.2019:
According to preliminary data, Germany’s GDP slowed down by 0.1% (q/q) in the second quarter, which met the market expectations.
Today, investors will also assess the following statistics:
– Preliminary data on Eurozone GDP at 12:00 (GMT+3:00);
– Export and import price indices in the US at 15:30 (GMT+3:00).
Indicators point to the power of sellers: the price has fixed below 50 MA and 100 MA.
The MACD histogram is in the negative zone, which indicates the bearish sentiment.
Stochastic Oscillator is near the oversold zone, the %K line has crossed the %D line. There are no signals at the moment.
Trading recommendations
Support levels: 1.11600, 1.11150
Resistance levels: 1.11900, 1.12200, 1.12450
If the price fixes below 1.11600, the EUR/USD quotes are expected to fall. The movement is tending to 1.11300-1.11000.
An alternative could be the growth of the EUR/USD currency pair to 1.12200-1.12500.
The GBP/USD currency pair
Technical indicators of the currency pair:
Prev Open: 1.20718
Open: 1.20591
% chg. over the last day: -0.09
Day’s range: 1.20447 – 1.20663
52 wk range: 1.2015 – 1.3385
There is an ambiguous technical pattern on the EUR/USD currency pair. The trading instrument is consolidating at the moment. The local support and resistance levels are 1.20450 and 1.20750, respectively. Yesterday, positive data on the UK labor market were published. The British pound is tending to recover after a continuous fall. We recommend monitoring the current information on the Brexit issue. Positions should be opened from the key levels.
At 11:30 (GMT+3:00), a report on inflation will be published in the UK.
Indicators do not give accurate signals: the price has crossed 50 MA.
The MACD histogram is in the negative zone, indicating the bearish sentiment.
Stochastic Oscillator is in the neutral zone, the %K line is above the %D line, which indicates the growth of GBP/USD quotes.
Trading recommendations
Support levels: 1.20450, 1.20150, 1.20000
Resistance levels: 1.20750, 1.21050, 1.21400
If the price fixes above 1.20750, the GBP/USD quotes are expected to correct. The movement is tending to 1.21000-1.21300.
An alternative could be a decrease in the GBP/USD currency pair to 1.20150-1.20000.
The USD/CAD currency pair
Technical indicators of the currency pair:
Prev Open: 1.32322
Open: 1.32228
% chg. over the last day: -0.08
Day’s range: 1.32106 – 1.32306
52 wk range: 1.2727 – 1.3664
The technical pattern is still ambiguous on the USD/CAD currency pair. The loonie is currently consolidating. The local support and resistance levels are 1.32150 and 1.32500, respectively. The positive dynamics of oil quotes support the Canadian dollar. A trading instrument is tending to decline. We recommend opening positions from the key levels.
The news feed on Canada’s economy is calm.
Indicators do not give accurate signals: 50 MA has crossed 100 MA.
The MACD histogram is in the negative zone, but above the signal line, which gives a weak signal to sell USD/CAD.
Stochastic Oscillator is in the neutral zone, the %K line has crossed the %D line. There are no signals at the moment.
Trading recommendations
Support levels: 1.32150, 1.31850, 1.31250
Resistance levels: 1.32500, 1.32750, 1.33100
If the price fixes above 1.32500, the USD/CAD currency pair is expected to grow. The movement is tending to 1.32850-1.33000.
An alternative could be a fall in the USD/CAD quotes to 1.31850-1.31600.
The USD/JPY currency pair
Technical indicators of the currency pair:
Prev Open: 105.266
Open: 106.732
% chg. over the last day: +1.23
Day’s range: 106.273 – 106.767
52 wk range: 104.97 – 114.56
Yesterday, the USD/JPY currency pair kept the support level of 105.100, which caused aggressive purchases. The trading instrument has reached new local highs. The demand for greenback has risen significantly after optimistic inflation data in the US. At the moment, the USD/JPY quotes are consolidating in the range of 106.250-106.750. The USD/JPY currency pair has the potential for further correction after a continuous fall. We recommend paying attention to the dynamics of the US government bonds yield. Positions should be opened from the key levels.
The publication of important economic releases from Japan is not planned.
The price has fixed above 100 MA, which signals the power of buyers.
The MACD histogram is in the positive zone, but below the signal line, which gives a weak signal to buy USD/JPY.
Stochastic Oscillator is in the neutral zone, the %K line is above the %D line, which indicates the bullish sentiment.
Trading recommendations
Support levels: 106.250, 105.650, 105.100
Resistance levels: 106.750, 107.300
If the price fixes above 106.750, further correction of the USD/JPY currency pair is expected. The movement is tending to 107.300-107.500.
An alternative could be a fall in the USD/JPY quotes to 105.800-105.600.
This section of our multi-part article regarding current and past central bank actions, we are going to attempt to look at key elements of the past and present to highlight what we believe may turn out to be an incredible “setup” in the global markets.
This setup is almost like a complex chess game where two skilled players battle for control and near the end of the game, one player is left with the King, a Rook, and a Pawn while the other player has a dramatic advantage with stronger chess pieces. Yet, as the game continues, the weaker player is able to remove one or two of the stronger players key pieces and move his pawn to his opponent’s side to recover his Queen – thus altering the dynamic of the game and eventually winning.
This actually happened to me once playing against a friend of mine. My friend was so wrapped up in trying to move my King into checkmate, he left his other pieces open for me to target and remove – while leaving my Pawn untouched. After I had gained a clear advantage by removing his stronger pieces, I cornered his king within an area that allowed me to move my Pawn to his side of the board whereas I regained my Queen. At that point, the game was nearly over for him – and he knew it.
Did the US Fed and global central banks set up a similar type of process in the global economy? We can rephrase this question as did the global central banks inadvertently set up a massive credit/debt problem by attempting to pour capital into the global markets to spark an economic recovery? And did the acquisition of all of this debt/credit setup a “chase after the King” moment where foreign nations failed to understand the underlying risks associated with this move? Have the dynamics of the global markets shifted away from the advantages that were present three to four+ years ago?
So, let’s investigate the data to see what we can find out about what is changing in the markets.
One change that is critical to the understanding of consumer sentiment is the savings rates for consumers. Since the 2008-09 credit market crisis, Americans have started saving more of their income even though rates for savings have dramatically fallen. This is a shift in consumer sentiment that suggests consumers are attempting to put more cash into savings in preparation for some future event.
The Fed expects economic growth rates in the US to run at far lower levels than in 2011 and 2012. With all the capital that has been poured into the global markets, one would think growth rates would be moderately higher or climbing. But we believe the global economy is stuck in a mode where capital is unable to be effectively deployed throughout the globe because of inherent economic failures and processes that prevent future growth. We’ve discussed this in the previous article about how the US and global economies are stuck in a mostly 19th-century mode of operation while attempting to transition into a 21st-century mode of operation. This transition may take another 10 to 20+ year, but it will eventually happen.
Until that transition is completed, expect further bumps in the road as traditional expectations for investment and returns are shattered – forcing a move towards a 21st-century economic revival.
The price of commodities is a perfect example of how the 19th-century economy is purging itself while the new 21st-century economy is searching for a foundation/footing to take root. Oil is a prime example of the 19th-century economic foundation for growth and economic output. Yet in today’s world of solar, green and various other energy sources, Oil has fallen to near $52 ppb recently and could fall as low as $35 to $38 ppb in the future months. Considering Oil was recently above $120 bbp – what the heck happened?
This chart of the Index of All Commodities prices highlights the shift in capital and the shift in the economic mode of operation that is currently taking place. What was an increasing commodities price market in 2005~07 and 2010~12 has now been replaced with a decreasing commodity pricing market. Is this indicative of a collapse in the global economy? In some ways, yes. But we believe this is more indicative of a transitional economic shift away from 19th-century processes and functions and towards a more dynamic 21st century economic model for the globe.
This process, though, will be full of very large price swings, failures, successes, and opportunities for those skilled technical traders that are able to catch the moves and setup as they happen.
Lastly, the US Consumer Price Index chart. Notice how the GREEN highlighted area (from the early 1960s till 2000 were filled with positive CPI results? Notice how that changed in 2000 and how after 2000 the CPI levels fluctuated from positive to negative quite regularly? Now, pay attention to how the expansion of peaks immediately after the 2000 Dot Com bubble burst has been replaced with a contraction of peaks after the 2008-09 credit market crisis. What is causing the CPI to contract in this manner? Why is is that expansion of commodity pricing is unable to expand as it had been going for decades before 2008-09?
The key to understanding all of this is that the expansion prior to 2000 was an expansion fueled by rising wages, income, wealth creation and opportunity from a mature 19th-century economic model. The 1990 to 2000 narrow range in the CPI was related to the “early shift” away from the 19th-century economic mode and into the Dot Com (internet) mode of economic activity (where this new economic model was taking away from brick-and-mortar shopping malls and replacing it with virtual commerce activities. The recovery in 2005 was fueled by moderate quantitative easing in the US as well as a resurgence in more traditional economic functions related to the growth of economic opportunity in foreign nations, Europe and the push to expand digital technology throughout most of the developing world.
Then came the crisis of 2008-09, which was like blowing out 3 pistons of your V8 motor. You may still be able to limp the car around and back home, but you probably have to keep pouring high-octane fuel into it to keep it running and hope it does not blow out another piston or two.
This Custom Smart Cash Index chart is a perfect example of how capital works in the markets. It attempts to avoid risk by reducing exposure to risk events and attempts to pile into an opportunity as security and returns are setup for optimum outcomes.
Notice how in 2008 capital fled the global markets and how it slowly reentered the markets from 2011 to 2015. Pay attention to the dips in this Smart Cash Index and you’ll notice how these dips align with the US Fed and global central bank QE functions. Pay very close attention to the dip in 2015~2016. Why would cash want to avoid risks setting up during this time and what caused the global markets to fear excessive risks then? US Presidential elections – that’s what happened. And what is happening in November 2020? Yup – you guessed it.
Why would risks become so heightened at these times and throughout collapse events and where does capital rush into when these types of events happen?
CONCLUDING THOUGHTS:
In Part IV of this article, we’ll try to answer some of your bigger questions and we’ll explain why we believe an incredible opportunity is setting up for skilled technical traders over the next 24+ months.
Using technical analysis and proven strategies we can follow the market trends and profit from them no matter which the market moves. We bet with the market (the house) and provide entry, target, and stops for all trades we initiate.
NEXT MOVES FOR GOLD, SILVER, MINERS, AND S&P 500
In early June I posted a detailed video explaining in showing the bottoming formation and gold and where to spot the breakout level, I also talked about crude oil reaching it upside target after a double bottom, and I called short term top in the SP 500 index. This was one of my premarket videos for members it gives you a good taste of what you can expect each and every morning before the Opening Bell. Watch Video Here.
I then posted a detailed report talking about where the next bull and bear markets are and how to identify them. This report focused mainly on the SP 500 index and the gold miners index. My charts compared the 2008 market top and bear market along with the 2019 market prices today. See Comparison Charts Here.
On June 26th I posted that silver was likely to pause for a week or two before it took another run up on June 26. This played out perfectly as well and silver is now head up to our first key price target of $17. See Silver Price Cycle and Analysis.
More recently on July 16th, I warned that the next financial crisis (bear market) was scary close, possibly just a couple weeks away. The charts I posted will make you really start to worry. See Scary Bear Market Setup Charts.
The US dollar strengthened against a basket of major currencies. Yesterday, it became known that the US Trade Representative, Robert Lighthizer, and Secretary of the Treasury, Steven Mnuchin, had a phone call with Chinese Vice Premier, Liu He. The officials also agreed to phone again in two weeks. The United States is going to postpone the introduction of tariffs on a number of Chinese goods until December 15. The US President, Donald Trump, likely made this decision not because of success in US-China trade negotiations, but due to pressure from the US companies. The US dollar index (#DX) closed the trading session in the positive zone (+0.45%).
Optimistic economic data supported the US currency. So, yesterday, the core consumer price index was published, which increased by 0.3% in July, while experts expected growth by only 0.2%. Investors are currently expecting additional drivers.
In addition, ambiguous economic data on the UK economy were published yesterday. Thus, the average earnings index + bonus grew by 3.7% in June, as experts expected. Initial jobless claims counted only to 28.0K in July instead of 32.0K. However, the unemployment rate rose to 3.9% in June, while experts forecasted the rate at 3.8%.
The “black gold” prices are falling after a significant increase the day before. Futures for the WTI crude oil are currently testing the $56.35 mark per barrel. At 17:30 (GMT+3:00), US crude oil inventories will be published.
Market Indicators
Yesterday, the bullish sentiment was observed in the US stock markets: #SPY (+1.56%), #DIA (+1.45%), #QQQ (+2.19%).
The 10-year US government bonds yield is at 1.64-1.65%.
The news feed for 2019.08.14:
– Consumer price index in the UK at 11:30 (GMT+3:00); – Preliminary data on Eurozone GDP at 12:00 (GMT+3:00); – Export and import price indices in the US at 15:30 (GMT+3:00).
On Tuesday the 13th of August, trading on the EURUSD pair closed down. Volatility was high during the European and US sessions. Trading in the US saw the euro drop to 1.1170. This came after reports that Washington is planning to delay the introduction of new tariffs on Chinese goods (specifically mobile phones and computers) until the 15th of December. The announcement came from US Trade Representative Robert Lighthizer.
The dollar also made gains following the publication of a strong consumer inflation report, which exceeded market expectations. The pickup in inflation could provide justification for the Federal Reserve to maintain interest rates at their current level through the end of the year. US CPI in July rose by 0.3% on June’s value, and by 1.8% in annual terms. This was against a MoM forecast of 0.3% and 1.7% YoY.
Day’s news (GMT+3):
11:30 UK: CPI (Jul), retail price index (Jul), PPI (Jul).
12:00 Eurozone: GDP (Q2), employment change (Q2), industrial production (Jun).
17:30 US: EIA crude oil stocks change (9 Aug).
Current situation:
The pair recovered to the upper boundary of the channel as expected. The sharp reversal came as a surprise, but it’s likely that no one was prepared for such news on tariffs from the US. Today, we expect the euro to rise to 1.1211. If the recovery has legs, it should continue to 1.1220.
Why growth, and not decline?
The yuan slipped after weak Chinese data (retail sales and industrial production).
Tension remains over the situation in Hong Kong.
The stochastic is in the buy zone.
The EURUSD pair is still trading within the channel.
We could see a fresh low before the pair starts rising if German and Eurozone GDP data disappoint. We’re also expecting Eurozone data on industrial production and employment. UK CPI will come out a bit earlier. So, today, we’re expecting to see the pair move against the decline saw in yesterday’s US session. This scenario will not play out if the hourly candlestick closes below 1.1155.
Today, our focus will be on the UK inflation rate and the GBP/USD. After the currency pair closed last week at its lowest levels since the 1980’s, chances are good that the currency pair will sustainably drop below 1.2000.
This is especially true if inflation comes in below expectations around 1.9%, potentially resulting in rising speculations and expectations of a rate cut from the Bank of England.
Beside rising uncertainty in regards to the Brexit, disappointing economic data is currently weighing on Pound Sterling. Last Friday, GDP data came in weaker than expected, showed that the British economy contracted in Q2/2019. And it does not seem as if we get to see a turnaround here: so far, the course from new UK prime minister Boris Johnson hasn’t changed and chances are elevated that the UK will leave the EU without a deal.
In addition to global trade war fears driven by a further escalation in the trade dispute between the US and China, and more and more central banks around the globe starting new easing cycles in anticipation of a global economic downturn, it only seems a matter of time when the BoE will join with a rate cut itself, especially after the BoE already cut the forecast for 2019 to 1.3% from 1.5%, and its forecast for 2020 to 1.3% from 1.6% with a note that it will likely be lower in case of a no-deal Brexit.
That said, a reading below expectations will likely push GBP down on a broad front, and thus the GBP/USD below 1.2000.
On the other hand: a surprise, higher-than-expected reading could at least result in a short-term bounce higher and towards 1.2350/2400 since the latest CoT data last Friday showed the highest net-short position in Pound Sterling Futures since the beginning of 2017, this the Pound Short trade being a little crowded and vulnerable to a squeeze due to surprising data releases:
Source: Admiral Markets MT5 with MT5-SE Add-on GBP/USD Daily chart (between May 14, 2018, to August 13, 2019). Accessed: August 13, 2019, at 10:00pm GMT – Please note: Past performance is not a reliable indicator of future results, or future performance.
In 2014, the value of the GBP/USD fell by 5.9%, in 2015, it fell by 5.4%, in 2016, it fell by 16.3%, in 2017, it increased by 7.4%, in 2018, it fell by 5.6%, meaning that after five years, it was down by 22.9%.
Discover the world’s #1 multi-asset platform
Admiral Markets offers professional traders the ability to trade with a custom, upgraded version of MetaTrader 5, allowing you to experience trading at a significantly higher, more rewarding level. Experience benefits such as the addition of the Market Heat Map, so you can compare various currency pairs to see which ones might be lucrative investments, access real-time trading data, and so much more. Click the banner below to start your FREE download of MT5 Supreme Edition!
Disclaimer: The given data provides additional information regarding all analysis, estimates, prognosis, forecasts or other similar assessments or information (hereinafter “Analysis”) published on the website of Admiral Markets. Before making any investment decisions please pay close attention to the following:
This is a marketing communication. The analysis is published for informative purposes only and are in no way to be construed as investment advice or recommendation. It has not been prepared in accordance with legal requirements designed to promote the independence of investment research, and that it is not subject to any prohibition on dealing ahead of the dissemination of investment research.
Any investment decision is made by each client alone whereas Admiral Markets shall not be responsible for any loss or damage arising from any such decision, whether or not based on the Analysis.
Each of the Analysis is prepared by an independent analyst (Jens Klatt, Professional Trader and Analyst, hereinafter “Author”) based on the Author’s personal estimations.
To ensure that the interests of the clients would be protected and objectivity of the Analysis would not be damaged Admiral Markets has established relevant internal procedures for prevention and management of conflicts of interest.
Whilst every reasonable effort is taken to ensure that all sources of the Analysis are reliable and that all information is presented, as much as possible, in an understandable, timely, precise and complete manner, Admiral Markets does not guarantee the accuracy or completeness of any information contained within the Analysis. The presented figures refer that refer to any past performance is not a reliable indicator of future results.
The contents of the Analysis should not be construed as an express or implied promise, guarantee or implication by Admiral Markets that the client shall profit from the strategies therein or that losses in connection therewith may or shall be limited.
Any kind of previous or modeled performance of financial instruments indicated within the Publication should not be construed as an express or implied promise, guarantee or implication by Admiral Markets for any future performance. The value of the financial instrument may both increase and decrease and the preservation of the asset value is not guaranteed.
The projections included in the Analysis may be subject to additional fees, taxes or other charges, depending on the subject of the Publication. The price list applicable to the services provided by Admiral Markets is publicly available from the website of Admiral Markets.
Leveraged products (including contracts for difference) are speculative in nature and may result in losses or profit. Before you start trading, you should make sure that you understand all the risks.
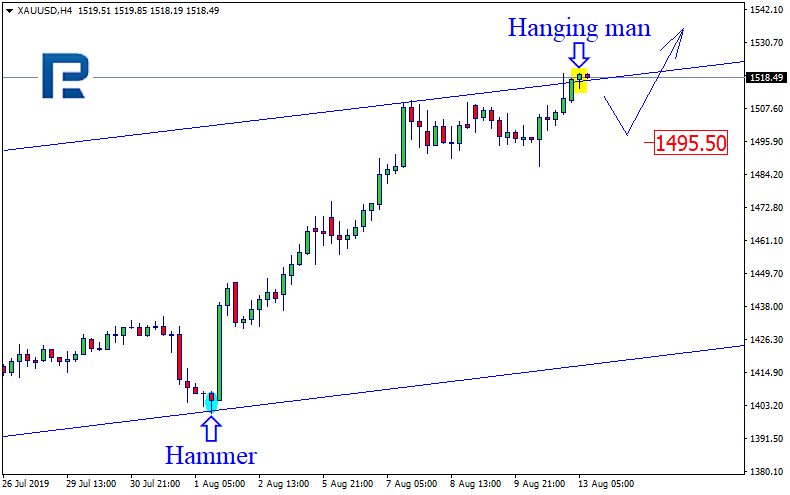
As we can see in the H4 chart, the ascending tendency continues. After forming Hanging Man pattern, XAUUSD is testing the channel’s upside border and may reverse. The target of the pullback is at 1495.50. At the same time, we shouldn’t exclude a possibility that the instrument may break the border and continue moving upwards without a significant correction.
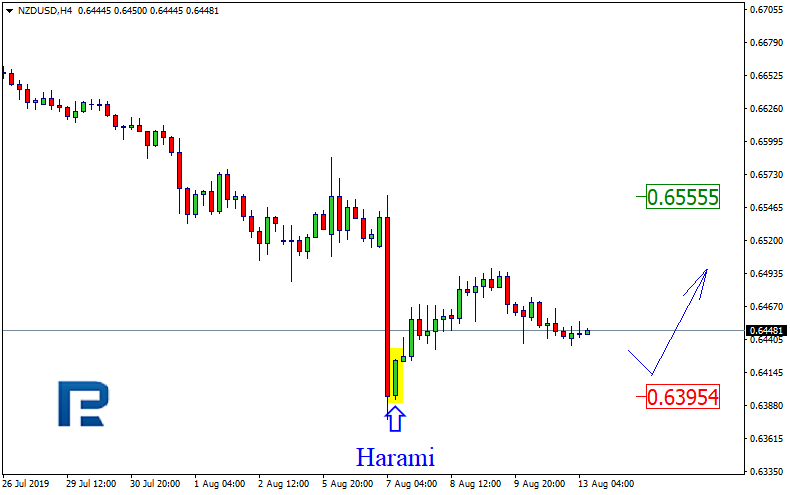
NZDUSD, “New Zealand vs. US Dollar”
As we can see in the H4 chart, NZDUSD is still trading close to the support level, where it has formed Harami pattern. Right now, the pair is rebounding from the support line. In this case, the price may reverse and grow towards the resistance line at 0.6555. At the same time, one shouldn’t exclude an opposite scenario, according to which the instrument may complete the correction, break the support level at 0.6395, and continue falling.
Attention! Forecasts presented in this section only reflect the author’s private opinion and should not be considered as guidance for trading. RoboForex LP bears no responsibility for trading results based on trading recommendations described in these analytical reviews.
Our researchers have created this research post to highlight a big price move based on super-cycle research and patterns that should begin on or near August 19, 2019. Back in April/May 2019, we started warning of a critical top formation we believed was aligned for July 2019. In May/June, we altered this date to align more closely with our super-cycle research and determined the August 19, 2019 date.
It is our belief that this date will initiate a breakdown price move that may align with external news related or economic related data. Our research continues to point to the potential for a large global breakdown in equity prices related to some type of near-crisis event. It could be related to something within the US or outside the US – but either way, we slice it, August 19 looks to be the date we need to focus on.
This FANG custom index weekly chart highlights how our Fibonacci Price Amplitude Arcs work in alignment with price rotation and trends. The theory behind this analysis is that price trends operate at a frequency and amplitude that we can map out – much like Tesla’s theory of Mechanical Resonance.
In our studies, we have learned how to identify relative price amplitude and frequency factors, then align these to price peaks and valleys. The result is that we can see where hidden support and resistance channels form and where the price will potentially reach an “inflection point”.
Right now, this week and next on this FANG chart are likely to see increased volatility and the potential for a price breakdown as the current RED arc level sets up a massive resistance channel.
Custom Smart Cash Index Chart
Our custom Smart Cash Index chart is also highlighting an overall weakness in the US and global markets. Once this chart breaks the lower price channel level, there is a very strong possibility that this index will break down toward the $134 level (or lower) as the global markets attempt to identify price support. Overall lows could target the $111 level (seeing in 2016) if the breakdown is excessive.
Custom Volatility Index
This Custom Volatility Index is suggesting a deeper price low is setting up if the August 19 breakdown date acts as we suspect. If the global markets break lower, then this Custom Volatility Index will be pushed into an extreme low territory (below 5.5) were a very deep bottom/base will setup (as we have seen before). If it reaches levels below 4.0, then we should be very close to a very deep “V” type bottom.
The recovery from this base/bottom will likely be somewhat extended as the shift in the capital around the globe seeks out the best, safest locations and returns. We believe this bottom will complete near the end of 2019 or into early 2020 where the US markets will quickly gain acceptance as the location for global assets to avoid extended risks.
What Does All This Mean?
August 19 is only a few days away and we could see fireworks start in the global financial market place.
If our analysis is correct, we have only 4 to 7+ days before a major breakdown in price starts and we are yet unsure of the source or intensity of this event if there is one. Multiple analysis types are pointing to August as a key turn date and the market could fall by as much as 16-25% if there is a trigger event to spark the crisis.
What should you do? Well, being a pilot, quasi engineer, and technical trader using logic, rules, and processes to do things. I always wait for the price to confirm a new trend before taking action and entering a position. This is how we profited last week from the SP500 index falling. We traded the 2x bear fund SDS and locked in a quick profit.
The days are long gone where I would buy or sell stocks or trends based on tips and forecasts. That type of trading is really called legal gambling and the odds generally are not in your favor unless you tips are coming from insiders who actually know something.
Using technical analysis and proven strategies we can follow the market trends and profit from them no matter which the market moves. We bet with the market (the house) and provide entry, target, and stops for all trades we initiate.
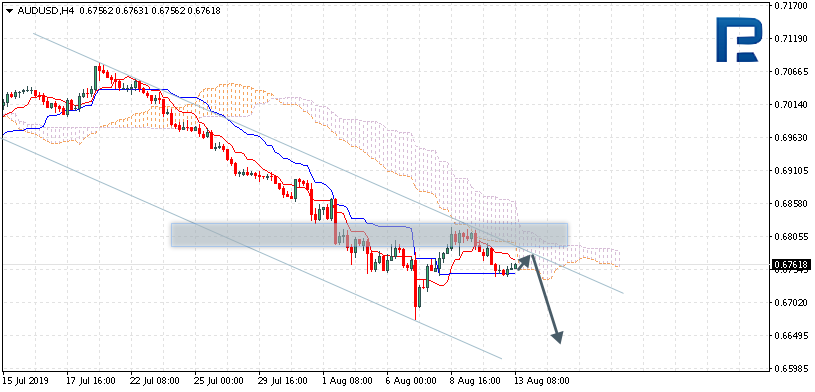
AUDUSD is trading at 0.6761; the instrument is moving below Ichimoku Cloud, thus indicating a descending tendency. The markets could indicate that the price may test the cloud’s downside border at 0.6765 and then resume moving downwards to reach 0.6635. Another signal to confirm further descending movement is the price’s rebounding from the descending channel’s upside border. However, the scenario that implies further decline may be canceled if the price breaks the cloud’s upside border and fixes above 0.6825. In this case, the pair may continue growing towards 0.6905.
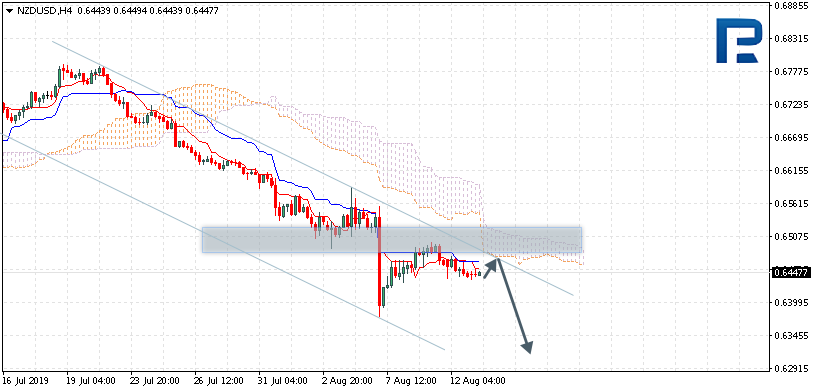
NZDUSD, “New Zealand Dollar vs US Dollar”
NZDUSD is trading at 0.6447; the instrument is moving below Ichimoku Cloud, thus indicating a descending tendency. The markets could indicate that the price may test the cloud’s downside border at 0.6455 and then resume moving downwards to reach 0.6315. Another signal to confirm further descending movement is the price’s rebounding from the resistance level. However, the scenario that implies further decline may be canceled if the price breaks the cloud’s upside border and fixes above 0.6525. In this case, the pair may continue growing towards 0.6645.
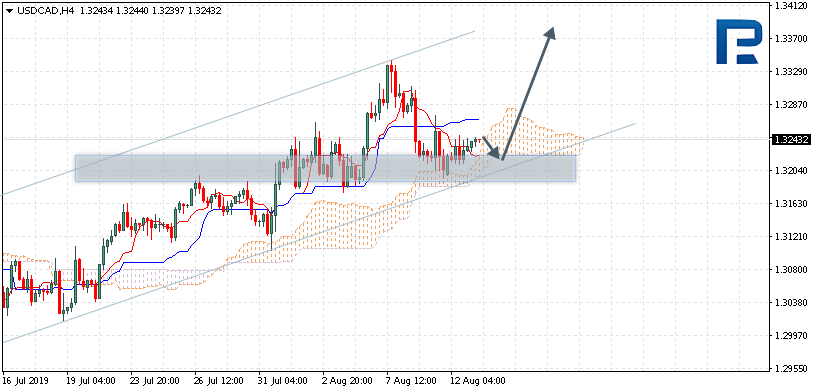
USDCAD, “US Dollar vs Canadian Dollar”
USDCAD is trading at 1.3243; the instrument is moving above Ichimoku Cloud, thus indicating an ascending tendency. The markets could indicate that the price may test the cloud’s downside border at 1.3230 and then resume moving upwards to reach 1.3375. Another signal to confirm further ascending movement is the price’s rebounding from the rising channel’s downside border. However, the scenario that implies further growth may be canceled if the price breaks the cloud’s downside border and fixes below 1.3175. In this case, the pair may continue falling towards 1.3095.
Attention! Forecasts presented in this section only reflect the author’s private opinion and should not be considered as guidance for trading. RoboForex LP bears no responsibility for trading results based on trading recommendations described in these analytical reviews.
The technical pattern on the EUR/USD currency pair is still ambiguous. The trading instrument is in a sideways trend. A unidirectional trend is not observed. Investors expect additional drivers. At the moment, local support and resistance levels are 1.11650 and 1.12150, respectively. We expect the publication of important economic releases. The EUR/USD quotes are tending to recover. We recommend opening positions from the key levels.
The News Feed on 13.08.2019:
– ZEW economic sentiment indices in Germany and the Eurozone at 12:00 (GMT+3:00);
– Inflation report in the US at 15:30 (GMT+3:00).
Indicators do not give accurate signals: 50 MA has crossed 100 MA.
The MACD histogram is near the 0 mark.
Stochastic Oscillator is near the oversold zone, the %K line has crossed the %D line. There are no signals at the moment.
Trading recommendations
Support levels: 1.11650, 1.11150
Resistance levels: 1.12150, 1.12450, 1.12800
If the price fixes above 1.12150, an increase in the EUR/USD quotes is expected. The movement is tending to 1.12450-1.12700.
An alternative could be a decrease in the EUR/USD currency pair to 1.11450-1.11300.
The GBP/USD currency pair
Technical indicators of the currency pair:
Prev Open: 1.20428
Open: 1.20718
% chg. over the last day: +0.49
Day’s range: 1.20558 – 1.20837
52 wk range: 1.2080 – 1.3385
The British pound recovered an insignificant part of losses against the US dollar yesterday. The GBP/USD currency pair has updated local highs. This movement was mostly caused due to technical factors. Currently, the GBP/USD quotes are consolidating in the range of 1.20550-1.20850. We do not exclude further correction of the trading instrument. Investors expect important statistics on the UK economy. Positions should be opened from the key levels.
At 11:30 (GMT+3:00) a report on the labor market will be published in the UK.
Indicators do not give accurate signals: the price is testing 50 MA.
The MACD histogram is near the 0 mark.
Stochastic Oscillator is located near the oversold zone, the %K line has crossed the %D line. There are no signals at the moment.
Trading recommendations
Support levels: 1.20550, 1.20150, 1.20000
Resistance levels: 1.20850, 1.21400
If the price fixes above 1.20850, further correction of the GBP/USD quotes is expected. The movement is tending to 1.21200-1.21400.
An alternative could be a decrease in the GBP/USD currency pair to 1.20350-1.20150.
The USD/CAD currency pair
Technical indicators of the currency pair:
Prev Open: 1.31986
Open: 1.32322
% chg. over the last day: +0.14
Day’s range: 1.32322 – 1.32491
52 wk range: 1.2727 – 1.3664
The USD/CAD currency pair continues to consolidate. A unidirectional trend is not observed. Financial market participants expect additional drivers. Currently, local support and resistance levels are 1.32150 and 1.32500, respectively. Today we recommend paying attention to economic releases from the United States, as well as the dynamics of oil prices. Positions should be opened from the key levels.
The news feed on Canada’s economy is calm.
Indicators do not give accurate signals: the price has fixed between 50 MA and 100 MA.
The MACD histogram has moved to the positive zone, which points to the power of buyers.
Stochastic Oscillator is near the overbought zone, the %K line has crossed the %D line. There are no signals at the moment.
Trading recommendations
Support levels: 1.32150, 1.31850, 1.31250
Resistance levels: 1.32500, 1.32750, 1.33100
If the price fixes above 1.32500, the USD/CAD currency pair is expected to grow. The movement is tending to 1.32800-1.33000.
An alternative could be a drop in the USD/CAD quotes to 1.31850-1.31600.
The USD/JPY currency pair
Technical indicators of the currency pair:
Prev Open: 105.554
Open: 105.266
% chg. over the last day: -0.12
Day’s range: 105.154 – 105.583
52 wk range: 104.97 – 114.56
Sales are still prevailing on the USD/JPY currency pair. Demand for “safe” assets remains at a fairly high level. Support is provided by the growth of geopolitical risks in Italy and Hong Kong, as well as the uncertainty in trade demand between Washington and Beijing. At the moment, the USD/JPY quotes are consolidating in the range of 105.100-105.650. Today we recommend paying attention to economic reports from the US. Positions should be opened from the key levels.
The news feed on Japan’s economy is quite calm.
Indicators do not give accurate signals: the price has crossed 50 MA.
The MACD histogram is near the 0 mark. There are no signals at the moment.
Stochastic Oscillator is in the neutral zone, the %K line is below the %D line, which indicates the bearish sentiment.
Trading recommendations
Support levels: 105.100, 104.800
Resistance levels: 105.650, 106.250, 106.650
If the price fixes below 105.100, a further fall in the USD/JPY currency pair is expected. The movement is tending to 104.800-104.600.
An alternative could be the correction of the USD/JPY quotes to 106.000-106.300.