The economic docket is quite thin today, only the Michigan Consumer Sentiment stands out, with markets expecting a print of 97.2 – the lowest level since April this year.
Still, we want to take a deeper look at the USD/JPY, since we think that the main focus will be on the latest developments in the trade dispute between the US and China.
After 30-year US-T-Note-yields dropped below their 2-year pendant for the first time since 2007 (which can be considered a bearish sign for USD/JPY due to the yield sensitivity of the currency pair), yesterday’s news that the Chinese government announced that the US violated the Xi-Trump agreement with the new 10% tariff, so in response it has to take necessary countermeasures resulting in a new wave of uncertainty and risk-off in global financial markets.
In our opinion, it seems as if China is sensing weakness in Trump’s latest decisions, especially by delaying the announced tariffs from September to December and is now “arming up”, and shifts the pressure back on the US president in regards to a new round of trade negotiations.
In this context it seems likely that the risk-off mode will persist, leaving the USD/JPY vulnerable to another stint as low as 105.00, probably deeper, while only a push back above 109.00 would switch the mode to neutral in the currency pair:
Source: Admiral Markets MT5 with MT5-SE Add-on USD/JPY Daily chart (between May 18, 2018, to August 15, 2019). Accessed: August 15, 2019, at 10:00pm GMT – Please note: Past performance is not a reliable indicator of future results, or future performance.
In 2014, the value of the USD/JPY increased by 13.7%, in 2015, it increased by 0.5%, in 2016, it fell by 2.8%, in 2017, it fell by 3.6%, in 2018, it fell by 2.7%, meaning that after five years, it was up by 4.1%.
Discover the world’s #1 multi-asset platform
Admiral Markets offers professional traders the ability to trade with a custom, upgraded version of MetaTrader 5, allowing you to experience trading at a significantly higher, more rewarding level. Experience benefits such as the addition of the Market Heat Map, so you can compare various currency pairs to see which ones might be lucrative investments, access real-time trading data, and so much more. Click the banner below to start your FREE download of MT5 Supreme Edition!
Disclaimer: The given data provides additional information regarding all analysis, estimates, prognosis, forecasts or other similar assessments or information (hereinafter “Analysis”) published on the website of Admiral Markets. Before making any investment decisions please pay close attention to the following:
This is a marketing communication. The analysis is published for informative purposes only and are in no way to be construed as investment advice or recommendation. It has not been prepared in accordance with legal requirements designed to promote the independence of investment research, and that it is not subject to any prohibition on dealing ahead of the dissemination of investment research.
Any investment decision is made by each client alone whereas Admiral Markets shall not be responsible for any loss or damage arising from any such decision, whether or not based on the Analysis.
Each of the Analysis is prepared by an independent analyst (Jens Klatt, Professional Trader and Analyst, hereinafter “Author”) based on the Author’s personal estimations.
To ensure that the interests of the clients would be protected and objectivity of the Analysis would not be damaged Admiral Markets has established relevant internal procedures for prevention and management of conflicts of interest.
Whilst every reasonable effort is taken to ensure that all sources of the Analysis are reliable and that all information is presented, as much as possible, in an understandable, timely, precise and complete manner, Admiral Markets does not guarantee the accuracy or completeness of any information contained within the Analysis. The presented figures refer that refer to any past performance is not a reliable indicator of future results.
The contents of the Analysis should not be construed as an express or implied promise, guarantee or implication by Admiral Markets that the client shall profit from the strategies therein or that losses in connection therewith may or shall be limited.
Any kind of previous or modeled performance of financial instruments indicated within the Publication should not be construed as an express or implied promise, guarantee or implication by Admiral Markets for any future performance. The value of the financial instrument may both increase and decrease and the preservation of the asset value is not guaranteed.
The projections included in the Analysis may be subject to additional fees, taxes or other charges, depending on the subject of the Publication. The price list applicable to the services provided by Admiral Markets is publicly available from the website of Admiral Markets.
Leveraged products (including contracts for difference) are speculative in nature and may result in losses or profit. Before you start trading, you should make sure that you understand all the risks.
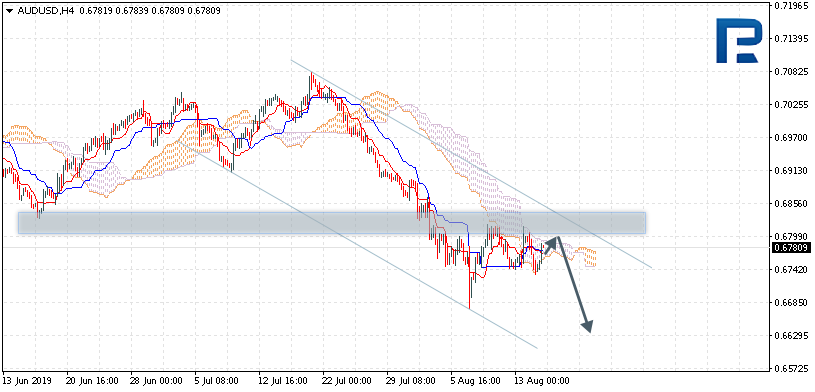
AUDUSD is trading at 0.6780; the instrument is moving inside Ichimoku Cloud, thus indicating a sideways tendency. The markets could indicate that the price may test the cloud’s upside border at 0.6795 and then resume moving downwards to reach 0.6645. Another signal to confirm further descending movement is the price’s rebounding from the resistance level. However, the scenario that implies further decline may be canceled if the price breaks the cloud’s upside border and fixes above 0.6830. In this case, the pair may continue growing towards 0.6905. After breaking the cloud’s downside border and fixing below 0.6720, the price may continue moving downwards.
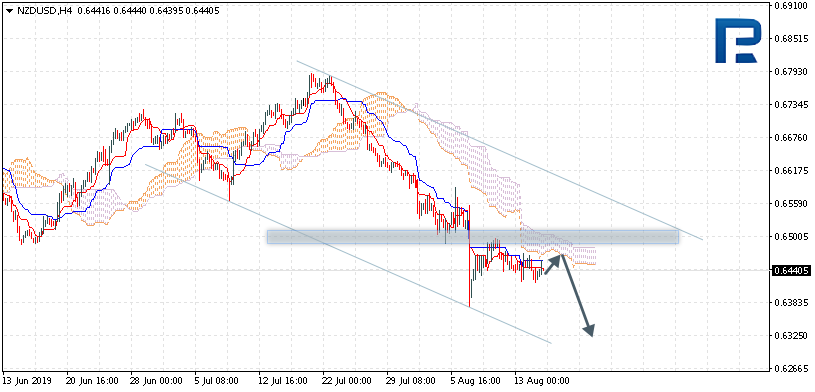
NZDUSD, “New Zealand Dollar vs US Dollar”
NZDUSD is trading at 0.6440; the instrument is moving below Ichimoku Cloud, thus indicating a descending tendency. The markets could indicate that the price may test the cloud’s downside border at 0.6455 and then resume moving downwards to reach 0.6325. Another signal to confirm further descending movement is the price’s rebounding from the resistance level. However, the scenario that implies further decline may be canceled if the price breaks the cloud’s upside border and fixes above 0.6525. In this case, the pair may continue growing towards 0.6645.
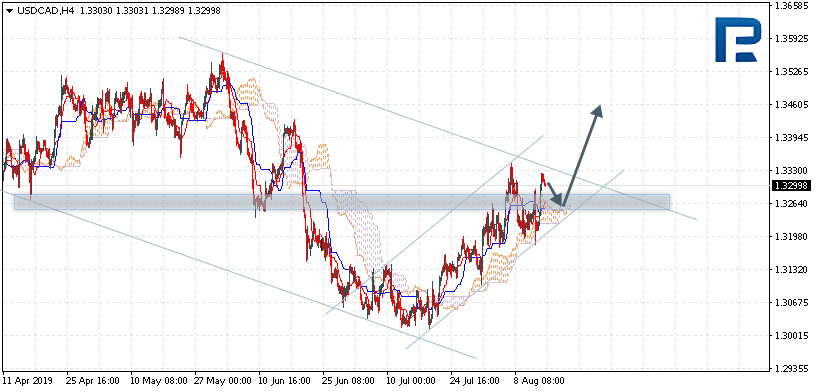
USDCAD, “US Dollar vs Canadian Dollar”
USDCAD is trading at 1.3299; the instrument is moving above Ichimoku Cloud, thus indicating an ascending tendency. The markets could indicate that the price may test the cloud’s upside border at 1.3225 and then resume moving upwards to reach 1.3460. Another signal to confirm further ascending movement is the price’s rebounding from the support level. However, the scenario that implies further growth may be canceled if the price breaks the cloud’s downside border and fixes below 1.3205. In this case, the pair may continue falling towards 1.3125. After breaking the descending channel’s upside border and fixing above 1.3355, the price may continue moving upwards.
Attention! Forecasts presented in this section only reflect the author’s private opinion and should not be considered as guidance for trading. RoboForex LP bears no responsibility for trading results based on trading recommendations described in these analytical reviews.
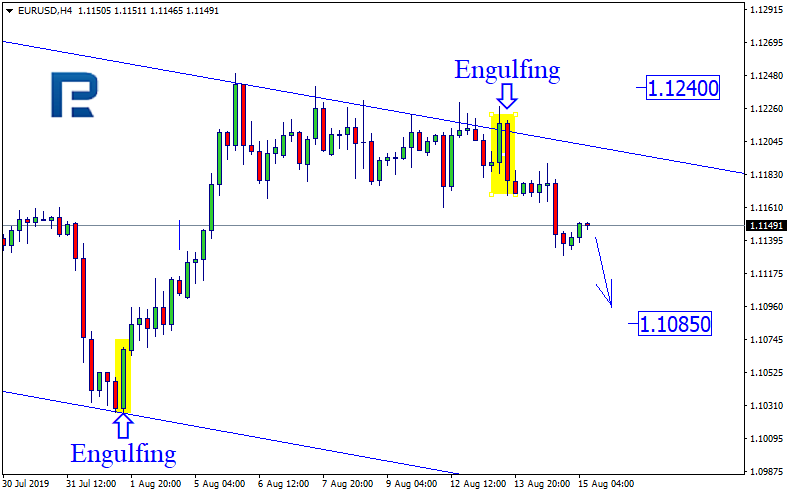
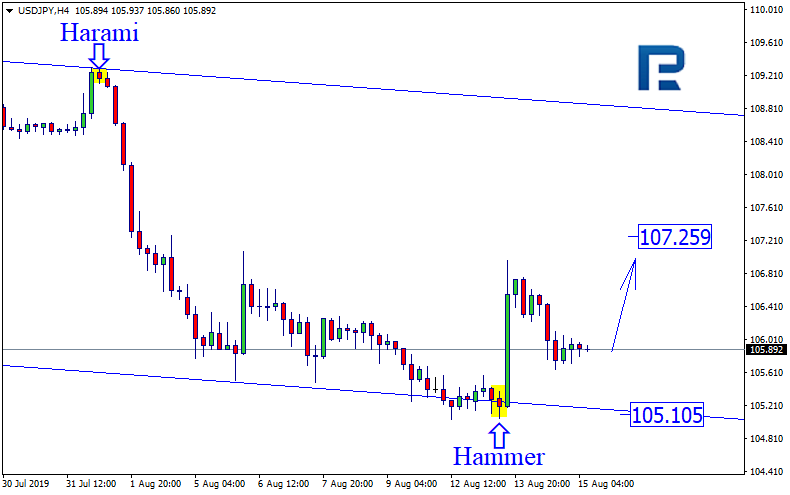
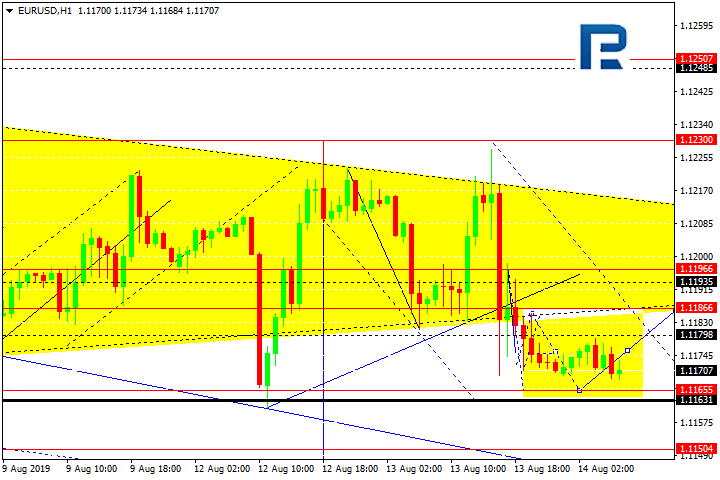
As we can see in the H4 chart, after completing Engulfing pattern, EURUSD has rebounded from the descending channel’s upside border. Right now, the pair is being corrected. After finishing the correction, the price may fall towards 1.1085 to continue forming the descending channel. However, one shouldn’t exclude a possibility that the price may break the resistance level and continue growing towards 1.1240.
USDJPY, “US Dollar vs. Japanese Yen”
As we can see in the H4 chart, after testing the channel’s downside border and forming several reversal patterns, including Hammer, close to the support level, USDJPY has rebounded from it. Right now, it is forming another correction. Judging by the previous movements, it may be assumed that after finishing the pullback, the price may resume trading upwards to reach 107.25. However, we shouldn’t ignore a possibility that the instrument may return to the support line and update the low.
Attention! Forecasts presented in this section only reflect the author’s private opinion and should not be considered as guidance for trading. RoboForex LP bears no responsibility for trading results based on trading recommendations described in these analytical reviews.
The EUR/USD currency pair has been declining after a continuous consolidation. Quotes have updated key lows. Demand for the euro weakened after the release of weak data on German GDP. At the moment, the key support and resistance levels are 1.11300 and 1.11650, respectively. Today, investors will assess important economic releases from the US. We also recommend paying attention to the dynamics of the US government bonds yield curve. Financial market participants are concerned about a possible inversion of the yield curve of two- and ten-year government bonds, which signals an oncoming recession. Positions should be opened from the key levels.
The News Feed on 15.08.2019:
– Report on retail sales in the US at 15:30 (GMT+3:00);
– Philadelphia Fed manufacturing index at 15:30 (GMT+3:00).
Indicators point to the power of sellers: the price has fixed below 50 MA and 100 MA.
The MACD histogram is in the negative zone, but above the signal line, which gives a weak signal to sell EUR/USD.
Stochastic Oscillator is near the overbought zone, the %K line has been crossing the %D line. There are no signals at the moment.
Trading recommendations
Support levels: 1.11300, 1.11000, 1.10700
Resistance levels: 1.11650, 1.11900, 1.12200
If the price fixes below 1.11300, a further drop in the EUR/USD quotes is expected. The movement is tending to 1.11000-1.10800.
An alternative could be the growth of the EUR/USD currency pair to a round level of 1.12000.
The GBP/USD currency pair
Technical indicators of the currency pair:
Prev Open: 1.20591
Open: 1.20548
% chg. over the last day: -0.01
Day’s range: 1.20506 – 1.20638
52 wk range: 1.2015 – 1.3385
The technical pattern is still ambiguous on the GBP/USD currency pair. The British pound continues to consolidate. The local support and resistance levels are 1.20450 and 1.20750, respectively. Yesterday, positive data on inflation were published in the UK. In the near future, we do not exclude the correction of GBP/USD quotes after a continuous fall. We recommend monitoring the current information on the Brexit issue. Positions should be opened from key levels.
At 11:30 (GMT+3:00), a report on retail sales will be published in the UK.
Indicators do not give accurate signals: 50 MA has been crossing 100 MA.
The MACD histogram is near the 0 mark.
Stochastic Oscillator is in the neutral zone, the %K line is above the %D line, which indicates the bullish sentiment.
Trading recommendations
Support levels: 1.20450, 1.20150, 1.20000
Resistance levels: 1.20750, 1.21050, 1.21400
If the price fixes above 1.20750, the GBP/USD quotes are expected to correct. The movement is tending to 1.21000-1.21300.
An alternative could be a decrease in the GBP/USD currency pair to 1.20150-1.20000.
The USD/CAD currency pair
Technical indicators of the currency pair:
Prev Open: 1.32228
Open: 1.33143
% chg. over the last day: +0.67
Day’s range: 1.32944 – 1.33222
52 wk range: 1.2727 – 1.3664
Yesterday, aggressive purchases were observed on the USD/CAD currency pair. The growth of quotes exceeded 90 points. The loonie reached key extremes. The Canadian dollar is under pressure due to the negative dynamics of oil prices. At the moment, the local support and resistance levels are 1.32850 and 1.33100, respectively. A trading instrument has the potential for further growth. Today we recommend paying attention to economic reports from the US. Positions should be opened from key levels.
The news feed on Canada’s economy is calm.
The price has fixed above 50 MA and 100 MA, which signals the power of buyers.
The MACD histogram is in the positive zone, but below the signal line, which gives a weak signal to buy USD/CAD.
Stochastic Oscillator is in the neutral zone, the %K line has been crossing the %D line. There are no signals at the moment.
Trading recommendations
Support levels: 1.32850, 1.32500, 1.32150
Resistance levels: 1.33100, 1.33250, 1.33450
If the price fixes above 1.33100, further growth of the USD/CAD currency pair is expected. The movement is tending to 1.33400-1.33600.
An alternative could be a drop in the USD/CAD quotes to 1.32600-1.32400.
The USD/JPY currency pair
Technical indicators of the currency pair:
Prev Open: 106.732
Open: 105.882
% chg. over the last day: -0.78
Day’s range: 105.727 – 106.774
52 wk range: 104.97 – 114.56
The USD/JPY currency pair has been growing again. At the moment, the trading instrument is testing key extremes. The USD/JPY quotes have the potential for further correction after a continuous fall. The local support and resistance levels are 105.750 and 106.450, respectively. Today we recommend paying attention to statistics from the US. Positions should be opened from key levels.
The news feed on Japan’s economy is quite calm.
Indicators do not give accurate signals: the price has crossed 50 MA and 100 MA.
The MACD histogram is near the 0 mark.
Stochastic Oscillator is in the neutral zone, the %K line has crossed the %D line. There are no signals at the moment.
Trading recommendations
Support levels: 105.750, 105.100
Resistance levels: 106.450, 106.900, 107.300
If the price fixes above 106.450, further correction of the USD/JPY currency pair is expected. The movement is tending to 107.000-107.300.
An alternative could be a drop in the USD/JPY quotes to 105.350-105.100.
The US dollar is moving in different directions against a basket of currency majors despite the weakness of the US economy. The US bonds yield curve has become inverted for the first time since 2007, indicating a possible recession in the US economy. It means that the two-year US government bonds yield rose above the standard 10-year government bonds yield. Experts forecast that the economic growth in the country may slow down so much that the Fed is likely to be forced to stimulate economic growth by lowering interest rates. At the same time, the US dollar index (#DX) closed the trading session in the positive zone (+0.20%).
The tense trade relations between the US and China are a key reason why the global economy is worsening. The US President hopes that China will be able to resolve the situation in Hong Kong, as well as countries, will come to a trade agreement. Investors following the relevant information on these issues.
The “black gold” prices show negative dynamics. Currently, futures for the WTI crude oil are testing the $54.75 mark per barrel.
Market Indicators
Yesterday, aggressive sales were observed in the US stock markets: #SPY (-2.96%), #DIA (-3.07%), #QQQ (-2.99%).
The 10-year US government bonds yield has collapsed again. At the moment, the indicator is at the level of 1.58-1.59%.
The news feed for 2019.08.15:
– Statistics on retail sales in the UK at 11:30 (GMT+3:00); – Philadelphia Fed manufacturing index at 15:30 (GMT+3:00); – Report on retail sales in the US at 15:30 (GMT+3:00).
On Wednesday the 14th of August, trading on the EURUSD pair closed down. The euro dropped against the dollar during the US session despite the safe haven assets making gains. For some reason, euro traders had their attention turned towards recession fears in Germany. The pair found some resistance at 1.1131.
Day’s news (GMT+3):
11:30 UK: retail sales (Jul).
15:30 US: retail sales (Jul), initial jobless claims (9 Aug), Philadelphia Fed manufacturing survey (Aug), NY Empire State manufacturing index (Aug).
16:15 US: industrial production (Jul).
Current situation:
Yesterday’s forecast didn’t entirely work out. After reaching the balance line, we saw an aggressive wave of sales. There doesn’t seem to be any basis for this decline. There are more questions than answers. German GDP data came out in the afternoon, but the drop came during the evening. This is quite a big delay. The euro’s status as a funding currency didn’t help, although this should have saved it from decline.
Yesterday, there were multiple reports of a yield curve inversion, with US 10-year bond yields overtaking 2-year yields. This has triggered fears of a recession in the US among experts. Some people look at the difference between 2-year and 10-year bonds, while others prefer to go by the difference between 5-year and 2 and 3-year bonds. Yesterday, we looked at the difference between 2 and 10-year bond yields, which wasn’t in negative territory. Now it’s at 0.01%. Those that are in negative territory have been since the beginning of August, so it’s unclear what led the euro bulls to close their long positions.
The EURUSD pair is currently trading at 1.1142. Since we got a false breakout of the channel’s lower boundary, we expect the pair to inch upwards towards the balance line. This should stop at around 1.1160, although if we get a convincing breakout of this level, the pair could rise as far as 1.1190.
In this last segment of our multi-part research post regarding the US Fed and the global central banks, it is becoming evident that the fear of a further market contraction is resulting in the decrease in rates and the push for additional QE functions. Our research has shown that the global economy has partially recovered from the 2008-09 credit market collapse, but the process of the recovery has resulted in a “blowout” type of event where shifting capital intents and the transition from the 19th century economic model towards a new 21st century economic model is setting up the global markets for a massive rotation event over the next 12 to 24 months – possibly longer.
It is our belief that capital is still doing what capital always does, seeking out the best opportunities for safety and returns. Right now, that location is easily found in only certain segments of the markets; volatility, precious metals, certain energy sectors, US Treasuries and CASH. The future events, including the massive rotational event that we believe is about to unfold in the global markets, will change the way capital is deployed for many years to come.
It is very likely that this rotation event will create incredible opportunities for skilled technical traders or subscribers to our trade signal newsletter over the next 12 to 36 months and will likely prompt a further shift towards the new 21st-century economic model that we believe will be the ultimate outcome.
Taking a brief look at our recent history highlights the fact that capital becomes fearful about 12 to 16 months before a major US election event. Additionally, certain other factors related to the global economy heighten this fear as US/China trade issues, global debt issues and economic output issues continue to plague the markets. The combination of these types of events set up a “perfect storm” type of economic cycle where skilled technical traders are just waiting for the impact event to hit before the markets begin a bigger rotational event.
These types of events, similar to the 2000 and 2008-09 market crash event, are a process where price rotates out of a normal range and attempts to explore lower price levels that act as price support. It is not uncommon for these types of events to happen, although the severity of these events is difficult to determine prior to their execution.
The US Fed and global central banks set up an easy money process over the past 9+ years that allowed for capital to be deployed as a process that has setup this current massive rotational event. At first, the intent was to support collapsing markets and institutions – we understand that. But the nature of capital is to always seek out suitable safety and returns, so capital did what is always does hunt out the best opportunities for profits. First, it rallied into the crashing real estate market and emerging markets – which had been crushed by the 2008-09 credit crisis event. Next, it piled into the Asian markets and healthcare/technology markets. At this time, it also started piling into the startup/VC markets throughout the world as well as certain commodities. The recovery seemed to have created a booming and cash-flush market for anyone with two dollars to rub together.
Then came the 2015-16 market contraction and the end of the US Fed QE processes. At this time, China realized the need to control capital outflows and the US/Global markets slowed to a crawl as the US Presidential election cycle ramped-up. It was just 12 months prior to this 2015-16 event that oil crashed from $114 to $46. Within 2015-16, Oil continued to crash to levels below $30. This was the equivalent of the blowout cycle for the global economy. Headed into the 2016 US elections, the global economy was running on only 5 of 8 cylinders and was limping along hoping to find some way out of this mess.
The November 2016 US elections were just what the global economy needed and everyone’s perceptions about the future changed almost overnight. I remember watching the price of Gold on election night; +$75 early in the evening as Clinton was expected to win, then it continued to fall back to +$0 fairly late in the evening, then it fell to -$75 as the news of a Trump win was solidified. This rotation equated to a nearly 10% rotation in less than 24 hours based on FEAR. Once fear was abated, global investors and capital went to work seeking out the safest environments and best returns – like normal.
This resurgence of capital into the markets set up of a new SOP (standard operating procedure) where capital began to be deployed in more risky environments and into broader and bigger investment structures. This is the SETUP I’m trying to highlight that was created by the US Fed and central banks. I don’t believe anyone thought, at that time in early 2017, that the current set of events would have transpired and I believe global governments, central banks, and global financial institutions thought, “Party on, dude! We’re back to 2010 all over again”. Boy, were they wrong.
This time, the global central banks, governments and state-run enterprises engaged in bigger and more complex credit/debt structures while attempting to run the same game they were running back in 2010 and 2011. The difference this time is that the US Fed started raising Fed Fund Rates and destroyed the US Dollar carry trade while putting increasing pressure on the global market, global debt and global trade. The continued rally of the US Dollar after the 2018 lows helped to solidify the advantages and risks in the markets. This upside rally in the US Dollar, after the 2014 to 2016 rally, really upset the balance of the global markets and setup an increasing pressure point for foreign markets.
It soon became very evident that risks in the foreign markets could be partially mitigated by investing in the US stock market and by moving capital away from risky currencies and into US Dollar based assets. Capital is always doing what it always does – seeking out the best environment for returns and protection from risk. Thus, we have the setup right now – only 15 months before the 2020 US Presidential elections. What happens now?
This setup is likely to prompt a rotation in the global markets as well as within the US stock market. It is very likely that a continued contraction in consumer and banking activity (think business, real estate, trade, commodities, and others) will prompt a contraction in global economics very similar to what happened in 2014~2016. This process will likely put extreme risk factors at play in some of the most fragile economies and state-run enterprises on the planet. Once the flooring begins to crack in some of these markets, we’ll see how this event will play out. Right now, our eye is watching Europe and Asia for early warning signs.
The US Fed will continue to manipulate the FFR levels in an attempt to help mitigate the risks associated with this contraction event. It is likely that the US Fed already sees what we see and it attempting to position themselves into a more responsive stance given the potential outcomes. Inadvertently, the US Fed and global central banks presented an offer that was too good for anyone to ignore – easy cash. What they didn’t expect is that the 2014 to 2019 rally in the US Dollar and US stock market would transition capital deployment within the global market in such a way that it has – setting up the current event cycle.
We believe a downside pricing event is very likely over the next 10 to 25+ days where the US stock market may fall 12 to 25%, targeting levels shown on this chart (or slightly lower) as this rotational event takes place. Ultimately, the US markets will recover much quicker than many foreign/global markets. Our estimates are that the recovery in the US markets will likely begin to take place near March or April 2020 and continue higher beyond this date.
This Custom Smart Cash Index chart highlights the type of capital shift activity we’ve been describing to our readers and followers. It is easy to see that capital moved out of risky investments within the downturns on this chart and into the most opportunistic equity markets within the uptrends on this chart. Remember, most opportunistic markets are sometimes outside of the scope of this Smart Cash index. For example, this chart does not relate strength in the Precious Metals markets or other commodities/currencies. All this chart is trying to highlight for followers is how capital is being deployed in viable global equity markets and when capital is exiting or entering these markets.
Given the current setup, we would expect a breakdown in this Smart Cash Index over the next 4+ months to set up a new lower price level establishing a base/bottom before attempting to move higher. We believe the 100 level, shown as historical support, is a proper target price level for this move initially.
Lastly, we believe capital is moving aggressively into the precious metals markets and we urge all skilled technical traders to pay attention to this chart of the Gold/Silver ratio. If our analysis is correct and a larger rotation price cycle is about to unfold in the global markets, which may last well into 2020 (or beyond) for certain global markets, then you really need to pay attention to the upside potential for this Gold/Silver ratio.
As we’ve drawn on this chart, if this ratio recovers to 50% of the 2011 peak levels as this rotation unloads on the global market, this would push Gold and Silver prices to levels potentially 60% to 140%+ higher than current levels. I understand how hard it is to understand these types of incredible price increases and how they could possibly be relative to current prices, but trust us in our research. Gold and Silver prices have been measurably depressed over the past 3 to 4 years. Unleashing the real valuation levels of these precious metals at a time when risk factors are excessive suggests that Gold could easily be trading above $3200 and Silver above $60 to $65 within 6 to 12 months.
CONCLUDING THOUGHTS:
In closing, we want to urge all skilled technical traders to keep a very open perspective to the “Party on, Dude” mode of the global central banks and be aware that a very fragile floor is the only thing holding up the markets in another massive US presidential election cycle event. In our opinion, the writing is already on the wall and we are preparing for this rotational event and alerting our members on what to do to profit from these moves.
The Federal Reserve and global central banks will attempt to keep the party rolling for as long as possible because they know the downside event could be something they don’t want to have to deal with. So watch how these global central banks attempt to nudge public perception away from risks and towards the “party on” mode. Stay alert. Stay aware. When this breaks, it will break quickly and aggressively.
Using technical analysis and proven strategies we can follow the market trends and profit from them no matter which the market moves. We bet with the market (the house) and provide entry, target, and stops for all trades we initiate.
NEXT MOVES FOR GOLD, SILVER, MINERS, AND S&P 500
In early June I posted a detailed video explaining in showing the bottoming formation and gold and where to spot the breakout level, I also talked about crude oil reaching it upside target after a double bottom, and I called short term top in the SP 500 index. This was one of my premarket videos for members it gives you a good taste of what you can expect each and every morning before the Opening Bell. Watch Video Here.
I then posted a detailed report talking about where the next bull and bear markets are and how to identify them. This report focused mainly on the SP 500 index and the gold miners index. My charts compared the 2008 market top and bear market along with the 2019 market prices today. See Comparison Charts Here.
On June 26th I posted that silver was likely to pause for a week or two before it took another run up on June 26. This played out perfectly as well and silver is now head up to our first key price target of $17. See Silver Price Cycle and Analysis.
More recently on July 16th, I warned that the next financial crisis (bear market) was scary close, possibly just a couple weeks away. The charts I posted will make you really start to worry. See Scary Bear Market Setup Charts.
HMRC’s bid to claw back taxes on cryptocurrencies demonstrates the digital assets are the future of money, affirms the CEO of one of the world’s largest independent financial advisory organizations.
Nigel Green, chief executive of deVere Group, which launched the cryptocurrency app deVere Crypto in early 2018, is speaking out after it is revealed that HM Revenue & Customs is asking cryptocurrency exchanges to reveal customers’ names and transaction histories, in a bid to recover unpaid taxes.
Mr Green comments: “This move by the UK’s tax authority cannot be viewed as anything other than another clear sign that cryptocurrencies like Bitcoin, Ethereum and XRP are not only part of mainstream finance, but also the future of money.”
He continues: “There is a continual and increasingly rapid slew of indicators that digital currencies are gaining traction in our increasingly digitalised world –much to the chagrin of financial traditionalists like Warren Buffet and Donald Trump.
“For instance, financial regulators around the world are preparing and looking to implement regulatory guidelines for cryptocurrencies in order to keep pace with countries like Japan, Malta, Switzerland and South Korea which already have pro-crypto policies.
“Most major financial institutions globally already have or are preparing to establish crypto desks.
“A growing number of retail and institutional investors are piling into the crypto sector market.
“Tech giants, like Facebook, are planning to launch their own cryptocurrency – and where Facebook goes other tech monoliths will follow.
“And just this week, China’s central bank, which oversees the world’s second largest economy, has revealed it will soon launch its own state-backed cryptocurrency following five years of research.”
When Donald Trump last month criticised Bitcoin, the deVere CEO said the president was “placing himself on the wrong side of history.”
He went on to note: “Standing on the sidelines, or worse looking backwards, on the issue of cryptocurrencies – which are redefining and reshaping the financial system – is a baffling approach for the leader of the world’s largest economy to take.”
Mr Green concludes: “HMRC’s growing interest in cryptocurrencies underscores that their public influence and appeal is growing.”
About:
deVere Group is one of the world’s largest independent advisors of specialist global financial solutions to international, local mass affluent, and high-net-worth clients. It has a network of more than 70 offices across the world, over 80,000 clients and $12bn under advisement.
EURUSD is moving downwards. Possibly, today the pair may reach 1.1166 and then start a new correction towards 1.1190. After that, the instrument may resume trading downwards with the short-term target at 1.1144.
GBPUSD, “Great Britain Pound vs US Dollar”
GBPUSD is still moving downwards. Today, the pair may reach 1.2027 and then start another correction towards 1.2080. Later, the market may continue trading inside the downtrend with the target at 1.1955.
USDCHF, “US Dollar vs Swiss Franc”
USDCHF is forming the ascending impulse towards 0.9780. After that, the pair may be corrected to reach 0.9720 and then continue moving upwards with the target at 0.9873.
USDJPY, “US Dollar vs Japanese Yen”
USDJPY is moving upwards to reach 107.07. After that, the instrument may start a new correction towards 106.00 and then form one more ascending structure with the target at 107.22.
AUDUSD, “Australian Dollar vs US Dollar”
AUDUSD is forming the third ascending wave. Possibly, today the pair may break 0.6808 and then continue moving upwards with the target at 0.6830. After that, the instrument may return to 0.6808 to test it from above and then resume trading upwards to reach the short-term target at 0.6870.
USDRUB, “US Dollar vs Russian Ruble”
USDRUB has finished the first descending impulse at 64.90. Today, the pair may be corrected to reach 65.40 and then resume trading downwards to break 64.84. Later, the market may continue moving inside the downtrend with the short-term target at 64.28.
XAUUSD, “Gold vs US Dollar”
Gold has completed the first descending impulse at 1480.00. Today, the pair may start a new correction to reach 1509.00 and then form one more descending structure with the target at 1463.20.
BRENT
Brent has reached the predicted upside target. Possibly, today the pair may be corrected towards 60.20 and then start a new ascending wave with the target at 62.34. After that, the instrument may resume trading downwards to reach 58.50.
Attention! Forecasts presented in this section only reflect the author’s private opinion and should not be considered as guidance for trading. RoboForex LP bears no responsibility for trading results based on trading recommendations described in these analytical reviews.
The gold bears have finally caved under the deafening barrage of fiscal and geopolitical catalysts, from Fed hints to intensely brewing conflict with Iran. But there is one key trend that stands to push gold up beyond $1,700–regardless of the day’s news.
Of course, it’s difficult for the bears to ignore a nearly $50/ounce gain for gold, which is now trading well above its 5-year high.
Not only has the U.S.-Iran conflict reached a boiling point, with Trump readying to deploy an additional 1,000 troops to the Middle East, but the European Central Bank has issued a defiant, dovish tone, saying it won’t hesitate to provide further stimulus: That means rate cuts.
The icing on the gold cake is the US Fed, which has now clearly indicated that it hasn’t abandoned the idea of rate cuts for 2019.
But in this perfect storm for gold prices, EuroSun Mining (TSE:ESM, OTCMKTS:CPNFF) CEO Scott Moore says we’re overlooking a significant trend that will outlast the current geopolitical meltdown and even the Fed’s policies: It’s a global push for de-dollarization.
“Government’s around the world are becoming increasingly wary of the dollar’s hegemony in international trade,” says Moore. “And they’re doing their best to distance themselves from it by using their gold reserves to buy more gold instead.”
This process is already underway mainly in nations with strong anti-U.S. sentiment including Russia, China, Iran, Venezuela, Syria, Turkey, Qatar, India, Pakistan, Libya, Egypt and the Philippines among others.
Naturally, these countries are turning to gold since the yellow metal is not under lock-and-key like the greenback and other electronic payment methods.
This trend is abundantly clear when you look at central banks’ buying activity.
According to the World Gold Council, central banks purchased nearly 70 percent more gold during the first quarter of the year than they did during the previous year’s corresponding period.
That’s the most they bought since the first quarter of 2013.
For EuroSun’s Rovina Valley project in Romania–the largest in-development gold mine in Europe–the de-dollarization drive will been a boon for the 10 million ounces of gold equivalent they’re hoping to get out of the ground in the simple geography of Romania’s prolific Tethyan Gold Belt.
There are plenty of billionaire fund managers who think today’s ‘crazy’ gold prices are just getting started.
Not least among them is Paul Tudor Jones, who says that gold “has everything going for it”, and sees it pushing to $1,700 an ounce “rather quickly”, as he noted in an interview with Bloomberg.
And this is all just thanks to near-term trends wrapped up in the Fed and wild geopolitics.
We’re interested instead in the long-term trend that is says gold will be a major winner of the global de-dollarization trend.
There’s nothing like a sanctions frenzy to create a major uptick in momentum here.
Most notably, Russia and China have pledged to accelerate their de-dollarization strategies because of Trump’s sanctions push. And they’ve reached a deal to use national currencies for bilateral trade. No more U.S. dollar, then.
So, we’re carefully watching what the central banks are doing.
The latest countries to jump on the de-dollarization bandwagon are Serbia and the Philippines. Serbia is boosting its national gold reserves, increasing them from 20 to 30 tons by the end of this year. It’s shooting for 50 tons by the end of 2020.
Tudor is watching these developments closely, and to him, it suggests an unprecedented shift:
“Remember we’ve had 75 years of expanding globalization and trade, and we built the machine around the belief that’s the way the world’s going to be. Now all of a sudden it’s stopped, and we are reversing that,” he told Bloomberg.
“When you break something like that, the consequences won’t be seen at first, it might be seen one year, two years, three years later. That would make one think that it’s possible that we go into a recession. That would make one think that rates in the US go back toward the zero bound and in the course of that situation, gold is going to scream. ”
EuroSun’s (TSE:ESM, OTCMKTS:CPNFF) Moore agrees: “What’s happening with Iran right now will only further the de-dollarization push. The dollar isn’t necessarily king anymore, and gold is more than ready to resume its rightful place on the safe haven throne.”
Five gold companies to watch as more countries push for de-dollarization:
Yamana Gold (NYSE:AUY) (TSE:YRI)
Yamana, has recently completed its Cerro Moro project in Argentina, giving its investors something major to look out for. The company plans to ramp up its gold production by 20% through 2019 and its silver production by a whopping 200%. Investors can expect a serious increase in free cash flow if precious metal prices remain stable.
Recently, Yamana signed an agreement with Glencore and Goldcorp to develop and operate another Argentinian project, the Agua Rica. Initial analysis suggests the potential for a mine life in excess of 25 years at average annual production of approximately 236,000 tonnes (520 million pounds) of copper-equivalent metal, including the contributions of gold, molybdenum, and silver, for the first 10 years of operation.
The agreement is a major step forward for the Agua Rica region, and all of the miners working on it.
Eldorado Gold Corp. (NYSE:EGO) (TSE:ELD)
This Canadian mid-cap miner has assets in Europe and Brazil and has managed to cut cost per ounce significantly in recent years. Though its share price isn’t as high as it once was, Eldorado is well positioned to make significant advancements in the near-term.
In 2018, Eldorado produced over 349,000 ounces of gold, well above its previous expectations, and is set to boost production even further in 2019. Additionally, Eldorado is planning increased cash flow and revenue growth this year.
Eldorado’s President and CEO, George Burns, stated: “As a result of the team’s hard work in 2018, we are well positioned to grow annual gold production to over 500,000 ounces in 2020. We expect this will allow us to generate significant free cash flow and provide us with the opportunity to consider debt retirement later this year. ”
Barrick Gold Corp. (NYSE:GOLD) (TSE:ABX) and Goldcorp Inc. (NYSE:GG):
All eyes are on the billion-dollar partnership these two giants are forming in Chile’s gold belt. Goldcorp is putting up $1 billion to get in on this deal as miners scramble for new sources of growth. This joint venture will see the two giant miners operate three properties in Chile’s Maricunga region, and these will be major catalysts for both.
Newmont Mining Corp (NYSE:NEM) Founded over 100 years ago, Newmont Mining Corporation (NYSE:NEM) is one of the leading mining companies in the world. The company holds assets in Peru, Australia, Ghana, Indonesia, Mexico, and around the United States. Primarily focusing on gold and copper, Newmont has steadily carved out a name for itself among those in the industry. In Q1 2017 alone, the company secured over 1.2M ounces of gold. Definitely noteworthy for investors.
Wheaton is a company with its hands in operations all around the world. As one of the largest ‘streaming’ companies on the planet, Wheaton has agreements with 19 operating mines and 9 projects still in development. Its unique business model allows it to leverage price increases in the precious metals sector, as well as provide a quality dividend yield for its investors.
Recently, Wheaton sealed a deal with Hudbay Minerals Inc. relating to its Rosemont project. For an initial payment of $230 million, Wheaton is entited to 100 percent of payable gold and silver at a price of $450 per ounce and $3.90 per ounce respectively.
Randy Smallwood, Wheaton’s President and Chief Executive Officer explained, “With their most recent successful construction of the Constancia mine in Peru, the Hudbay team has proven themselves to be strong and responsible mine developers, and we are excited about the same team moving this project into production. Rosemont is an ideal fit for Wheaton’s portfolio of high-quality assets, and when it is in production, should add well over fifty thousand gold equivalent ounces to our already growing production profile.”
Centerra Gold Inc. (OTCMKTS: CAGDF) (TSE:CG)
Centerra Gold is a Canada-based gold miner with flagship assets, the Mount Milligan Mine and the Kumtor Mine which are located in Canada and the Kyrgyz Republic respectively. It also owns the Öksüt Gold Mine in Turkey, making it the single-largest North American gold company operating in Asia, with over 22 years of experience in the region.
Centerra’s biggest selling points, however, are its strong balance sheets. For 2018, the company reported over $100 million in net earnings, generating over $217 million from cash operations, exceeding many analyst’s expectations.
Scott Perry, President and Chief Executive Officer of Centerra stated, “As a result of the strong fourth quarter operating performance at both operations, the Company exceeded its overall 2018 production and cost guidance producing 729,556 ounces of gold at an all-in sustaining cost on a by-product basis of $754 per ounce sold, beating the low-end of our all-in-sustaining cost guidance for the year.
IMPORTANT NOTICE AND DISCLAIMER
Oilprice.com, Advanced Media Solutions Ltd, and their owners, managers, employees, and assigns (collectively “the Publisher”) has not been paid to publish this communication. This communication is not, and should not be construed to be, an offer to sell or a solicitation of an offer to buy any security. The Publisher is not, and does not purport to be, a broker-dealer or registered investment adviser. This communication is not, and should not be construed to be, personalized investment advice directed to or appropriate for any particular investor. Any investment should be made only after consulting a professional investment advisor and only after reviewing the financial statements and other pertinent corporate information about the company.
SHARE OWNERSHIP. The owner of Oilprice.com owns shares of the featured company and is therefore extremely biased and has an incentive to see its stock perform well. The owner of Oilprice.com has no present intention of selling any shares in the near future but also does not assume any obligation to notify the market when it decides to buy or sell shares.