by JustForex
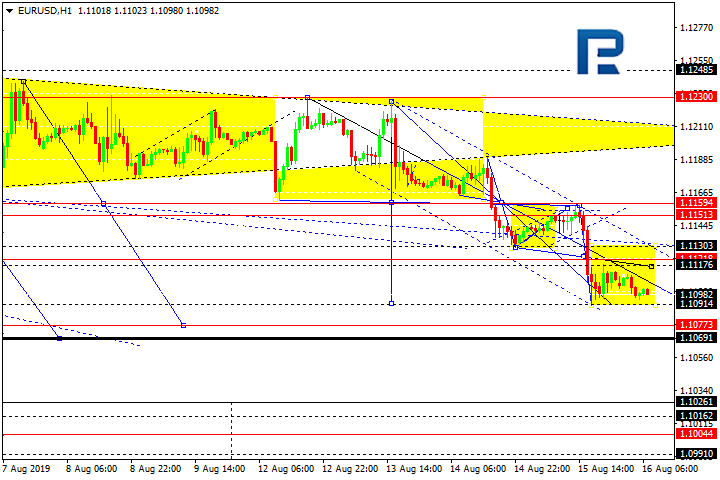
The EUR/USD currency pair
- Prev Open: 1.11050
- Open: 1.10921
- % chg. over the last day: -0.15
- Day’s range: 1.10876 – 1.11012
- 52 wk range: 1.1034 – 1.1817
The EUR/USD currency pair had become stable after a rather significant fall last week. The trading instrument is currently consolidating. A unidirectional trend is not observed. Investors expect additional drivers. The local support and resistance levels are 1.10700 and 1.11000, respectively. Today we expect important statistics on the Eurozone’s economy. Positions should be opened from key levels.
- – Consumer price index in the Eurozone at 12:00 (GMT+3:00).

Indicators point to the power of sellers: the price has fixed below 50 MA and 100 MA.
The MACD histogram is in the negative zone, but above the signal line, which gives a weak signal to sell EUR/USD.
Stochastic Oscillator is in the neutral zone, the %K line is above the %D line, which indicates the bullish sentiment.
- Support levels: 1.10700, 1.10500
- Resistance levels: 1.11000, 1.11300, 1.11650
If the price fixes below 1.10700, a further fall in the EUR/USD quotes is expected. The movement is tending to 1.10500-1.10200.
An alternative could be the growth of the EUR/USD currency pair to 1.11300-1.11500.
The GBP/USD currency pair
- Prev Open: 1.20819
- Open: 1.21500
- % chg. over the last day: +0.53
- Day’s range: 1.21401 – 1.21725
- 52 wk range: 1.2015 – 1.3385
The bullish sentiment prevails on the GBP/USD currency pair. The British pound is currently testing key highs. The local support and resistance levels are 1.21400 and 1.21750, respectively. A trading instrument has the potential for further recovery after a continuous fall. Financial market participants continue to monitor the situation concerning Brexit. Positions should be opened from key levels.
Today, the publication of important economic releases from the UK is not planned.

Indicators point to the power of buyers: the price has fixed above 50 MA and 100 MA.
The MACD histogram is in the positive zone and continues to rise, which signals the bullish sentiment.
Stochastic Oscillator is near the overbought zone, the %K line is above the %D line, which gives a weak signal to buy GBP/USD.
- Support levels: 1.21400, 1.21000, 1.20750
- Resistance levels: 1.21750, 1.22100
If the price fixes above 1.21750, further correction of the GBP/USD quotes is expected. The movement is tending to 1.22000-1.22300.
An alternative could be a decrease in the GBP/USD currency pair to a round level of 1.21000.
The USD/CAD currency pair
- Prev Open: 1.33122
- Open: 1.32694
- % chg. over the last day: -0.29
- Day’s range: 1.32602 – 1.33770
- 52 wk range: 1.2727 – 1.3664
On Friday, the USD/CAD currency pair moved away from local highs. The fall in quotes exceeded 45 points. The loonie is currently consolidating. The key range is 1.32600-1.32900. The positive dynamics of oil quotes support the Canadian dollar. At the same time, we do not exclude the further growth of USD/CAD quotes. Today, the news feed is calm enough. We recommend opening positions from key levels.
The publication of important economic reports from Canada is not planned.

Indicators do not give accurate signals: the price has crossed 100 MA.
The MACD histogram is in the negative zone, but above the signal line, which gives a weak signal to sell USD/CAD.
Stochastic Oscillator is in the overbought zone, the %K line has crossed the %D line. There are no signals at the moment.
- Support levels: 1.32600, 1.32150, 1.31850
- Resistance levels: 1.32900, 1.33250, 1.33450
If the price fixes above the level of 1.32900, further growth of the USD/CAD currency pair is expected. The movement is tending to 1.33200-1.33500.
An alternative could be a fall in the USD/CAD quotes to 1.32300-1.32150.
The USD/JPY currency pair
- Prev Open: 106.056
- Open: 106.250
- % chg. over the last day: +0.25
- Day’s range: 106.241 – 106.473
- 52 wk range: 104.97 – 114.56
The technical pattern is still ambiguous on the USD/JPY currency pair. A trading instrument is consolidating. At the moment, USD/JPY quotes are testing the resistance level of 106.500. The 106.100 mark is the nearest support. The USD/JPY currency pair has the potential for further growth. We recommend paying attention to the dynamics of the US government bonds yield. Positions should be opened from key levels.
During the Asian trading session, mixed data on Japan’s trade balance have been published.

Indicators point to the power of buyers: the price has fixed above 50 MA and 100 MA.
The MACD histogram is in the positive zone, but below the signal line, which gives a weak signal to buy USD/JPY.
Stochastic Oscillator is in the neutral zone, the %K line is above the %D line, which indicates the bullish sentiment.
- Support levels: 106.100, 105.750, 105.500
- Resistance levels: 106.500, 107.000
If the price fixes above 106.500, further growth of the USD/JPY currency pair is expected. The movement is tending to the round level of 107.000.
An alternative could be a fall in the USD/JPY quotes to 105.750-105.500.
by JustForex