The US dollar has not changed a lot against a basket of currency majors. Yesterday, the US dollar index (#DX) closed the trading session in the negative zone (-0.13%). Investors expect additional drivers. Today, important economic releases from the UK, Germany and the United States will be published. Experts also expect new information regarding US-China trade relations, as well as the Brexit process.
Market sentiment is still volatile due to events in Hong Kong and Argentina. In Hong Kong, mass protests against strict police actions to break up recent demonstrations have been lasting for more than two months. On Monday, more than 130 flights were canceled at Hong Kong Airport, as thousands of protesters gathered in the departure and arrival halls. Meanwhile, on Monday, the stock market and the Argentine peso fell sharply due to the presidential election, where opposition candidate Alberto Fernandez won. These events support the demand for “safe” assets.
The situation in the UK is getting worse amid the oncoming Brexit. According to The Guardian, one-in-five Britons are stockpiling food, drinks, and medicine. British people and large companies fear that Britain will leave the bloc without a deal and it will lead to a crisis.
The “black gold” prices have been growing. Currently, futures for the WTI crude oil are testing the $55.20 mark per barrel. At 23:30 (GMT+3:00) API weekly crude oil stock will be published.
Market Indicators
Yesterday, the bearish sentiment was observed in the US stock markets: #SPY (-1.22%), #DIA (-1.44%), #QQQ (-1.15%).
The 10-year US government bonds yield has declined significantly again. At the moment, the indicator is at the level of 1.64-1.65%.
The news feed for 2019.08.13:
– UK labor market data at 11:30 (GMT+3:00); – ZEW economic sentiment indices in Germany and the Eurozone at 12:00 (GMT+3:00); – US inflation report at 15:30 (GMT+3:00).
Six out of 10 investors are now actively seeking to move assets out of Britain as a perfect storm looks set to hit the UK economy, reveals a new poll.
The survey of more than 740 clients carried out by deVere Group, one of the world’s largest independent financial advisory organizations, which has $12bn under advisement, comes as the pound plunged to its lowest level for a decade late on Sunday amid growing fears the UK is heading for a no-deal Brexit.
It also follows Monday’s report by the Office for National Statistics (ONS) that finds the outlook for the general economic situation for the year ahead is worse than at any point since the final quarter of 2011.
Nigel Green, the CEO and founder of deVere Group, notes: “There is a legitimate and growing sense amongst those who were polled that in order to build and safeguard wealth, assets should be moved outside of the UK.
“It comes amid a slew of negative official data and public sentiment regarding Britain’s economic outlook over the next few years.
“Clients have expressed that they feel there’s a closing ‘window of opportunity’ to transfer their UK-based financial assets within the next few months.”
He continues: “Investors are seeing a perfect storm brewing: the UK’s slowing economy, weak global economic growth, the pound at a 10 year-low, the increasing possibility of an interest rate cut and the risk of a no-deal Brexit pushing the UK into a recession.
“Increasingly they’re now actively looking to take action to mitigate the risks to their wealth – as well as benefitting from the opportunities – through established, international financial planning solutions.”
It’s not just individuals and families. It has been widely reported that firms in the City of London alone have already committed to moving many billions out of the UK to prepare for Brexit – and this figure is expected to increase with many leaving details of their plans unpublished until the Brexit deadline on October 31.
Last month, Nigel Green noted: “There is no end in sight to the embattled British pound’s plight with both the current Prime Minister Boris Johnson and the leader of the official opposition Labour Leader Jeremy Corbyn promoting policies that will deliver fresh – and serious – blows to the currency.”
The deVere CEO concludes: “The poll underscores that the UK is no longer an attractive place for investors.
“The UK is now at a critical point – perhaps the most critical since the global crash. Many are simply not prepared to risk their wealth and are considering international options.”
About:
deVere Group is one of the world’s largest independent advisors of specialist global financial solutions to international, local mass affluent, and high-net-worth clients. It has a network of more than 70 offices across the world, over 80,000 clients and $12bn under advisement.
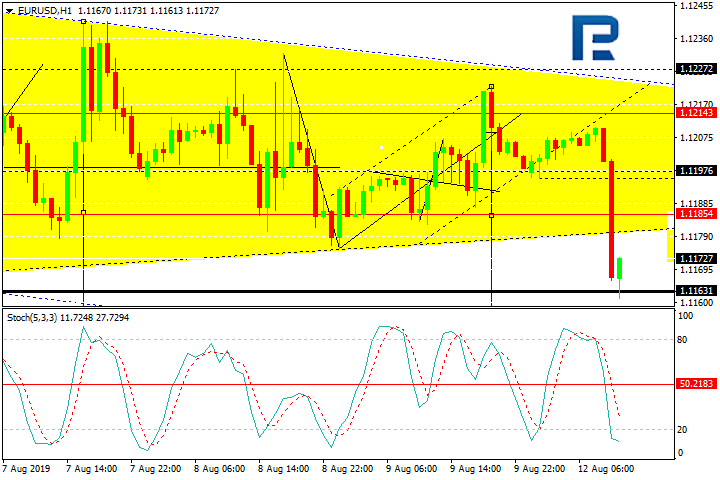
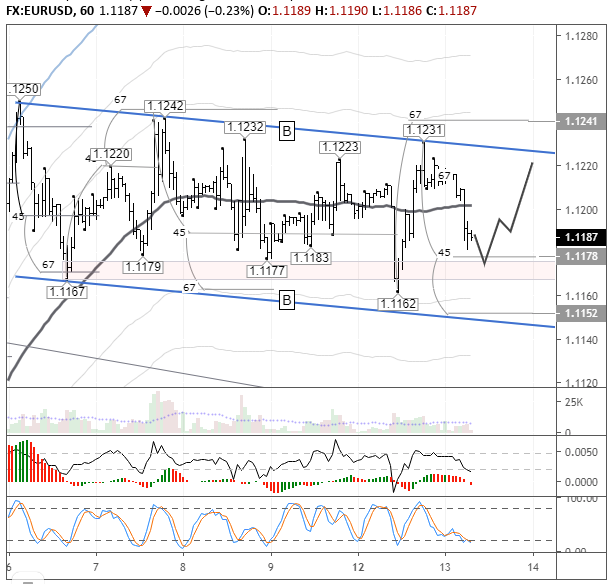
On Monday the 12th of August, trading on the EURUSD pair closed 15 pips up. Donald Trump is still the driving fundamental factor on the market. China is keeping the yuan below 7.00 to the dollar, while Trump is shaking the markets to its foundations with his remarks.
Following the pair’s drop to 1.1162, we got a recovery to 1.1231 on the back of a retreat towards the safe havens. The major US stock indices dropped by 1.5%, while US10Y bond yields also fell. Gold has hit a 6-year high, while the USDJPY pair has reached new lows.
Day’s news (GMT+3):
09:00 Germany: harmonised index of consumer prices (Jul).
The 1.1167, 1.1179, and 1.1177 lows have been revisited. The bears have triggered the stop levels below here and must now wait for the 1.1231, 1.1242, and 1.1250 high to be revisited. The pair is trading below the balance line around the 45th degree. I’m expecting the 45th degree to be tested, followed by a bounce to the upper boundary of the channel at 1.1225.
Goldman Sachs analysts believe that the US and China won’t sign a trade deal before the 2020 election. They’ve also downgraded their growth forecast for the US in the third quarter.
Among the important news releases today are the employment report from the UK, and consumer inflation report from the US, which have a strong influence on the pound and dollar respectively.
As we continue to explore the events of the past 10 to 20+ years and how the global central banks continue to attempt to navigate through these difficult times, we want to take a few minutes to try to understand and explain how the capital that has exploded into the global markets has been deployed and used to chase returns, risk and opportunity and may continue to be deployed more efficiently going forward.
The recent news that the global central banks may begin a new round of stimulus and easing got us thinking – “what next?”. Over the past 10 to 20+ years, global central banks have attempted to prompt an economic recovery that seems to slip past economic planners and we believe that is because core functions of the global economy are weaker than many expect. We’re going to try to explore some of these factors and prepare traders for what may come in the future months.
Much of the capital that was dumped into the markets was deployed into the global equity markets as investments in emerging markets, capital markets, and the US stock market. As much as everyone wants to think this capital went into infrastructure and other essential investments, much of it went into the only thing that was capable of generating an easy return with limited risk – the global stock market.
At first, after 2008, we saw an immediate jump in emerging markets. This sector of the global economy had been hard hit by the collapse in 2008-09 and an incredible opportunity existed because of a price anomaly that was created near the bottom in 2009. Emerging markets were recipients of some capital when the central banks began to infuse money into the system, but their equity markets were uniquely positioned for advancements because of the pricing levels after the crash.
The SPEM chart below highlights the recovery in the emerging market that took place almost immediately after the bottom formed in 2009. We can clearly see the immediate price advance and the resulting sideways price action after 2011. Once this sector recovered up to previous 2007 levels, there was really nothing else to push it much higher.
Traders should also take notice of the rally in 2016 and 2017. This rally was based on forward expectations that renewed interest in emerging markets would result in increased returns. These aligned with expectations resulting from the US Presidential election (2016) as well. This price advance consisted of a +86% price advance from $23 to $42. Could it happen again?
We believe the next phase of the global market recovery will result in a similar type of price advance after new lows are established in emerging markets. Skilled technical traders should continue to plan for and prepare for this type of setup once emerging markets complete a process of exploring lower lows to form a bottom. This process should complete just before the 2020 US presidential elections and will likely result in another price anomaly setup where the price is well below expected asset levels (extreme pessimism) and will set up as an incredible +40% to +80% upside potential as renewed optimism and the continued transitional process of the global economy persists. Traders just need to wait for the setup – then execute their trades.
The continued process of how capital rolls from one environment to another in search of returns is something we have attempted to explain in detail over the past months. We call it the “capital shift” process. Our belief is that capital (cash) is always hunting for suitable investments in various forms and continues to shift from one environment (market segment) to another as opportunities (ROI) and risks (healthy investment environments) change. So, think of capital as a migratory asset that continues to shift into and out of various segments of the market as opportunities and risks present themselves.
One of the biggest benefactors of the quantitative easing and central bank policies of the past 10+ years has been the US equity market. Take a look at this NAS100 chart to see what we mean.
When we take into consideration the post 9/11 market rally in this NAS100 chart (highlighted by the blue rectangle) we can see that, at that time, the capital was focused away from the US markets because other foreign markets were better positioned in terms of ROI and risk. Even though the US was engaging in moderate QE processes to recover from a moderate economic crisis, a price advance in the NAS100 was muted – nothing like the right side of this chart.
The post-2009 advance in the NAS100 is a completely different story. The technology sector in the US had shifted away from a heavy risk factor and into a “unicorn” mode by 2012/2013. This shift in the investment environment meant that global traders saw the US technology market (NAS100) and an excellent opportunity for capital deployment. As more and more cash poured into the NAS100 chasing these gains, prices continued to skyrocket higher. What next?
Unless the dynamics of this market shift away from expected gains or the US Dollar weakens dramatically, we believe the US stock market will continue to experience some volatility and continued price advancement while capital waits to see what happens throughout the rest of the global market.
We do believe the increased volatility of the past 2 years highlights an extended risk for rotation over the next 2+ years and we believe a move lower may be something we have to prepare for as the 6000 level has already been established as support. Therefore, we are not suggesting the NAS100 will go straight up from here. We are suggesting that unless something dramatic happens to change the economic environment, the US markets will continue to be viewed as opportunistic by global investors and that dips in price, even big ones, will likely respond with a nearly immediate recovery in price – even if a dip were to happen well below the 6000 level.
Once the economic environment shifts away from opportunity in the US, then all bets are off in terms of downside risk – if this ever happens.
Another factor that everyone must be aware of is Real Estate. Recently, US real estate has continued to rally as rates have continued to maintain some level of affordability throughout most of the US. Certain areas have gotten very un-affordable and these markets are already experiencing a pricing reversion where prices are declining as sellers attempt to attract buyers at high prices. Overall, though, the health of the US real estate market is still moderately strong.
One thing that we would be concerned about is a perceptional shift away from buying if the US Fed and global central banks engage in new stimulus processes. Consumers may view this process as a warning that some concern is underlying the efforts of the central banks and hold off on buying real estate while they wait to see what happens after the US 2020 elections. We believe this may already be happening right now.
CONCLUDING THOUGHTS:
The REZ real estate ETF continues to push higher as pricing becomes an issue and sales levels continue to support a fairly active market. We are concerned that a sharp change in perception could be taking place over the next 12+ months as fears of a change in US political leadership may thwart or diminish some forward expectations. Investors need to pay attention to all aspects of the markets in order to prepare for future opportunities and price moves.
In Part III of this article, we’ll look into some of the fundamental elements of the US and global economies and how the past actions of the US Fed and global central banks may have set up the global markets for the bigger price rotations we are expecting over the next 12 to 24+ months.
The Euro and the Pound are still under pressure of possible political turmoil. Matteo Salvini, the Deputy Prime Minister of Italy, called for fresh elections. There exists an opinion that the Italian government consisting only of “Lega Nord” party members may get in hot water with the European Union. However, there are no substantive reasons for changes in the government right now, that’s why the European currency barely responds to this news and continues trading sideways. Still, one shouldn’t exclude a possibility of the Euro rate decline in the nearest future against the background of events in Italy. Right now, the Euro is rebounding from the descending channel’s upside border with the resistance level being near 1.1200.
The British Pound, which got very close to the lowest levels since 2017, is still under pressure from “no-deal” Brexit and the British Prime Minister Boris Johnson, who may call for national elections right after the Brexit. If the date for elections is fixed in the nearest future, the falling Pound may boost its decline and fix below the support level at 1.2000. Moreover, a lot of traders believe that “no-deal” exit may result in higher volatility and risks of further decline towards parity with the American currency.
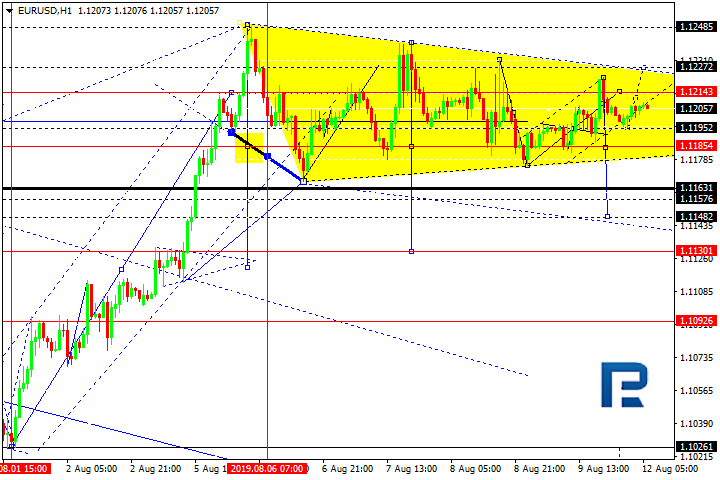
As we can see in the H4 chart, EURUSD has broken 1.1185 to the downside and may continue falling with the short-term target at 1.1130. After that, the instrument may be corrected to return to 1.1185 and then form one more ascending structure to reach 1.1130. Still, this scenario may no longer be valid if the price breaks 1.1225 to the upside. From the technical point of view, this scenario is confirmed by MACD Oscillator, as its signal line is steadily moving downwards. After the line breaks 0, the downtrend is expected to boost and reach the first target at 1.1130.
In the H1 chart, EURUSD is moving downwards; it has broken 1.1185 to the downside, but may yet return to this level. If the price rebounds from this level, the pair may continue falling and forming the third descending wave towards 1.1130. However, this scenario may be canceled if the price breaks 1.1225 to the upside. From the technical point of view, this scenario is confirmed by Stochastic Oscillator, as its signal is moving below 0 inside the “oversold area”. After the line leaves the area, the instrument may grow to test 1.1185 from below and then resume trading inside the downtrend.
Disclaimer
Any predictions contained herein are based on the authors’ particular opinion. This analysis shall not be treated as trading advice. RoboForex shall not be held liable for the results of the trades arising from relying upon trading recommendations and reviews contained herein.
The week kicks off with a very thin economic calendar, however, the latest developments and escalations in the trade dispute between the US and China can deliver enough potential fuel for volatility.
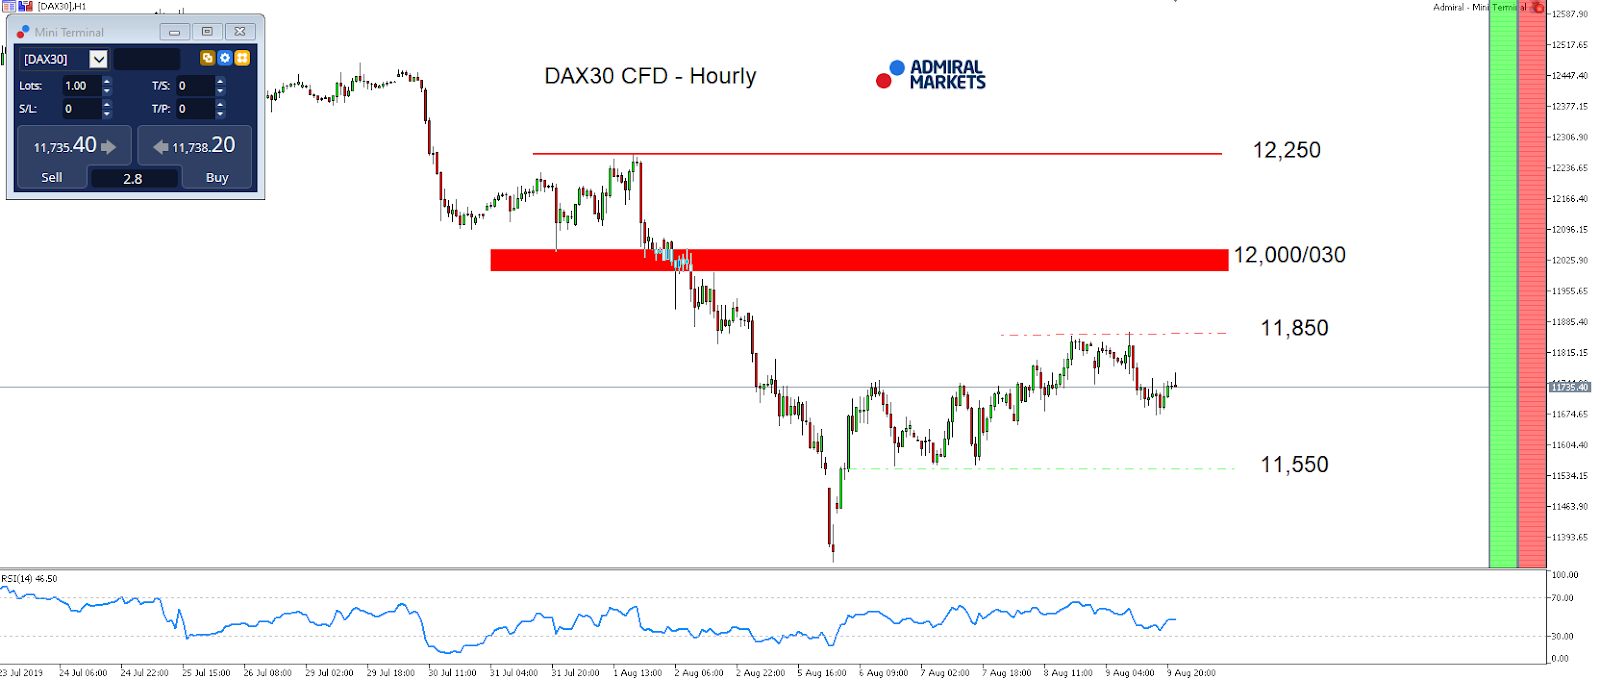
Still, we want to focus on the technical side in the DAX30 CFD. After the German index failed to take on further momentum on the upside into the last weekly close, a line in the sand on the upside holds at around 11,850 points today.
Should a break higher be initiated, further gains up to 12,000/030 points seem likely, even though we consider the technical picture on H1 to favour the short-side as long as we trade below 12,250 points.
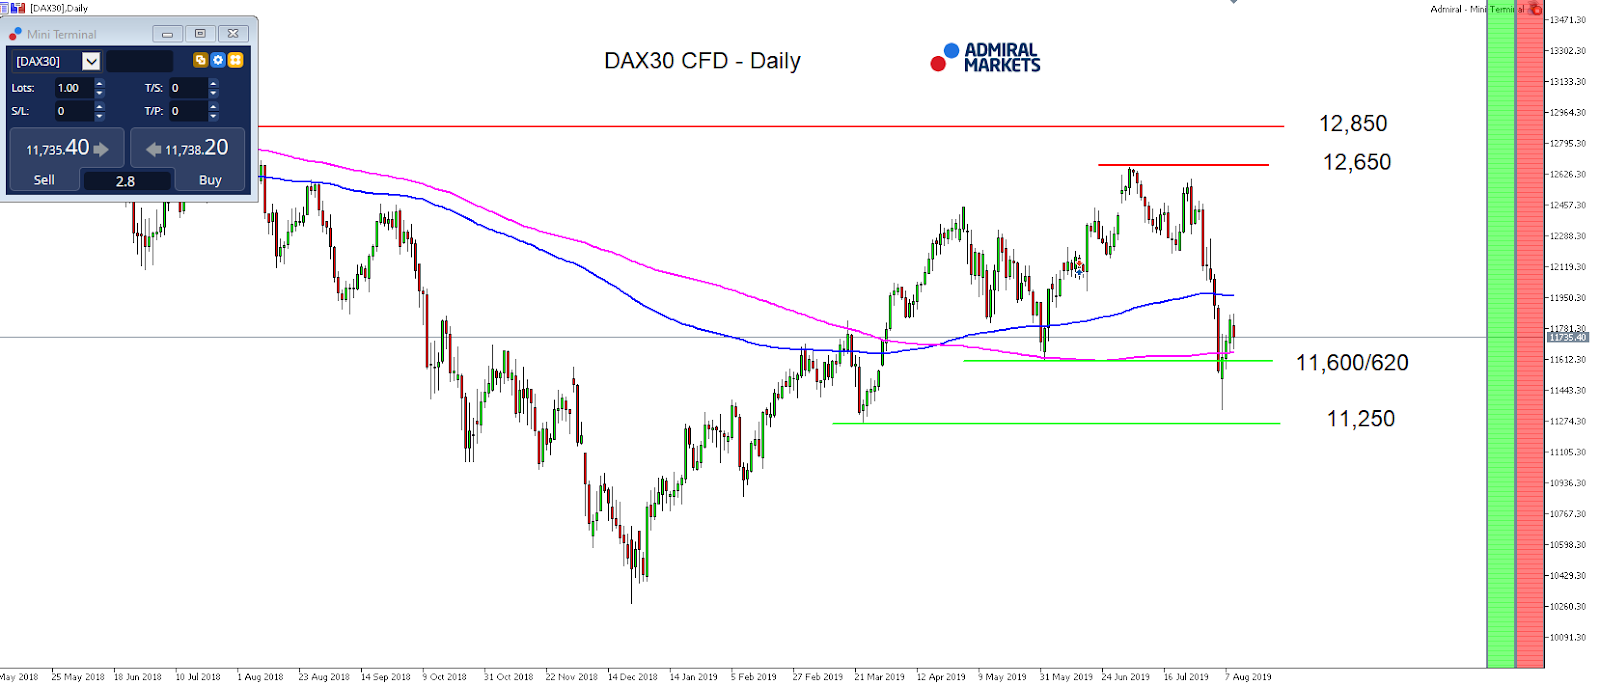
In general, if after taking a breath from last Tuesday onwards, DAX30 CFD bears start to regain control and another stint lower seems a serious option. Here the key level, in our opinion, is around 11,550 points: a break lower leaves the German index vulnerable to a further drop with an initial target around 11,250 points, the region around the March lows:
Source: Admiral Markets MT5 with MT5-SE Add-on DAX30 CFD Hourly chart (between July 23, 2019, to August 9, 2019). Accessed: August 9, 2019, at 10:00pm GMT
Source: Admiral Markets MT5 with MT5-SE Add-on DAX30 CFD daily chart (between May 2, 2018, to August 9, 2019). Accessed: August 9, 2019, at 10:00pm GMT – Please note: Past performance is not a reliable indicator of future results, or future performance.
In 2014, the value of the DAX30 CFD increased by 2.65%, in 2015, it increased by 9.56%, in 2016, it increased by 6.87%, in 2017, it increased by 12.51%, in 2018, it fell by 18.26%, meaning that after five years, it was up by 10.5%.
Discover the world’s #1 multi-asset platform
Admiral Markets offers professional traders the ability to trade with a custom, upgraded version of MetaTrader 5, allowing you to experience trading at a significantly higher, more rewarding level. Experience benefits such as the addition of the Market Heat Map, so you can compare various currency pairs to see which ones might be lucrative investments, access real-time trading data, and so much more. Click the banner below to start your FREE download of MT5 Supreme Edition!
Disclaimer: The given data provides additional information regarding all analysis, estimates, prognosis, forecasts or other similar assessments or information (hereinafter “Analysis”) published on the website of Admiral Markets. Before making any investment decisions please pay close attention to the following:
This is a marketing communication. The analysis is published for informative purposes only and are in no way to be construed as investment advice or recommendation. It has not been prepared in accordance with legal requirements designed to promote the independence of investment research, and that it is not subject to any prohibition on dealing ahead of the dissemination of investment research.
Any investment decision is made by each client alone whereas Admiral Markets shall not be responsible for any loss or damage arising from any such decision, whether or not based on the Analysis.
Each of the Analysis is prepared by an independent analyst (Jens Klatt, Professional Trader and Analyst, hereinafter “Author”) based on the Author’s personal estimations.
To ensure that the interests of the clients would be protected and objectivity of the Analysis would not be damaged Admiral Markets has established relevant internal procedures for prevention and management of conflicts of interest.
Whilst every reasonable effort is taken to ensure that all sources of the Analysis are reliable and that all information is presented, as much as possible, in an understandable, timely, precise and complete manner, Admiral Markets does not guarantee the accuracy or completeness of any information contained within the Analysis. The presented figures refer that refer to any past performance is not a reliable indicator of future results.
The contents of the Analysis should not be construed as an express or implied promise, guarantee or implication by Admiral Markets that the client shall profit from the strategies therein or that losses in connection therewith may or shall be limited.
Any kind of previous or modeled performance of financial instruments indicated within the Publication should not be construed as an express or implied promise, guarantee or implication by Admiral Markets for any future performance. The value of the financial instrument may both increase and decrease and the preservation of the asset value is not guaranteed.
The projections included in the Analysis may be subject to additional fees, taxes or other charges, depending on the subject of the Publication. The price list applicable to the services provided by Admiral Markets is publicly available from the website of Admiral Markets.
Leveraged products (including contracts for difference) are speculative in nature and may result in losses or profit. Before you start trading, you should make sure that you understand all the risks.
EURUSD is still consolidating around 1.1197. Possibly, the pair may grow to reach 1.1222 (an alternative scenario). According to the mains scenario, the price is expected to fall to break 1.1185 and then continue trading downwards with the short-term target at 1.1130.
GBPUSD, “Great Britain Pound vs US Dollar”
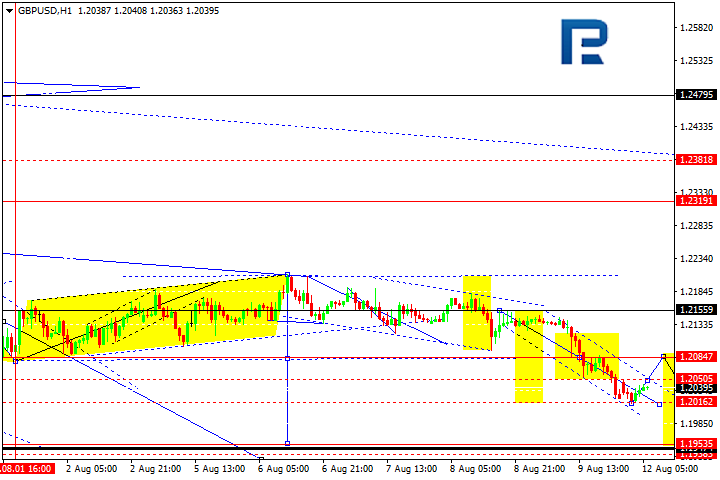
GBPUSD has completed another descending structure at 1.2015. Possibly, today the pair may form one more ascending structure towards 1.2050 and then resume trading downwards with the short-term target at 1.1955.
USDCHF, “US Dollar vs Swiss Franc”
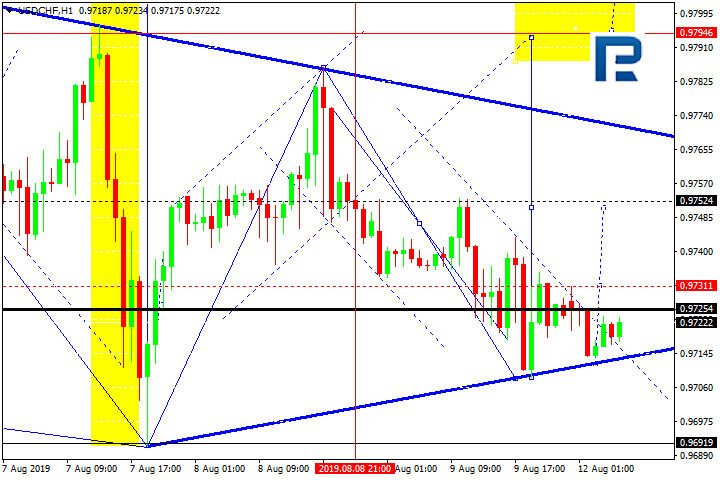
USDCHF is still consolidating. Today, the pair may grow to break 0.9752 and then continue moving upwards with the target at 0.9797.
USDJPY, “US Dollar vs Japanese Yen”
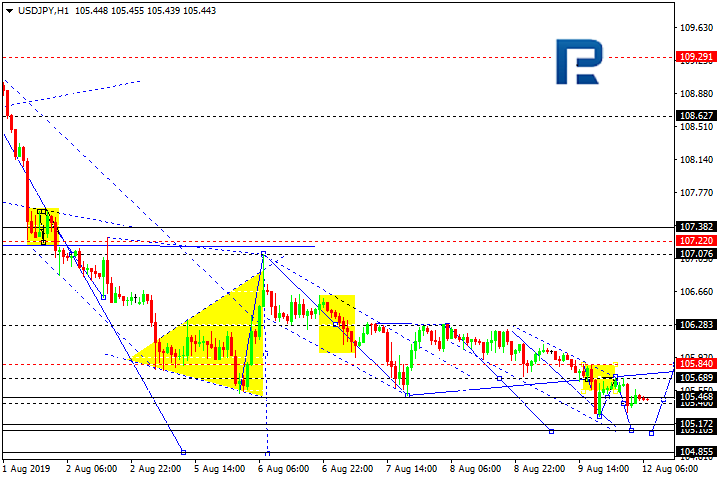
USDJPY is moving downwards. Possibly, the pair may fall to reach 105.10 and then grow towards 105.55. After that, the instrument may start a new decline with the target at 104.85.
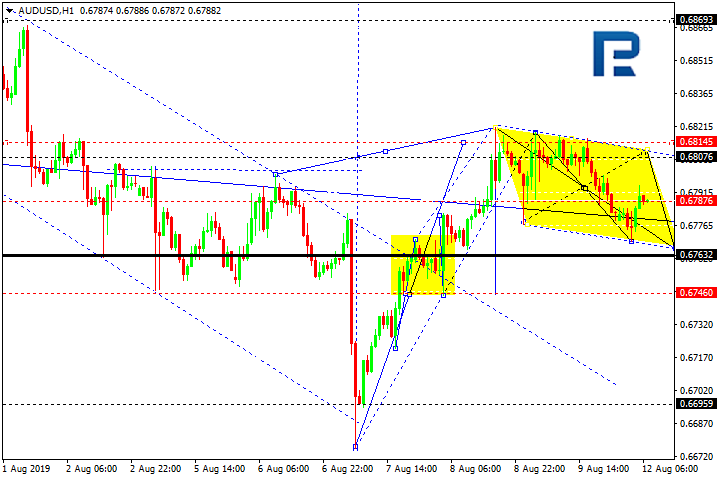
AUDUSD, “Australian Dollar vs US Dollar”
AUDUSD is being corrected and forming Flag pattern. Possibly, today the pair may form a new ascending structure to reach 0.6808 and then start another decline towards 0.6760. After that, the instrument may resume trading upwards with the short-term target at 0.6868.
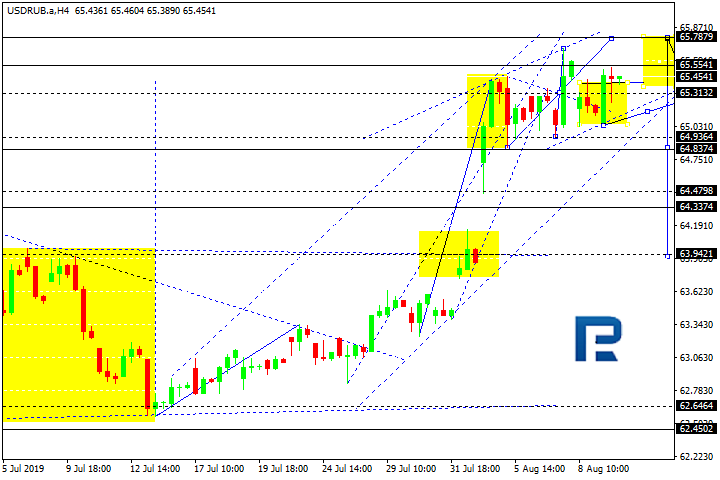
USDRUB, “US Dollar vs Russian Ruble”
USDRUB is still consolidating below 65.30. Possibly, today the pair may grow towards 65.75 and then resume trading downwards with the target at 64.80.
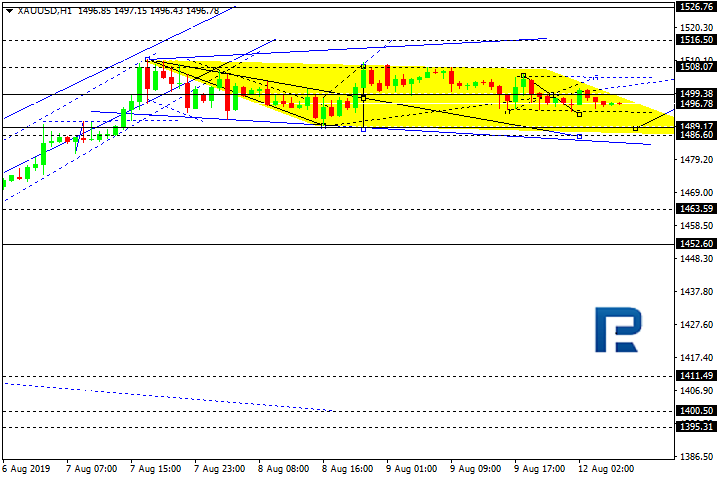
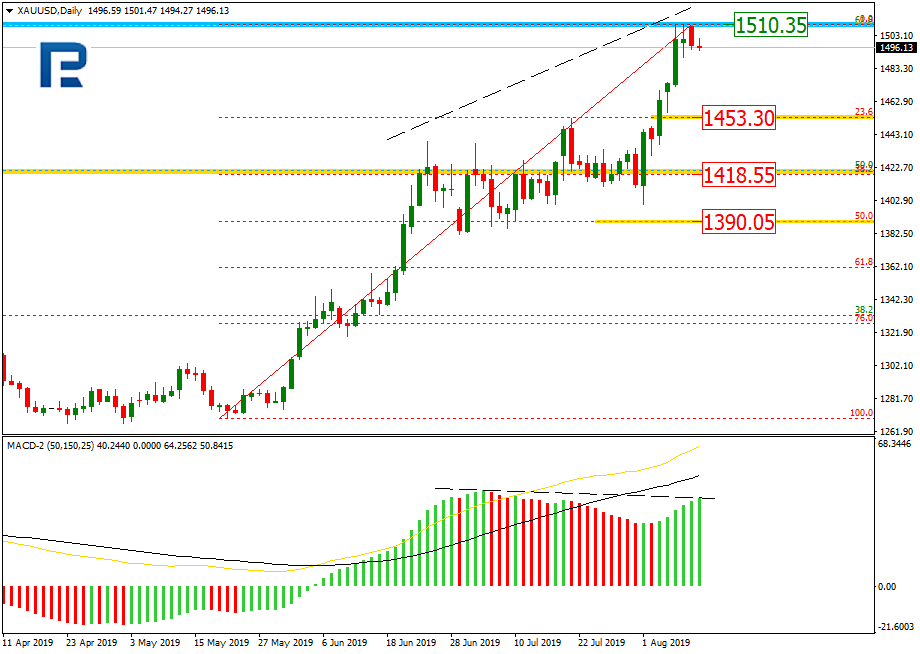
XAUUSD, “Gold vs US Dollar”
Gold is being corrected and forming Flag pattern. Today, the pair may fall to reach 1489.00 and then form one more ascending structure towards 1508.00. Later, the market may start a new decline to reach 1486.60 and then resume trading upwards with the target at 1516.60.
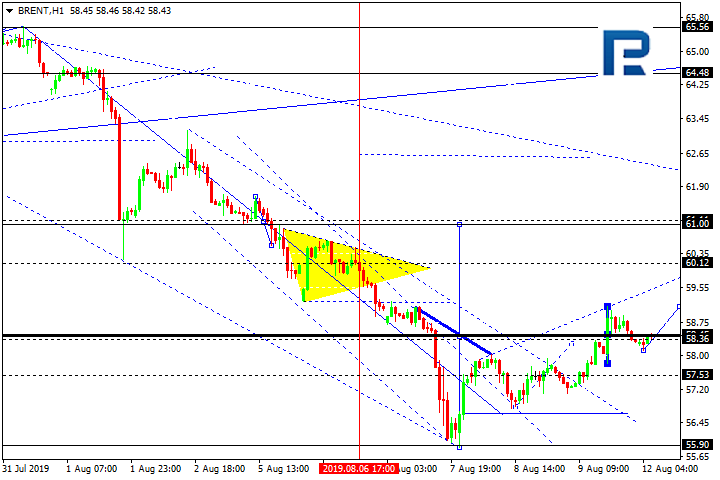
BRENT
Brent is forming the third ascending wave with the target at 60.12. After that, the instrument may be corrected towards 58/40 and then continue trading upwards with the first target at 61.00.
Attention! Forecasts presented in this section only reflect the author’s private opinion and should not be considered as guidance for trading. RoboForex LP bears no responsibility for trading results based on trading recommendations described in these analytical reviews.
As we can see in the daily chart, XAUUSD has completed the strong rising impulse and reached 61.8% fibo. At the same time, there is a divergence on MACD, which may signal a new descending correction. The possible downside targets are 23.6%, 38.2%, and 50.0% fibo at 1453.30, 1418.55, and 1390.05 respectively. The resistance is the high at 1510.35.
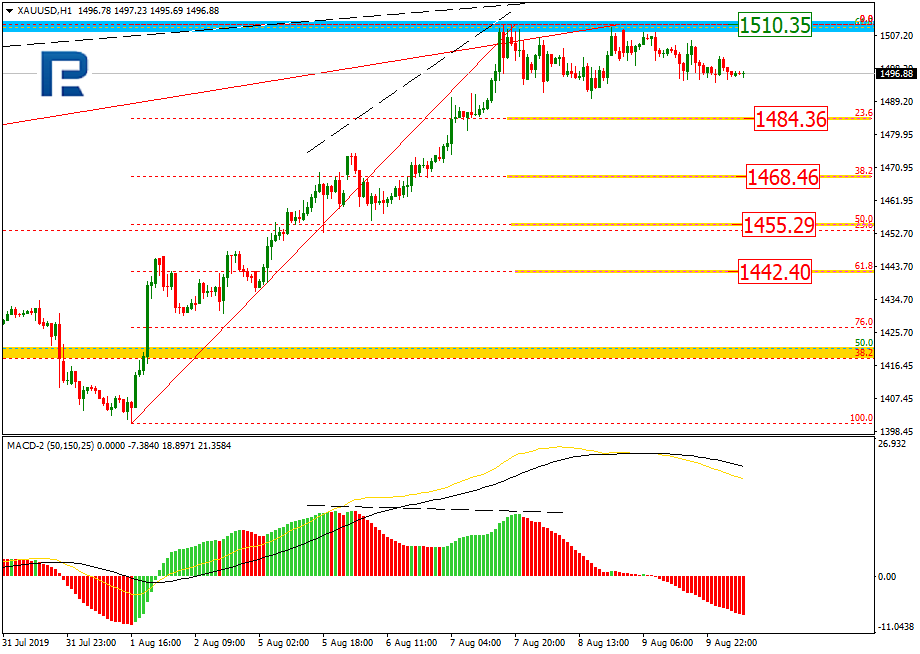
In the H1 chart, the pair is trading inside the sideways channel, which may start a deeper correction. The key targets of this correction may be 23.6%, 38.2%, 50.0%, and 61.8% fibo at 1484.36, 1468.46, 1455.29, and 1442.40 respectively.
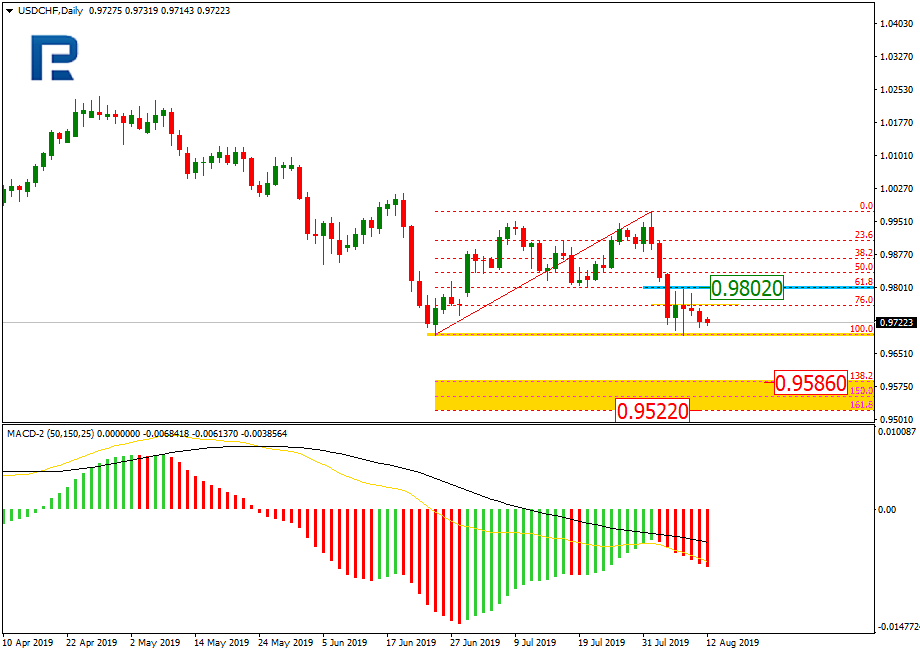
USDCHF, “US Dollar vs Swiss Franc”
As we can see in the daily chart, the descending impulse has stopped near the significant low. However, this slowdown may be considered as a pullback to test the low. The resistance is 61.8% fibo at 0.9802. After breaking the low, the instrument may continue falling towards the post-correctional extension area between 138.2% and 161.8% fibo at 0.9586 and 0.9522 respectively.
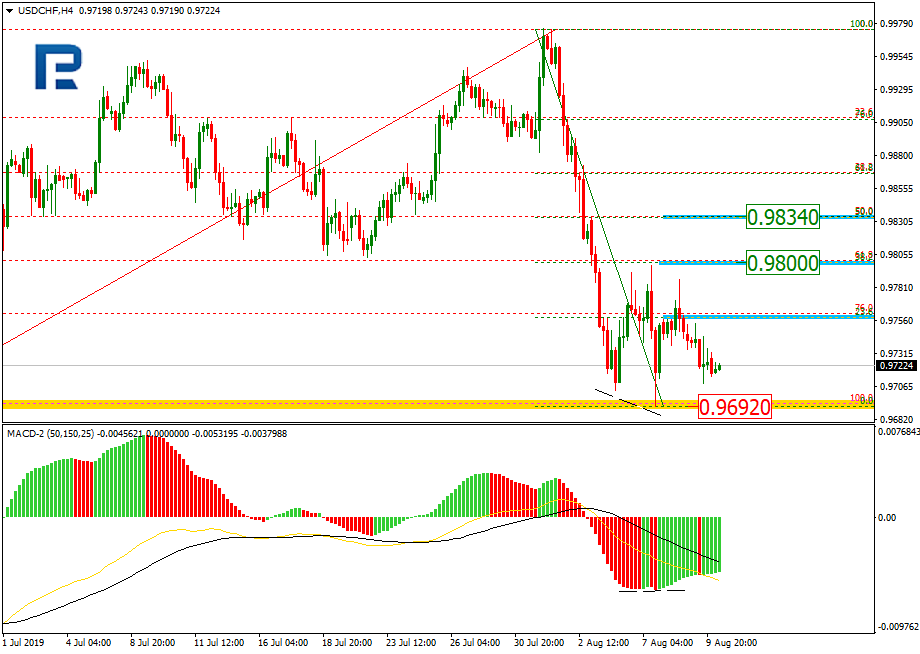
In the H4 chart, the local convergence made the pair start a new pullback, which has already reached 23.6% fibo and may yet continue towards 38.2% and 50.0% fibo at 0.9800 and 0.9834 respectively. The support is the low at 0.9692.
Attention! Forecasts presented in this section only reflect the author’s private opinion and should not be considered as guidance for trading. RoboForex LP bears no responsibility for trading results based on trading recommendations described in these analytical reviews.
Trading on the majors against the US dollar was mixed last week. The Swiss franc made the biggest gains at 0.98%, followed by the yen at 0.84%, and the euro at 0.83%. Moving in the other direction, the pound shed 1.11%, followed by the Kiwi dollar (-1.10%), the Aussie dollar (-0.22%) and the Canadian dollar (-0.10%).
Trading on Friday was mixed. During the course of the day, we saw three rises and three declines. The US dollar dropped slightly against the safe havens and strengthened against the pound. The pound slumped following disappointing UK GDP data, while also experiencing downside pressure over Brexit uncertainty. Markets are preparing for the worst. There is still an appetite for risk due to Trump’s remarks that the trade talks planned in the US for September may not happen.
Day’s news (GMT+3):
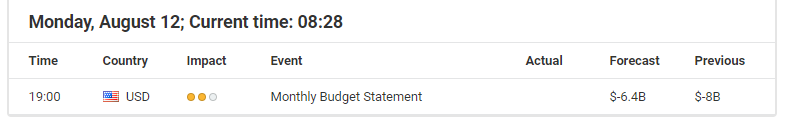
21:00 US: monthly budget statement (Jul).
Current situation:
The appetite for risk is propping the euro up above 1.1177. Within Friday’s sideways trend we got a broadening wedge formation, which is a sign of uncertainty. There’s a support level at 1.1197. Considering that the economic calendar is empty, I think we’ll get a decline to 1.1177 today, and ideally to 1.1155. Moreover, while Trump has been diverting attention away from Italy, talk of snap elections and a change of government could return today.
The EUR/USD currency pair is still in a sideways movement. The technical picture is ambiguous. The trading tool tests local support and resistance levels: 1.11800 and 1.12150, respectively. Participants in financial markets expect additional drivers. EUR/USD can grow further. We recommend that you keep track of the up-to-date information regarding the trade conflict between the United States and China. Positions must be opened from the key levels.
The Economic News Feed for 12.08.2019 is calm.
Indicators do not give accurate signals, 50 MA has crossed 100 MA.
The MACD histogram is close to 0.
The Stochastic Oscillator is in the overbought zone, the %K line has crossed the %D line. There are no signals at the moment.
Trading recommendations
Support levels: 1.11800, 1.11600, 1.11150
Resistance levels: 1.12150, 1.12450, 1.12800
If the price consolidates above 1.12150, expect further growth toward 1.12450-1.12600.
Alternatively, the price could decrease toward 1.11500-1.11400.
The GBP/USD currency pair
Technical indicators of the currency pair:
Prev Open: 1.21285
Open: 1.20428
% chg. over the last day: -0.78
Day’s range: 1.20145 – 1.20497
52 wk range: 1.2080 – 1.3385
GBP/USD went down again. On Friday, the drop in quotes exceeded 100 points. The trading instrument reached the two-year lows. The pressure on GBP was exerted by a number of weak economic releases from the UK. Investors continue to monitor the situation around Brexit. We do not exclude a further decline in the GBP/USD currency pair. Positions must be opened from key levels.
The Economic News Feed for 12.08.2019 is calm.
Indicators point to the strength of sellers: the price has fixed below 50 MA and 100 MA.
The MACD histogram is in the negative zone and above the signal line, which gives a weak signal to sell GBP/USD.
The Stochastic Oscillator is in the neutral zone, the %K line has crossed the %D line. There are no signals at the moment.
Trading recommendations
Support levels: 1.20150, 1.20000
Resistance levels: 1.20550, 1.20900, 1.21300
If the price consolidates below 1.20150, expect a further drop toward 1.20000-1.19600.
Alternatively, the quotes can correct toward 1.20800-1.21000.
The USD/CAD currency pair
Technical indicators of the currency pair:
Prev Open: 1.32258
Open: 1.31986
% chg. over the last day: -0.23
Day’s range: 1.31986 – 1.32282
52 wk range: 1.2727 – 1.3664
An ambiguous technical picture has developed on the USD/CAD currency pair. CAD is consolidating. At the moment, the local support and resistance levels are 1.32000 and 1.32400. Investors expect additional drivers. A trading instrument has the potential to decline further. We recommend paying attention to the dynamics of oil quotes. Positions must be opened from key levels.
The Economic News Feed for 12.08.2019 is calm.
Indicators do not provide accurate signals: 50 MA has crossed 100 MA.
The MACD histogram is in the negative zone but above the signal line, which gives a weak signal to sell USD/CAD.
The Stochastic Oscillator is in the neutral zone, the %K line has crossed the %D line. There are no signals at the moment.
Trading recommendations
Support levels: 1.32000, 1.31800, 1.31250
Resistance levels: 1.32400, 1.32700, 1.33100
If the price consolidates below 1.32000, expect a further descend toward 1.31700-1.31500.
Alternatively, the quotes can grow toward 1.32700-1.33000.
The USD/JPY currency pair
Technical indicators of the currency pair:
Prev Open: 106.074
Open: 105.554
% chg. over the last day: -0.39
Day’s range: 105.311 – 105.691
52 wk range: 104.97 – 114.56
The USD/JPY currency pair is still dominated by a bearish sentiment. A trading instrument is consolidating near annual lows. Currently, local support and resistance levels are: 105,300 and 105,800, respectively. Demand for “safe” assets exists at a high level amid escalation of the trade conflict between the US and China. We recommend that you keep track of current information on this issue. Positions must be opened from the main levels.
Japan’s financial markets are closed due to the holiday.
The price fixed below 50 MA and 100 MA.
The MACD histogram is in the negative zone, which indicates a bearish mood.
The Stochastic Oscillator is in the neutral zone, the %K line crossed the %D line. There are currently no signals.
Trading recommendations
Support levels: 105.300, 105.000
Resistance levels: 105,800, 106,300, 106,650
If the price consolidates below 105.300, expect a further fall toward 105.00-104.800.
Alternatively, the price could recover toward 106.200-106.400.
 Current situation: