Author Archive for InvestMacro – Page 180

Trump escalates trade war into high gear, DAX30 CFD bears in control

By Admiral Markets

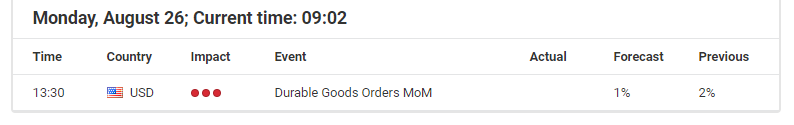
Source: Economic Events August 26, 2019 – Admiral Markets’ Forex Calendar

After the complete escalation in the trade war between the US and China last Friday, the outlook for the DAX30 CFD is clearly bearish.

The initial news that China would retaliate to the latest tariff announcement from US president Trump by slapping 10% tariffs on 75 Billion USD in US imports was responded to by a solid appearance from Jay Powell, as his speech at Jackson Hole stabilised markets and let them recover some losses.

Shortly after, “hell broke loose” when US president Trump asked whether Fed chairman Powell or Chinese prime minister Xi is the bigger enemy of the US, and warned that he plans to retaliate towards China (which he ended up doing after markets closed by announcing new tariffs) and ordering US companies to find an “alternative” to China.

As a result, the DAX30 CFD saw a sharp drop, and attacked the region around 11,550 points going into the weekly close, and should clearly be considered bearish into the start of the week.

A break lower activates 11,250 points as a first target and below 10,800 points.

The technical picture could only brighten with the DAX30 CFD making it back above 11,830/850 points, but this bullish outlook clearly seems to be off the table for the moment:

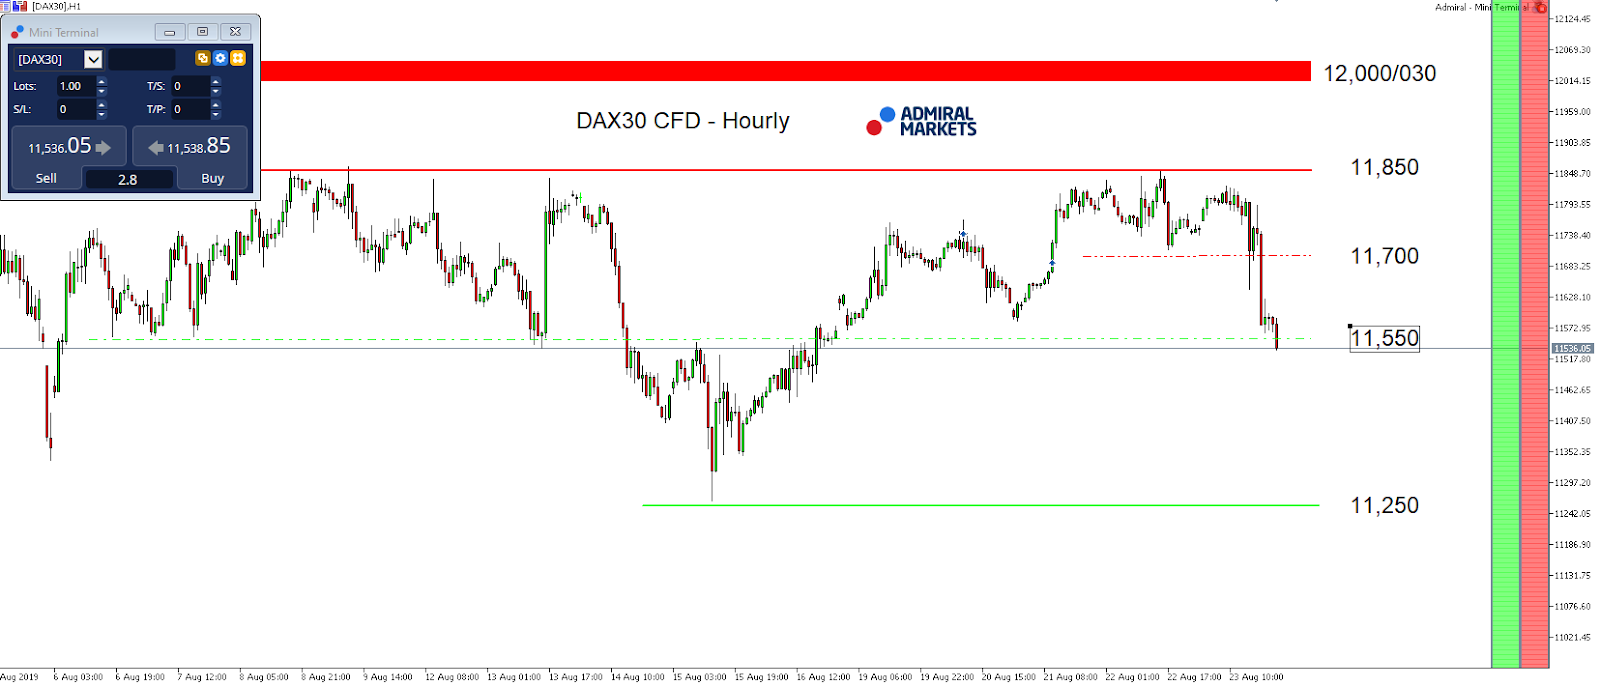
Source: Admiral Markets MT5 with MT5-SE Add-on DAX30 CFD Hourly chart (between August 5, 2019, to August 23, 2019). Accessed: August 22, 2019, at 10:00 PM GMT

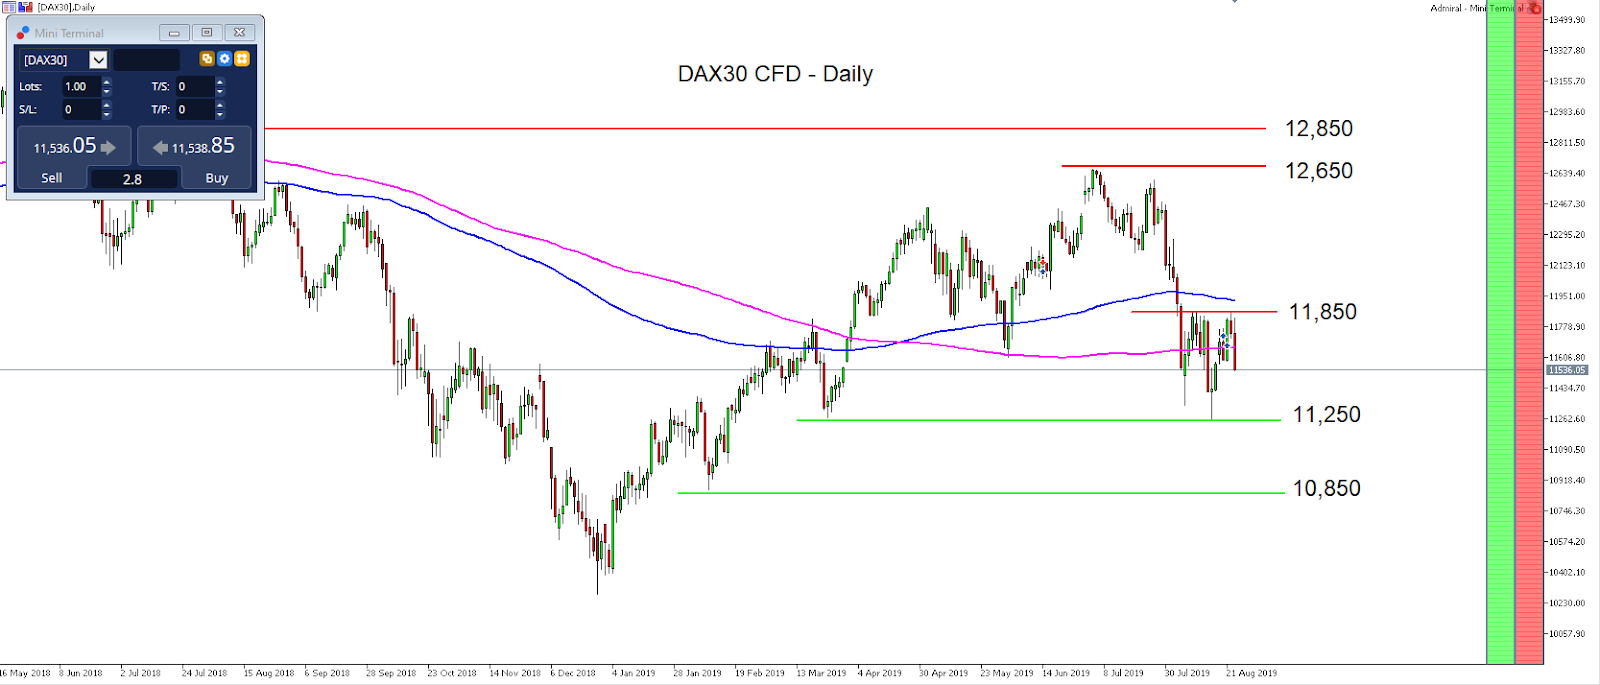
Source: Admiral Markets MT5 with MT5-SE Add-on DAX30 CFD Daily chart (between May 16, 2018, to August 22, 2019). Accessed: August 22, 2019, at 10:00pm GMT – Please note: Past performance is not a reliable indicator of future results, or future performance.

In 2014, the value of the DAX30 CFD increased by 2.65%, in 2015, it increased by 9.56%, in 2016, it increased by 6.87%, in 2017, it increased by 12.51%, in 2018, it fell by 18.26%, meaning that after five years, it was up by 10.5%.

Discover the world’s #1 multi-asset platform

Admiral Markets offers professional traders the ability to trade with a custom, upgraded version of MetaTrader 5, allowing you to experience trading at a significantly higher, more rewarding level. Experience benefits such as the addition of the Market Heat Map, so you can compare various currency pairs to see which ones might be lucrative investments, access real-time trading data, and so much more. Click the banner below to start your FREE download of MT5 Supreme Edition!

Download MetaTrader 5 and begin trading today!

Disclaimer: The given data provides additional information regarding all analysis, estimates, prognosis, forecasts or other similar assessments or information (hereinafter “Analysis”) published on the website of Admiral Markets. Before making any investment decisions please pay close attention to the following:

  1. This is a marketing communication. The analysis is published for informative purposes only and are in no way to be construed as investment advice or recommendation. It has not been prepared in accordance with legal requirements designed to promote the independence of investment research, and that it is not subject to any prohibition on dealing ahead of the dissemination of investment research.
  2. Any investment decision is made by each client alone whereas Admiral Markets shall not be responsible for any loss or damage arising from any such decision, whether or not based on the Analysis.
  3. Each of the Analysis is prepared by an independent analyst (Jens Klatt, Professional Trader and Analyst, hereinafter “Author”) based on the Author’s personal estimations.
  4. To ensure that the interests of the clients would be protected and objectivity of the Analysis would not be damaged Admiral Markets has established relevant internal procedures for prevention and management of conflicts of interest.
  5. Whilst every reasonable effort is taken to ensure that all sources of the Analysis are reliable and that all information is presented, as much as possible, in an understandable, timely, precise and complete manner, Admiral Markets does not guarantee the accuracy or completeness of any information contained within the Analysis. The presented figures refer that refer to any past performance is not a reliable indicator of future results.
  6. The contents of the Analysis should not be construed as an express or implied promise, guarantee or implication by Admiral Markets that the client shall profit from the strategies therein or that losses in connection therewith may or shall be limited.
  7. Any kind of previous or modeled performance of financial instruments indicated within the Publication should not be construed as an express or implied promise, guarantee or implication by Admiral Markets for any future performance. The value of the financial instrument may both increase and decrease and the preservation of the asset value is not guaranteed.
  8. The projections included in the Analysis may be subject to additional fees, taxes or other charges, depending on the subject of the Publication. The price list applicable to the services provided by Admiral Markets is publicly available from the website of Admiral Markets.
  9. Leveraged products (including contracts for difference) are speculative in nature and may result in losses or profit. Before you start trading, you should make sure that you understand all the risks.

By Admiral Markets

EURUSD: safe haven assets open up in the Asian session

By Alpari.com

Previous:

Last week, trading was mixed on the majors against the US dollar. Losing out were the Kiwi dollar (-0.48%), the Aussie dollar (-0.38%), and the Canadian dollar (-0.15%). The biggest gain was made by the pound (+1.16%), followed by the yen (+0.94%), the euro (+0.49%), and the Swiss franc (+0.35%).

On Friday the 23rd of August, trading on the EURUSD pair closed 0.53% up. The price fluctuations on Friday were normal seeing as trading on the pair stayed below the U2 line.

There was a surge in volatility during the US session when Jerome Powell was speaking at the Jackson Hole symposium. It’s unclear, however, whether the dollar slid in response to his comments, or whether it was because of China. It was more likely a reaction to China’s decision to increase tariffs on up to 75bn USD of US imports (from 5% to 10%). The tariffs will come into effect on the 1st of September and will last until the 15th of December.

Meanwhile, at Jackson Hole, Powell said that the Fed’s measures are aimed at stimulating economic growth, which is currently at serious risk. He also noted that economic indicators are close to the regulator’s target levels. Trump once again accused the Federal Reserve of inaction, and labelled the regulator an enemy of the US economy.

Day’s news (GMT+3):

  • 11:00 Germany: IFO – current assessment (Aug), IFO – expectations (Aug).
  • 15:30 US: durable goods orders (Jul), Chicago Fed national activity index (Jul).

Current situation:

On Monday the 26th of August, trading on the safe haven assets opened up. The yuan has hit a new low against the US dollar. On Saturday the 24th of August, Trump announced a 5% increase in tariffs on Chinese goods set to come into effect on the 1st of October.

At the time of writing, the euro is trading at 1.1133. The trade conflict between the US and China is at fever pitch, so the currencies of developing countries are under pressure. The euro has jumped slightly since trading opened as markets digest the weekend’s news and the correction takes place on the safe havens. If the pair holds up above 1.1120, and with a closing price of around 1.1160, we can expect the pair to continue upwards to around 1.1210.

By Alpari.com

Warning for investors: Hopes for a Brexit deal are offset by escalating trade war

By George Prior

A Brexit deal now appears more likely than a U.S.-China trade de-escalation – but global financial markets are still to remain highly volatile in the near term, meaning investors should revise their portfolios.

This is the warning from the CEO and founder of one of the world’s largest independent financial advisory organizations.

Nigel Green comments: “Global financial markets are likely to fall on Monday and remain highly volatile in the near-term on geopolitical headwinds. This means investors should revise their portfolios to safeguard their wealth whilst simultaneously taking advantage of the buying opportunities.”

He continues: “There does seem to be a glimmer of hope of the UK securing a Brexit deal with the EU. This is largely due to fears that a no-deal Brexit will seriously hit EU economies, many of which are already on the brink of a recession, including the largest one – Germany.

“The last thing the EU needs is the UK to crash out in a no-deal scenario, dragging down its own vulnerable economies. As such concessions towards UK Prime Minister Boris Johnson’s approach seems increasingly likely.”

He goes on to say: “However, this chink of light in a major geopolitical issue will be offset by escalating trade tensions between the U.S. and China.

“The increasing trade dispute between the world’s two largest economies is impacting not only their own economies, but also economies across the world.

“And as further tariffs, punitive sanctions on firms and, possibly, currency devaluations are likely, the situation can be expected to create further market turbulence in the near-term.”

In a media statement on Friday, the deVere Group CEO said investors could also capitalize on the current geopolitical climate. He noted: “Investors should embrace some volatility as important buying opportunities.

“Fluctuations can cause panic-selling and mis-pricing. Sought-after stocks can then become cheaper, meaning investors can top up their portfolios and/or take advantage of lower entry points. This all typically results in better returns.

“A good fund manager will help investors seek out the opportunities that turbulence creates and mitigate potential risks as and when they are presented.”

Mr Green concludes: “Investors need to stay invested, carefully monitor the geopolitical factors that drive returns, ensure portfolios are properly diversified and revise their portfolios where necessary in order to sidestep the risks and benefit from the major buying opportunities.”

About:

deVere Group is one of the world’s largest independent advisors of specialist global financial solutions to international, local mass affluent, and high-net-worth clients.  It has a network of more than 70 offices across the world, over 80,000 clients and $12bn under advisement.


S&P 500 Index Must Bounce Here Or Hold On Tight!

By TheTechnicalTraders.com

The fragility of the markets can not be underestimated for investors at this time.  Our research has continued to pick apart these price swings in the US stock markets and our July predictions regarding a market top and an August 19th (or near) breakdown price move have been SPOT ON.  We’ve heard from hundreds of our members and followers regarding our research and predictive analysis work – many thanking us for our dedication to helping traders/investors.  Some people, although, didn’t quite understand the message that we were trying to deliver.

So, in this message, we are going to try to make it very clear for everyone. But first, be sure to opt-in to our free market forecasts newsletter

First, we believe the US and Global markets are setting up for a broad price sell-off/reversion move.  This means we believe the US and Global stock markets could move lower and contract by relatively large percent levels (15% to 25% or more) in the coming months.

Second, we believe this reversion process is related to a number of factors which we’ve highlighted in previous research posts.  The US Presidential Election cycle (2020) is one factor.  The continued US/China trade war is another factor.  The slowing global economy is yet another factor, and the concerns regarding the EU, BREXIT and continuing global economic activity are yet more factors.

Third, every investor should be able to understand we have completed a massive phase in the global markets after the 2008 market crisis that includes the bottoming phase, the revaluation phase, the asset inflation phase, and the asset valuation maturity phase which we are currently in now.  In other words, the past 9+ years has resulted in an incredible recovery process that is very mature at this time and full of overvalued assets throughout the globe.

Lastly, we believe the combination of these factors and the process of moving forward through the normal economic cycles related to a mature global asset valuation phase would result in a fairly common process of a “price reversion” which is an attempt to allow price to explore new lower levels to identify “true value” and for traders/investors to begin a new phase of price inflation.

We’ve been sharing one of our favorite price analysis tools with our followers, the Fibonacci price theory.  This theory suggests that price MUST ALWAYS attempt to seek out new highs and/or new lows – AT ALL TIMES.

Think about that for a minute.  If the price can’t move higher to seek out new highs (because of some fundamental or economic reason or event – like the end of a mature economic price inflation cycle), then what would price attempt to do??  That’s right – it would attempt to move lower and establish some new LOW PRICE level as a process of “revaluing” asset prices.  This new “true value” level would allow the price inflation process to begin as the reversion in price would have washed away the concerns of price maturity/overvalued assets.

Now, as we attempt to move forward with our research, please understand that we believe the large downside price move last Friday is just the beginning of an extended setup and downside rotation that may take place over many months.  Ultimately, we believe the end of September and into early October will be the most volatile for the US and global markets.  Still, we have to deal with what is happening right now – before we get to the end of September and into early October.

If you have not seen our July 13th technical analysis talking about the week of Aug 19th for the stock market and vix be sure to read it now.

The Laymans Technical Trading Chart

The chart below shows a simple visual of what we expect over the next few days based on our technical trading tools and signals. IF you dig into the more detailed version using our ES Fibonacci modeling chart you will understand a lot more goes into this analysis, and there are several support levels we are watching.

Daily ES Fibonacci Modeling Chart

This Daily ES Fibonacci modeling chart highlights the fact that the current Bearish Fibonacci Trigger level, near 2880, has been breached and downside target levels are 2685 and 2700.  Obviously, the support level near the ORANGE MA (2800) is still a critical level for the price before we can consider the 2700 level any type of real target – yet we believe this breakdown move is not over.  We believe support near 2780~2800 will still act as an immediate price floor and that price may stall near this level.   The only exception to that support level would be some news-driven event taking place that pushes the price below that support level on very heavy volume.  So, please understand, our expectation is that 2780 will be price support right now – but that support may be completely blown away on heavy selling based on critical news.

Weekly ES Fibonacci Price Modeling Chart

This Weekly ES Fibonacci Price Modeling chart shows a bigger picture of what we are expecting.  The BLUE Fibonacci target square on this chart (just below 2800) is the current price support level.  Notice how that level aligns with our earlier 2780 to 2800 support level?  You’ll find that many times the Fibonacci price modeling tool is showing very similar analysis across different intervals because it attempts to dissect the core price elements that make up the Fibonacci price structures.  Moving on…

The deeper Bearish Fibonacci Trigger level, near 2580, is critical.  We will not enter a new confirmed Weekly Bearish trend until the price is able to CLOSE BELOW that level.  So, we still have -300 points to move lower before we can potentially CONFIRM a new bearish price trend that could continue to move much lower before finding a bottom.  This happens often in very volatile markets where price MUST move outside of existing price rotation levels to establish a new trend.

In Fibonacci price theory, and the way our Fibonacci price modeling system works, price must move clearly outside and away from existing recent price rotation levels (as the adaptive learning Fibonacci model tracks price) to qualify as a new trend.  In this case, we still have a long way to go before we get true Bearish price confirmation on this Weekly chart.

We urge all traders to follow our research and posts so you have a better understanding of where the markets are within the short term, and long term trends and expectations.  We understand you may not completely grasp some of these advanced tools and price modeling systems we use to analyze the markets and price trends.

Because of this and the fact that these market forecasts are not trading strategies joining our Wealth Building Newsletter for ETFs is the best way to be sure you take advantage of these moves without exposing your portfolio to high volatility and added risks.

We, honestly, don’t expect you to have gained the same level of understanding we have because we have been studying the markets and developing specialized tools based with our combined knowledge of 50+ years experience studying all types of price theories, technical analysis, and trading systems.

This experience and knowledge are what allows us to help you find and execute better trades, which is why our trading portfolio keeps making new all-time high watermarks even during this months market correction.  We do the work, you profit from our ETF trading newsletter signals.

Chris Vermeulen
TheTechnicalTraders.com


Savvy investors will use the U.S.-China trade war to build wealth

By George Prior

China and the U.S. are playing a dangerous game of brinkmanship which will dent global growth, but there will be important opportunities for long-term investors, affirms the CEO of one of the world’s largest independent financial advisory organizations.

Nigel Green, the chief executive of deVere Group, which has $12bn under advisement, is speaking out after Beijing announced on Friday it will impose new tariffs on $75 billion worth of U.S. goods and resume duties on American autos.

The Chinese State Council said it will slap tariffs ranging from 5 to 10 per cent in two batches. The first on 1 September and the second on 15 December.

Mr Green notes: “China and the U.S. are playing a dangerous game of brinkmanship which will inevitably dent global growth at a time when the global economy is headed for a serious downturn.

“Both sides are getting hurt by the ongoing tit-for-tat trade war and given that they’re the world’s two largest economies its negative impact is far-reaching and intensifying. There’s some serious collateral damage.

“It is likely that there will be further retaliations in the form of tariffs, punitive sanctions on each other’s nation’s firms and, possibly, currency devaluations.”

He continues: “The already volatile markets have been rattled again by today’s news.  Investors are getting spooked.

“However, the trade war will likely prove a blip for long-term investors.

“Indeed, investors should embrace some volatility as important buying opportunities.

“Fluctuations can cause panic-selling and mis-pricing. Sought-after stocks can then become cheaper, meaning investors can top up their portfolios and/or take advantage of lower entry points. This all typically results in better returns.

“A good fund manager will help investors seek out the opportunities that turbulence creates and mitigate potential risks as and when they are presented.

The deVere CEO concludes: “Many savvy investors will be using the fall-out of the U.S.-China trade war to generate and build their wealth.”

About:

deVere Group is one of the world’s largest independent advisors of specialist global financial solutions to international, local mass affluent, and high-net-worth clients.  It has a network of more than 70 offices across the world, over 80,000 clients and $12bn under advisement.


The August Stock market Breakdown Prediction and Analysis

By TheTechnicalTraders.com

Our August 19th breakdown prediction aligns with our other analysis tools and predictive modeling systems.  The key to understanding price action lies in two modes of operational aspects for analysts.  Either the analysis is going to be correct and the markets will break down as we have predicted or the analysis will be incorrect and the markets will break higher to rally to new highs.  We call this the “failure to fail” mode or the “failure to succeed” mode of compliance for price.  Either it will do what we expect or it won’t.

There are a few things that we, as analysts, must take into consideration with regards to future predictions of price action and direction.  First, sometimes we fail to make perfect predictions.  It is not easy or 100% guaranteed that our predictions will become valid or accurate on the day we suggest price should move in a certain direction.

We are going to show you the ADL charts that support our predictions and we are going to discuss why we believe the setup is still valid, but we are going to have to let price confirm our prediction and wait for it to move in a direction that either confirms our research or invalidates it.

As many of you know, we use advanced tools to help us understand and predictions regarding future price moves.  Many of our tools align with price cycles, predictive modeling, and other price modeling tools that we use to try to understand where and when the price may turn or continue to trend in a specific direction.

One of our most advanced tools is the Adaptive Dynamic Learning (ADL) predictive modeling tool.  With it, we can ask the ADL tool to show us what price will attempt to do in the future based on a type of DNA candlestick mapping that attempts to isolate the highest probability outcomes.

Weekly NQ Futures Index Chart

Below, we’ve included a Weekly NQ ADL chart that shows you what our ADL predictive modeling system it expecting the NQ price to do over the next 10+ weeks.  You can see from this chart that price is expected to trail lower from current levels and to potentially reach a low point of 6500 by early October 2019.

One other aspect that we must consider is that price can sometimes react 2-5 weeks later than the ADL predictive price levels show.  We call these Price Anomalies.  This is where price sets up an unusual price formation that is actually moving against the ADL predictive price level (in this case, staying higher while the ADL predictive price level moves lower).

We determine these to be price anomalies because, in most cases, the price will eventually break toward the ADL predictive price level in a reversion move.  Therefore, these anomalies can sometimes be very good trading signals as price moves against the ADL predicted trend.

Be sure to opt-in to my free market research newsletter

VIX Weekly Chart

The ADL of the VIX Weekly chart shows a spike in the VIX levels over the next 3 to 7+ weeks.  This spike will likely coincide with a downward price move in the US markets that could begin as early as early September 2019.

The purpose of this ADL VIX Chart is to show you how our ADL modeling system is able to warn us of future price moves and how we can align certain analysis results with other charts to form a larger perspective of the markets in general.

Concluding Thoughts:

As of right now, the August 19th breakdown prediction we shared more than a month ago still stands as the price has yet to rally above 8050 on the NQ to present a new upside price trend.  Our ADL predictive modeling system is still suggesting that the price wants to move lower from current levels and attempt to target the 6500 price level.

Even though the exact August 19th date did not result in a price breakdown event, you must understand we were calling for a breakdown to happen “on or near August 19”.  That means sometime this week or next week most likely – possibly a bit later if the price anomaly of the stock indexes holding up at the upper end of our ADL price range.

If you’ve followed our research long enough you’ll understand that we can make these predictions about the future based on our advanced predictive modeling tools and research – yet we can’t be 100% accurate on the date/time of the event because we don’t have the ability to see that much detail or control what the global markets do in terms of price, trends, global central banks, and other factors.  We can only relate what we see in the markets using our modeling tools and attempt to help you understand what our predictive modeling systems are suggesting.

Right now, a price anomaly where the price is trading above our expected price prediction level appears to be set up which will likely result in a price breakdown in the near future (3 to 10+ days).  Time will tell.  If price rallies because of some external factor and breaks the 8050 highs on the NQ, then we would consider the ADL predictive analysis result to potentially be invalidated because of this new high.  Currently, that is not the case and we are waiting for the breakdown event to begin and will position our money accordingly when price confirms the move.

If you like this big-picture analysis and forecasts be sure to opt-in to my free market research newsletter or let me send you my low-risk index ETF trade signals plus my analysis with my Wealth Building Trading Newsletter.

Chris Vermeulen – TheTechnicalTraders.com


Part III – Is the Fed Too Late Prevent A Housing Market Decline?

By TheTechnicalTraders.com

So, the reality is that based on our modeling system and our research, there are only two ways that the US Fed (and likely the global central banks) can navigate out of this inflation killing debt glut that has sunk the global markets into a quicksand-like economic malaise; either A. reduce debts dramatically across the board (all nations) in an attempt to allow for some level of future growth/inflation opportunity, or B. find a way to push GDP out levels to 2x (or higher) that of current debt levels.  A is much more difficult to negotiate and navigate – but it may be an option sometime in the future.  B is the more likely option with a transition into some type of new 21st-century economic model that assists in advancing the build-it, sell-it model.

In the last, Part II, a section of our research, we showed you a chart of our US Fed modeling system and where we believe the US Fed should be targeting rates currently.  The one thing that was a bit different than our original model, created in 2013, was the election of President Trump and the EU, US/China trade wars.  This could complicate things a bit in the future, but overall the model continues to perform well.

Our research suggests that given current global market factors, we are looking at a very narrow pricing structure for US fed rates that are completely dependent on consumer activities (consumer optimism and activity, perception of the economic opportunities and supply/demand price equilibrium).  Which is why we believe the next 15+ months could be very interesting for global traders and consumers.

We use a simple tool to track the levels and scope of the changing markets in various areas of the US and have noticed a dramatic increase in the numbers of Foreclosures and Pre-Foreclosures in various prime markets over the past 12+ months.  Take a look at some of these maps.

Be sure to opt-in to my free market research newsletter

In each one of these maps, there are more than 500+ current active Foreclosures and/or Pre-Foreclosure listing.  These are prime real estate areas like Los Angeles/Hollywood, CA, New York City, NY, San Francisco, CA, Phoenix, AZ, Chicago, IL and Newark, NJ.  Either the market is changing or the consumer is changing because affordability is sky-high.

The law of supply and demand dictates that when the price gets too high and affordability is beyond the scope of the average buyer, then price MUST fall to levels that support healthy buyers and re-balance the marketplace.  This type of price reversion has happened many times in the past, but this time we believe the US Fed may just let the dust settle and allow these foreclosures to funnel through the traditional channels (banks and financial institutions.

We do believe the US Fed is slightly behind the curve in terms of rate levels and actions.  The Fed waited till 2016 to begin raising rates when our model suggested rates should have been raised in 2013.  Additionally, the Fed raised rates above the 2.25% upper boundary of our modeling system.  The Fed recently began to decrease rates from the 2.5% level which we agree with.  The Fed target should be between 1.5% to 2.0% at this point and levels should fluctuate up and down within this range for the next 4+ years – gradually settling near 1.25% near 2024.

Again, there are only two outcomes that can dramatically alter the path without our modeling system – dramatic debt reduction or dramatic GDP increases.  Possibly, we may see a combination of both of these over the next 10+ years, but our belief is that the US Fed is trapped in a low growth, mild inflationary mode waiting for GDP to increase while attempt to PRAY that no asset bubble pops.  The reality is that bubble will pop and price levels will revert to find “true value” before any real GDP increases begin to take form.

CONCLUDING THOUGHTS:

It’s going to be an interesting 10+ years, folks.  Get ready for some really big price swings in almost all the global markets and various sectors.

Real Estate has already run through the price advance cycle and the price maturity cycle.  There is really only one cycle left to unfold at this point which is the “price revaluation cycle”.  This is where the opportunity lies with select real estate ETFs which we are keeping my eye on to profit from falling real estate prices.

I can tell you that huge moves are starting to folding not only in real estate, but metals, stocks, and currencies. Some of these supercycles are going to last years. Brad Matheny goes into great detail with his simple to understand charts and guide about this. His financial market research is one of a kind and a real eye-opener. PDF guide: 2020 Cycles – The Greatest Opportunity Of Your Lifetime

As a technical analysis and trader since 1997, I have been through a few bull/bear market cycles. I believe I have a good pulse on the market and timing key turning points for both short-term swing trading and long-term investment capital. The opportunities are massive/life-changing if handled properly.

I urge you to visit my ETF Wealth Building Trading Newsletter  and if you like what I offer, join me with the 1 or 2-year subscription to lock in the lowest rate possible, get a FREE BAR OF GOLD and ride my coattails as I navigate these financial market and build wealth while others lose nearly everything they own during the next set of crisis’.

Chris Vermeulen – TheTechnicalTraders.com


Forex Technical Analysis & Forecast 23.08.2019 (EURUSD, GBPUSD, USDCHF, USDJPY, AUDUSD, USDRUB, USDCAD, GOLD, BRENT, BTCUSD)

Article By RoboForex.com

EURUSD, “Euro vs US Dollar”

EURUSD has reached the downside target at 1.1060. Possibly, today the pair consolidate near the lows. If later the price breaks this range to the upside, the market may start a new correction towards 1.1090; if to the downside – continue trading inside the downtrend with the target at 1.1030.

EURUSD
Risk Warning: the result of previous trading operations do not guarantee the same results in the future

GBPUSD, “Great Britain Pound vs US Dollar”

GBPUSD is moving according to an alternative scenario and forming the third correctional wave. Today, the pair may fall to reach 1.2200 and then grow towards 1.2323. Later, the market may start another decline with the target at 1.2174.

GBPUSD
Risk Warning: the result of previous trading operations do not guarantee the same results in the future

USDCHF, “US Dollar vs Swiss Franc”

USDCHF has completed the ascending correction at 0.9850; right now, it is consolidating at the top. If later the price breaks this range to the upside, the market may form one more ascending structure towards 0.9888; if to the downside – start a new correction with the target at 0.9800.

USDCHF
Risk Warning: the result of previous trading operations do not guarantee the same results in the future

USDJPY, “US Dollar vs Japanese Yen”

USDJPY is consolidating above 106.40. According to the main scenario, the price is expected to move upwards to break 106.80. Later, the market may continue growing with the predicted target at 107.07.

USDJPY
Risk Warning: the result of previous trading operations do not guarantee the same results in the future

AUDUSD, “Australian Dollar vs US Dollar”

AUDUSD has returned to 0.6747. Today, the pair may consolidate above this level. If later the price breaks this range to the upside, the market may start a new correction towards 0.6800; if to the downside – continue trading inside the downtrend with the target at 0.6700.

AUDUSD
Risk Warning: the result of previous trading operations do not guarantee the same results in the future

USDRUB, “US Dollar vs Russian Ruble”

USDRUB is consolidating around 65.70. If later the price breaks this range to the downside, the market may fall to break 65.33 and then continue trading inside the downtrend with the target at 64.88.

USDRUB
Risk Warning: the result of previous trading operations do not guarantee the same results in the future

USDCAD, “US Dollar vs Canadian Dollar”

USDCAD has broken 1.3315 upwards. According to the main scenario, the price is expected to trade inside the uptrend to break 1.3350 and then continue growing with the target at 1.3380.

USDCAD
Risk Warning: the result of previous trading operations do not guarantee the same results in the future

XAUUSD, “Gold vs US Dollar”

Gold is moving downwards. Possibly, the pair may reach 1483.40 and then start another growth towards 1493.00. Later, the market may form a new descending structure with the target at 1476.60.

GOLD
Risk Warning: the result of previous trading operations do not guarantee the same results in the future

BRENT

Brent is being corrected. Possibly, the pair may reach 59.41 and then start a new growth to break 61.40. After that, the instrument may continue trading inside the uptrend with the target at 62.50.

BRENT
Risk Warning: the result of previous trading operations do not guarantee the same results in the future

BTCUSD, “Bitcoin vs US Dollar”

BTCUSD has returned to 10140.00. Possibly, today the pair may test 10260.00 from below. According to the main scenario, the price is expected to continue trading downwards with the target at 9935.60. Later, the market may consolidate below this level. If the pair breaks this range to the downside, the instrument may resume trading inside the downtrend to reach 9500.00.

BITCOIN

Article By RoboForex.com

Attention!
Forecasts presented in this section only reflect the author’s private opinion and should not be considered as guidance for trading. RoboForex LP bears no responsibility for trading results based on trading recommendations described in these analytical reviews.

Fibonacci Retracements Analysis 23.08.2019 (BITCOIN, ETHEREUM)

Article By RoboForex.com

BTCUSD, “Bitcoin vs US Dollar”

As we can see in the daily chart, BTCUSD has tested 38.2% fibo again. The previous rising impulse couldn’t continue moving towards the high. The resistance is 23.6% fibo at 11350.00. Judging by MACD, the current decline may continue, that’s why after breaking its local lows, the instrument may fall towards 50.0% and 61.8% fibo at 8600.00 and 7350.00 respectively.

BITCOIN
Risk Warning: the result of previous trading operations do not guarantee the same results in the future

In the H4 chart, highs and lows are getting closer to each other, which means that the pair is consolidating. Possibly, the price may grow to reach 23.6% fibo at 11350.00 again in the nearest future. However, the major tendency remains descending.

BTCUSD
Risk Warning: the result of previous trading operations do not guarantee the same results in the future

ETHUSD, “Ethereum vs. US Dollar”

As we can see in the daily chart, the convergence made the pair start a new pullback, which has quickly reached 61.8% and 76.0% fibo. The resistance is 50.0% fibo at 231.50, which may be the target of the correction. The target of the next impulse may be 76.0% fibo at 163.20).

ETHEREUM
Risk Warning: the result of previous trading operations do not guarantee the same results in the future

In the H4 chart, the instrument is being corrected to the upside; the first correctional wave has already reached 38.2% fibo. The next targets may be 50.0% and 61.8% fibo at 206.70 and 214.35 respectively.

ETHUSD

Article By RoboForex.com

Attention!
Forecasts presented in this section only reflect the author’s private opinion and should not be considered as guidance for trading. RoboForex LP bears no responsibility for trading results based on trading recommendations described in these analytical reviews.

The Analytical Overview of the Main Currency Pairs on 2019.08.23

by JustForex

The EUR/USD currency pair

Technical indicators of the currency pair:
  • Prev Open: 1.10844
  • Open: 1.10799
  • % chg. over the last day: -0.03
  • Day’s range: 1.10608 – 1.10859
  • 52 wk range: 1.1034 – 1.1817

The EUR/USD currency pair is still moving sideways. The technical picture remains ambiguous. Participants in financial markets took a wait-and-see attitude before today’s speech by Fed Chairman Jerome Powell at the Jackson Hole Symposium. The official may provide new information regarding the Central Bank’s monetary policy. Investors will also evaluate statistics on the real estate market in the United States. At the moment, the local support and resistance levels are: 1.10600 and 1.10850, respectively. Positions must be opened from these levels.

The Economic News Feed for 23.08.2019:

  • – speech by the head of the Federal Reserve, Mr. Powell (US) – 17:00 (GMT + 3: 00);
  • – sales of new housing in the United States (US) – 17:00 (GMT+3:00);
EUR/USD

Indicators do not give accurate signals: 50 MA crossed 100 MA.

The MACD histogram is in the negative zone and below the signal line, which gives a strong signal to sell EUR/USD.

The Stochastic Oscillator is in the neutral zone, the %K line is above the %D line, which also indicates bullish sentiment.

Trading recommendations
  • Support levels: 1.10600, 1.10300, 1.10000
  • Resistance levels: 1.10850, 1.11100, 1.11300

If the price consolidates above 1.10850, expect a correction toward 1.11200-1.11400.

Alternatively, the quotes could decrease toward 1.10300-1.10000.

The GBP/USD currency pair

Technical indicators of the currency pair:
  • Prev Open: 1.21233
  • Open: 1.22533
  • % chg. over the last day: +1.02
  • Day’s range: 1.22190 – 1.22618
  • 52 wk range: 1.2015 – 1.3385

Yesterday, aggressive purchases were observed on the GBP/USD currency pair. The quotes grew above 1%. The pound has updated key highs. The trading instrument is currently consolidating. The local support and resistance levels are 1.22150 and 1.22650. GBP can recover further. Today, investors will evaluate the speech of Fed Chairman Jerome Powell at the Jackson Hole Symposium. Positions must be opened from key levels.

The Economic News Feed for 23.08.2019 is calm.

GBP/USD

Indicators point to the strength of buyers: the price has fixed above 50 MA and 100 MA.

The MACD histogram is in the positive zone, but below the signal line, which gives a weak signal to buy GBP/USD.

The Stochastic Oscillator started to go out of the oversold zone, the %K line is above the %D line, which also gives a signal to buy GBP/USD.

Trading recommendations
  • Support levels: 1.22150, 1.21750, 1.21450
  • Resistance levels: 1.22650, 1.23000

If the price consolidates above 1.22650, expect further growth toward 1.23000.

Alternatively, the quotes could decrease toward 1.21800-1.21600.

The USD/CAD currency pair

Technical indicators of the currency pair:
  • Prev Open: 1.32849
  • Open: 1.33025
  • % chg. over the last day: +0.04
  • Day’s range: 1.32926 – 1.33265
  • 52 wk range: 1.2727 – 1.3664

The technical picture on the USD/CAD currency pair is still ambiguous. CAD continues to consolidate. The local support and resistance levels can be distinguished at 1.32900 and 1.33250, respectively. Financial market participants expect important economic releases from Canada. We also recommend that you pay attention to the dynamics of the oil prices. Positions must be opened from key levels.

At 15:30 (GMT+3:00 Canada will publish a report on retail sales.

USD/CAD

Indicators do not give accurate signals, 50 MA crossed 100 MA.

The MACD histogram is in the positive zone, which points to a bullish mood.

The Stochastic Oscillator is in the overbought zone, the %K line crossed the %D line. There are no signals at this time.

Trading recommendations
  • Support levels: 1.32900, 1.32550, 1.32150
  • Resistance levels: 1.33250, 1.33450, 1.33700

If the price consolidates above 1.33250, expect further growth 1.33500-1.33700.

Alternatively, the quotes can drop toward 1.32600-1.32400.

The USD/JPY currency pair

Technical indicators of the currency pair:
  • Prev Open: 106.623
  • Open: 106.428
  • % chg. over the last day: -0.14
  • Day’s range: 106.388 – 106.655
  • 52 wk range: 104.97 – 114.56

The USD/JPY currency pair is still in sideways movement. Unidirectional trends are not observed. The trading instrument continues to test the key support and resistance levels: 106.200 and 106.650, respectively. Today, investors will be focused on the Jackson Hall Symposium. We also recommend keeping track of up-to-date information regarding the US-China trade conflict. Positions must be opened from key levels.

Today, the news background on the Japanese economy is quite calm.

USD/JPY

Indicators do not give accurate signals: 50 MA crossed 100 MA.

The MACD histogram is near the 0 mark.

The Stochastic Oscillator is near the overbought zone, the% K line crossed the% D line. There are no signals at the moment.

Trading recommendations
  • Support levels: 106.200, 105.750, 105.500
  • Resistance levels: 106.650, 107.000

If the price consolidates above 106.650, expect further growth toward 107.000-107.200.

Alternatively, the quotes can drop toward 105.850-105.700.

by JustForex