Author Archive for InvestMacro – Page 179

Ichimoku Cloud Analysis 27.08.2019 (AUDUSD, NZDUSD, USDCAD)

Article By RoboForex.com

AUDUSD, “Australian Dollar vs US Dollar”

AUDUSD is trading at 0.6755; the instrument is moving below Ichimoku Cloud, thus indicating a descending tendency. The markets could indicate that the price may test the cloud’s downside border at 0.6765 and then resume moving downwards to reach 0.6625. Another signal to confirm further descending movement is the price’s rebounding from the descending channel’s upside border. However, the scenario that implies further decline may be canceled if the price breaks the cloud’s upside border and fixes above 0.6810. In this case, the pair may continue growing towards 0.6915.

AUDUSD
Risk Warning: the result of previous trading operations do not guarantee the same results in the future

NZDUSD, “New Zealand Dollar vs US Dollar”

NZDUSD is trading at 0.6367; the instrument is moving below Ichimoku Cloud, thus indicating a descending tendency. The markets could indicate that the price may test the cloud’s upside border at 0.6395 and then resume moving downwards to reach 0.6235. Another signal to confirm further descending movement is the price’s rebounding from the resistance level. However, the scenario that implies further decline may be canceled if the price breaks the cloud’s upside border and fixes above 0.6435. In this case, the pair may continue growing towards 0.6565.

NZDUSD
Risk Warning: the result of previous trading operations do not guarantee the same results in the future

USDCAD, “US Dollar vs Canadian Dollar”

USDCAD is trading at 1.3241; the instrument is moving below Ichimoku Cloud, thus indicating a descending tendency. The markets could indicate that the price may test the cloud’s downside border at 1.3255 and then resume moving downwards to reach 1.3075. Another signal to confirm further descending movement is the price’s rebounding from the rising channel’s downside border. However, the scenario that implies further decline may be canceled if the price breaks the cloud’s upside border and fixes above 1.3350. In this case, the pair may continue growing towards 1.3425.

USDCAD
Risk Warning: the result of previous trading operations do not guarantee the same results in the future

Article By RoboForex.com

Attention!
Forecasts presented in this section only reflect the author’s private opinion and should not be considered as guidance for trading. RoboForex LP bears no responsibility for trading results based on trading recommendations described in these analytical reviews.

Can you lead your life based on trading

Forex is the largest financial market in the world. Every day the number of active traders in the Forex market is rising at an exponential rate. But do you think people are making millions of dollar just by trading the financial instrument? Based on a recent study, we can say more than 95% of the retail traders are losing money. If you intend to lead your dream life based on currency trading business, you must push yourself to the edge and learn the details of this market. Changing your life and becoming a fulltime trader is one of the most difficult tasks in currency trading profession.

Successful people in the Forex market

Who are the successful people in the Forex market? Those who have worked hard and mastered the art of trading by using the demo account, can easily become a successful traders. They know the proper way to embrace the losing trades. The rookie traders often think they can make millions of dollars just by placing trades against the market trend. But without following the trend, you are most likely to blow up the trading account. To become a successful trader, you must consider trading as your business. Work hard so that you know the details of this business. Without pushing yourself to the edge it is almost impossible to become better at trading.

Developing yourself as a professional trader

Learning to trade the market is a very daunting task. You have to develop strong basics on the investment business. Being a rookie trader, you need to find the best Australian fx broker so that you can get free access to their demo account. Smart traders prefer brokers like Rakuten since they care about their clients. Open a demo trading account and see how things work in the market. You might think demo trading is nothing but a waste of money but in reality, this is the only way to develop your trading skills. Think twice before you execute any trade in the Forex market. Demo trade the market just like you would do with your real money.

During the demo trading process, it’s very obvious you will lose many trades. Losing trades are nothing but a part of this trading profession. But this doesn’t mean you will not learn anything new from the losing trades. Losing trades offers you valuable insight about the market condition and helps you to create a perfect trading strategy. Work hard so that you can craft a perfect trading strategy. Think this profession as your business and you will become a successful trader.

Know your needs

To lead your dream life based on currency trading business, you must know your needs. Without having a specific goal it’s nearly impossible to make a profit from this market. Things might sound a little bit challenging at the initial stage but if you learn the basics of this market, you will know why you need to a proper goal. The new traders often set unrealistic goal and want to become a millionaire by using a high leverage trading account. Leverage acts like a double edge sword. Unless you learn to protect your trading capital, it will be nearly impossible to survive in this investment business.

Trade with precision

Trading is an art. You must learn to trade the market with an extreme level of precision. Learn the use of premium tools available in your trading platform so that you can find the best possible trades. Focus on price action trading signals since it will help you trade with tight stops. At times you might not understand why the market is behaving in a wild way. But there is nothing to worry. Take a small break and wait for a stable market condition. You don’t have to execute a trade when the market is unstable. Find the perfect trading condition to lead your dream life.

By Taylor Wilman


The Heiken Ashi candle chart

Heiken Ashi candle has a body, as well as an upper and lower candlewick, making it similar to Japanese Candlesticks. However, they begin from the middle of the bar before it, and not from the level where the previous candle closes. This is the key distinguishing factor between the two charting styles.

Heiken Ashi candlesticks are exceptional charting methods which get attached to your standard price chart on your online trading platform. It resembles a typical Japanese Candlesticks. However, reading the Heiken Ashi candles are quite different from the traditional candlesticks chart.

Using Heiken Ashi

In case your goal is to catch long and persistent trends, then Heiken Ashi is the best chart that you can make use. One of the functions of Heiken Ashi is trend detection. It is a trading style which emphasizes the persistent trends.

Small corrections, as well as consolidations, are usually left behind and they are barely visible on the chart. Whenever directions change on a Heiken Ash graph, the price most likely begins a new move. This is effective in distinguishing between potential and the end of a currency pair trend.

When using the Heiken Ashi chart, it is advisable to use a trailing stop as a management tool in a trending market. Consequently, many traders use a combination of smoothening benefits of the Heiken Ashi chart with a trailing stop indicator to get the most out of a trending market condition.

Another way through which Heiken Ashi is used is by looking for chart patterns and for applying price action rules. Most of the time, this works in the same way just like the traditional Japanese candlesticks. However, Heiken Ashi chart pattern breakouts are sometimes more dependable than the traditional candlesticks charts.

Heiken Ashi Trends

By making use of the Heiken Ashi Trends, you are in a position of confidently distinguishing strong trends from unsustainable price actions.

Bullish Heiken Ashi Trend

The bullish Heiken Ashi trend is similar to the normal Japanese candlestick trend. They are built primarily by bullish candles and does not have lower candlesticks. Whenever there is a rise in the price, the price action creates very little or no lower shadows.

The Bearish Heiken Ashi Trend

The bearish Heiken Ashi trend has similar functions to the bullish one, though in the opposite direction. This implies that it is created by bearish candles. It is also worth noting that a strong bearish trend on the Heiken Ashi trend has little or no upper candle shadows.

Trading with Heiken Ashi

Heiken Ashi trading is very powerful when used in combination with price action analysis. When using them, look for support and resistance levels and vital swing points. It is also advisable to bear in mind that these could result in future turning points on the chart. The chart and candle patterns are always considered for the opening and closing trades.

Before entering a trade, ensure to make use of the stop loss which has conformed to a level. Always replace the regular stop with a trailing stop order whenever the price moves in your favor. Additionally, you need to hold your trades until the price action gives you clues to a potential trend reversal.

An important thing that you need to consider is that if the Heiken Ashi price action creates a relatively large candle, then it is the right time to exit the position.

Conclusion

Heiken Ashi is effective in assisting a trader to get hold of bigger trends than the small price move. The candles also lay a lot of emphasis on persistent tendencies than small fluctuations. Additionally, because Heiken Ashi naked trends, they can easily be pursued with a Trailing Stop order. Heiken Ashi candlesticks offer chartists with versatile tools which can filter noise, foreshadow reversal as well as identity classic chart patterns.

By Taylor Wilman


Japanese Candlesticks Analysis 27.08.2019 (USDCAD, AUDUSD)

Article By RoboForex.com

USDCAD, “US Dollar vs Canadian Dollar”

As we can see in the H4 chart, after breaking the channel’s downside border, USDCAD has formed Hammer reversal pattern. Right now, the pair is trying to reverse. At the moment, it may be assumed that the price may rebound from the level and go back to 1.3322. However, we shouldn’t ignore a possibility that the instrument may rebound from the support line and continue its decline to reach 1.3210.

USDCAD
Risk Warning: the result of previous trading operations do not guarantee the same results in the future

AUDUSD, “Australian Dollar vs US Dollar”

As we can see in the H4 chart, the pair has broken the descending channel; it is trading sideways and may start a new rising tendency, By now, AUDUSD has completed Hammer pattern close to the support level and is trying to reverse. Judging by the previous movements, we may assume that after a slight correction the price trade towards 0.6868 to start forming a new ascending channel. However, we shouldn’t ignore a possibility that the instrument may continue falling to reach 0.6700.

AUDUSD

Article By RoboForex.com

Attention!
Forecasts presented in this section only reflect the author’s private opinion and should not be considered as guidance for trading. RoboForex LP bears no responsibility for trading results based on trading recommendations described in these analytical reviews.

The US Currency Is in the Positive Zone After Statements by Donald Trump

by JustForex

The US dollar strengthened against a basket of major currencies after statements by Donald Trump. The US President said that over the weekend, two phone calls came in from China offering to continue trade negotiations with the countries. D. Trump showed respect for China’s Chairman, Xi Jinping, for his ability to “calm resolution.” “So impressed that they are willing to come out & state the facts so accurately. This is why he is a great leader & representing a great country. Talks are continuing!” Trump wrote on Twitter. The US dollar index (#DX) closed the trading session in the positive zone (+0.47%).

Meanwhile, mixed economic data from the US were published yesterday. So, core durable goods orders decreased by 0.4% in July, while experts expected growth by 0.1%. Moreover, the volume of durable goods orders grew by 2.1% in July instead of 1.1%.

Also, weak economic data from Germany were published yesterday. German IFO business climate index counted to only 94.3 in August instead of 95.1. Today, investors expect the publication of German GDP data.

The “black gold” prices have been growing. Currently, futures for the WTI crude oil are testing the $54.00 mark per barrel. At 23:30 (GMT+3:00), API weekly crude stock will be published.

Market Indicators

Yesterday, the bullish sentiment was observed in the US stock markets: #SPY (+1.11%), #DIA (+1.10%), #QQQ (+1.51%).

The 10-year US government bonds yield has fallen again. At the moment, the indicator is at the level of 1.51-1.52%.

The News Feed on 2019.08.27:

– German GDP data at 09:00 (GMT+3:00);
– CB consumer confidence index in the US at 17:00 (GMT+3:00).

by JustForex

Introduction to Artificial Neural Networks in Python

By Padmaja Bhagwat, Kite.com

The Python implementation presented may be found in the Kite repository on Github.

Biology inspires the Artificial Neural Network

The Artificial Neural Network (ANN) is an attempt at modeling the information processing capabilities of the biological nervous system. The human body is made up of trillions of cells, and the nervous system cells – called neurons – are specialized to carry “messages” through an electrochemical process. The nodes in ANN are equivalent to those of our neurons, whose nodes are connected to each other by Synaptic Weights (or simply weights)  – equivalent to the synaptic connections between axons and dendrites of the biological neuron.

Let’s think of a scenario where you’re teaching a toddler how to identify different kinds of animals. You know that they can’t simply identify any animal using basic characteristics like a color range and a pattern: just because an animal is within a range of colors and has black vertical stripes and a slightly elliptical shape doesn’t automatically make it a tiger.

Instead, you should show them many different pictures, and then teach the toddler to identify those features in the picture on their own, hopefully without much of a conscious effort. This specific ability of the human brain to identify features and memorize associations is what inspired the emergence of ANNs.

What is an Artificial Neural Network?

In simple terms, an artificial neural network is a set of connected input and output units in which each connection has an associated weight. During the learning phase, the network learns by adjusting the weights in order to be able to predict the correct class label of the input tuples. Neural network learning is also referred to as connectionist learning, referencing the connections between the nodes. In order to fully understand how the artificial neural networks work, let’s first look at some early design approaches.

What can an Artificial Neural Network do?

Today, instead of designing a standardized solutions to general problems, we focus on providing a personalized, customized solution to specific situations. For instance, when you log in to any e-commerce website, it’ll provide you with personalized product recommendations based on your previous purchase, items on your wishlist, most frequently clicked items, and so on.

The platform is essentially analyzing the user’s behavior pattern and then recommending the solution accordingly; solutions like these can be effectively designed using Artificial Neural Networks.

ANNs have been successfully applied in wide range of domains such as:

  • Classification of data – Is this flower a rose or tulip?
  • Anomaly detection – Is the particular user activity on the website a potential fraudulent behavior?
  • Speech recognition – Hey Siri! Can you tell me a joke?
  • Audio generation – Jukedeck, can you compose an uplifting folk song?
  • Time series analysis – Is it good time to start investing in stock market?

And the list goes on…

Early model of ANN

The McCulloch-Pitts model of Neuron (1943 model)

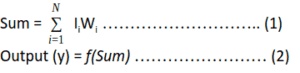
This model is made up of a basic unit called Neuron. The main feature of their Neuron model is that a weighted sum of input signals is compared against a threshold to determine the neuron output. When the sum is greater than or equal to the threshold, the output is 1. When the sum is less than the threshold, the output is 0.  It can be put into the equations as such:

McCulloch-Pitts Model of Neuron

This function f which is also referred to as an activation function or transfer function is depicted in the figure below, where T stands for the threshold.

The figure below depicts the overall McCulloch-Pitts Model of Neuron.

Let’s start by designing the simplest Artificial Neural Network that can mimic the basic logic gates. On the left side, you can see the mathematical implementation of a basic logic gate, and on the right-side, the same logic is implemented by allocating appropriate weights to the neural network.

If you give the first set of inputs to the network i.e. (0, 0) it gets multiplied by the weights of the network to get the sum as follows: (0*1) + (0*1) = 0 (refer eq. 1). Here, the sum, 0, is less than the threshold, 0.5, hence the output will be 0 (refer eq. 2).

Whereas, for the second set of inputs (1,0), the sum (1*1) + (0*1) = 1 is greater than the threshold, 0.5, hence the output will be 1.

Similarly, you can try any different combination of weights and thresholds to design the neural network depicting AND gate and NOT gate as shown below.

This way, the McCulloch-Pitts model demonstrates that networks of these neurons could, in principle, compute any arithmetic or logical function.

Perceptron model

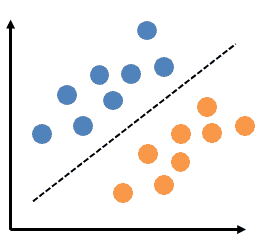
This is the simplest type of neural network that helps with linear (or binary) classifications of data. The figure below shows the linearly separable data.

perceptron model artificial neural networks

The learning rule for training the neural network was first introduced with this model. In addition to the variable weight values, the perceptron added an extra input that represents bias. Thus, the equation 1 was modified as follows:

artificial neural networks equation

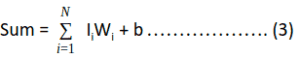
Bias is used to adjust the output of the neuron along with the weighted sum of the inputs. It’s just like the intercept added in a linear equation.

Multilayer perceptron model

A perceptron that as a single layer of weights can only help in linear or binary data classifications. What if the input data is not linearly separable, as shown in figure below?

Multilayer perceptron model

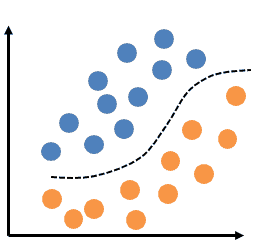
This is when we use a multilayer perceptron with a non-linear activation function such as sigmoid.

Multilayer perceptron has three main components:

  • Input layer: This layer accepts the input features. Note that this layer does not perform any computation – it just passes on the input data (features) to the hidden layer.
  • Hidden layer: This layer performs all sorts of computations on the input features and transfers the result to the output layer. There can be one or more hidden layers.
  • Output layer: This layer is responsible for producing the final result of the model.

Now that we’ve discussed the basic architecture of a neural network, let’s understand how these networks are trained.

Training phase of a neural network

Training a neural network is quite similar to teaching a toddler how to walk. In the beginning, when she is first trying to learn, she’ll naturally make mistakes as she learns to stand on her feet and walk gracefully.

Similarly, in the initial phase of training, neural networks tend to make a lot of mistakes. Initially, the predicted output could be stunningly different from the expected output. This difference in predicted and expected outputs is termed as an ‘error’.

The entire goal of training a neural network is to minimize this error by adjusting its weights.

This training process consists of three (broad) steps:

1. Initialize the weights

The weights in the network are initialized to small random numbers (e.g., ranging from -1 to 1, or -0.5 to 0.5). Each unit has a bias associated with it, and the biases are similarly initialized to small random numbers.

def initialize_weights():
    # Generate random numbers
    random.seed(1)

    # Assign random weights to a 3 x 1 matrix
    synaptic_weights = random.uniform(low=-1, high=1, size=(3, 1))
    return synaptic_weights

2. Propagate the input forward

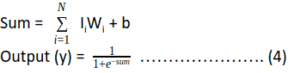
In this step, the weighted sum of input values is calculated, and the result is passed to an activation function – say, a sigmoid activation function – which squeezes the sum value to a particular range (in this case, between 0 to 1), further adding bias with it. This decides whether a neuron should be activated or not.

artificial neural networks

Our sigmoid utility functions are defined like so:

def sigmoid(x):
    return 1 / (1 + exp(-x))


def sigmoid_derivative(x):
    return x * (1 - x)

3.  Backpropagate the error

In this step, we first calculate the error, i.e., the difference between our predicted output and expected output. Further, the weights of the network are adjusted in such a way that during the next pass, the predicted output is much closer to the expected output, thereby reducing the error.

For neuron j (also referred to as unit j) of the output layer, the error is computed as follows:

Errj = Oj*(1 – Oj )*( Tj – Oj ) ……………….. (5)

Where Tjis the expected output, Ojis the predicted output and Oj *(1 – Oj) is the derivative of sigmoid function.

The weights and biases are updated to reflect the back propagated error.

Wij = Wij + (l*Errij*Oj ) ………………………. (6)
bi = bj + (l* Errij) ……………………………….  (7)

Above, l is the learning rate, a constant typically varying between 0 to 1. It decides the rate at which the value of weights and bias should vary. If the learning rate is high, then the weights and bias will vary drastically with each epoch. If it’s too low, then the change will be very slow.

We terminate the training process when our model’s predicted output is almost same as the expected output. Steps 2 and 3 are repeated until one of the following terminating conditions is met:

  • The error is minimized to the least possible value
  • The training has gone through the maximum number of iterations
  • There is no further reduction in error value
  • The training error is almost same as that of validation error

So, let’s create a simple interface that allows us to run the training process:

def learn(inputs, synaptic_weights, bias):
     return sigmoid(dot(inputs, synaptic_weights) + bias)

def train(inputs, expected_output, synaptic_weights, bias, learning_rate, training_iterations):
     for epoch in range(training_iterations):
          # Forward pass -- Pass the training set through the network.
          predicted_output = learn(inputs, synaptic_weights, bias)

        # Backaward pass
        # Calculate the error
        error = sigmoid_derivative(predicted_output) * (expected_output - predicted_output)

        # Adjust the weights and bias by a factor
        weight_factor = dot(inputs.T, error) * learning_rate
        bias_factor = error * learning_rate

        # Update the synaptic weights
        synaptic_weights += weight_factor

        # Update the bias
        bias += bias_factor

        if ((epoch % 1000) == 0):
            print("Epoch", epoch)
            print("Predicted Output = ", predicted_output.T)
            print("Expected Output = ", expected_output.T)
            print()
    return synaptic_weights

Bringing it all together

Finally, we can train the network and see the results using the simple interface created above. You’ll find the complete code in the Kite repository.

# Initialize random weights for the network
    synaptic_weights = initialize_weights()

    # The training set
    inputs = array([[0, 1, 1],
                    [1, 0, 0],
                    [1, 0, 1]])

    # Target set
    expected_output = array([[1, 0, 1]]).T

    # Test set
    test = array([1, 0, 1])

    # Train the neural network
    trained_weights = train(inputs, expected_output, synaptic_weights, bias=0.001, learning_rate=0.98,
                            training_iterations=1000000)

    # Test the neural network with a test example
    accuracy = (learn(test, trained_weights, bias=0.01)) * 100

    print("accuracy =", accuracy[0], "%")

Conclusion

You now have seen a sneak peek into Artificial Neural Networks! Although the mathematics behind training a neural network might have seemed a little intimidating at the beginning, you can now see how easy it is to implement them using Python.

In this post, we’ve learned some of the fundamental correlations between the logic gates and the basic neural network. We’ve also looked into the Perceptron model and the different components of a multilayer perceptron.

In my upcoming post, I’m going to talk about different types of artificial neural networks and how they can be used in your day-to-day applications. Python is well known for its rich set of libraries like Keras, Scikit-learn, and Pandas to name a few – which abstracts out the intricacies involved in data manipulation, model building, training the model, etc. We shall be seeing how to use these libraries to build some of the cool applications. This post is an introduction to some of the basic concepts involved in building these models before we dive into using libraries.

Try it yourself

The best way of learning is by trying it out on your own, so here are some questions you can try answering using the concepts we learned in this post:

  1. Can you build an XOR model by tweaking the weights and thresholds?
  2. Try adding more than one hidden layer to the neural network, and see how the training phase changes.

See you in the next post!

About the Author:

This article originally appeared on Kite.com.

(Reprinted with permission)


EURUSD: bulls trying to recover yesterday’s losses

By Alpari.com

Previous:

On Monday the 26th of August, trading on the euro closed down. The single currency underwent a correction following Friday’s rally, when it rose in response to China’s decision to increase tariffs on US goods. On Monday, the bulls hit a high of 1.1164 after Trump’s decision to increase tariffs on Chinese goods. While the two sides traded blows, China’s Vice Premier Liu He said that China is willing to continue negotiations to resolve the trade dispute.

The safe haven assets went into decline. The US dollar index has corrected following a drop. Markets expect the US and China to keep trying to reach a trade deal. The EURUSD pair slumped to 1.1094.

Day’s news (GMT+3):

  • 09:00 Germany: GDP (Q2).
  • 11:30 UK: BBA mortgage approvals (Jul).
  • 15:00 Eurozone: ECB’s De Guindos speech.
  • 16:00 US: S&P/Case-Shiller home price indices (Jun).
  • 17:00 US: consumer confidence, Richmond Fed manufacturing index (Aug).
  • 23:30 US: API weekly crude oil stock (23 Aug).

EURUSD H1Current account:

The pair has dropped below the balance line. This is a bad sign for the bulls. Considering that the stochastic oscillator is looking down, it’s expected that the pair will rebound from the 67th degree at 1.1085. Trump keeps adding uncertainty on the financial markets, so prepare yourselves for tweets directed at China and Iran. Since the pair is currently in the middle of Friday’s range, it seems more likely that the euro is heading upwards against the dollar. A breakout to the upside of the downwards channel will open the road towards 1.1150.

By Alpari.com

Forex Technical Analysis & Forecast 26.08.2019 (EURUSD, GBPUSD, USDCHF, USDJPY, AUDUSD, USDRUB, USDCAD, GOLD, BRENT, BTCUSD)

Article By RoboForex.com

EURUSD, “Euro vs US Dollar”

After forming another consolidation range close to the lows and breaking it to the upside, EURUSD has almost completed the correction towards the center of this descending wave. Possibly, the pair may form a new consolidation range above 1.1132. If later the price breaks this range to the downside, the instrument may resume trading inside the downtrend with the first target at 1.1100.

EURUSD
Risk Warning: the result of previous trading operations do not guarantee the same results in the future

GBPUSD, “Great Britain Pound vs US Dollar”

GBPUSD has reached the short-term target of the third ascending wave at 1.2284. Today, the pair may be corrected towards 1.2205 and then form one more ascending structure with the predicted target at 1.2323.

GBPUSD
Risk Warning: the result of previous trading operations do not guarantee the same results in the future

USDCHF, “US Dollar vs Swiss Franc”

After forming another consolidation range above 0.9835 and breaking to the downside, USDCHF has completed the descending correction at 0.9720. Today, the pair may form a new consolidation range near the current lows. Later, the market may break 0.9777 upwards and start another growth with the first target at 0.9815.

USDCHF
Risk Warning: the result of previous trading operations do not guarantee the same results in the future

USDJPY, “US Dollar vs Japanese Yen”

USDJPY has finished another descending structure; right now, it is moving downwards to reach 106.04. After that, the instrument may start a new correction towards 105.60 and then resume trading upwards with the target at 106.70.

USDJPY
Risk Warning: the result of previous trading operations do not guarantee the same results in the future

AUDUSD, “Australian Dollar vs US Dollar”

After breaking 0.6735 downwards and expanding the range to the downside, AUDUSD has finished the ascending impulse and returned to the above-mentioned level. According to the main scenario, the price is expected to consolidate below 0.6740. Later, the market may break this range upwards and continue trading inside the uptrend with the target at 0.6800.

AUDUSD
Risk Warning: the result of previous trading operations do not guarantee the same results in the future

USDRUB, “US Dollar vs Russian Ruble”

USDRUB is being corrected towards 66.15. After that, the instrument may form a new descending structure with the predicted target at 65.20.

USDRUB
Risk Warning: the result of previous trading operations do not guarantee the same results in the future

USDCAD, “US Dollar vs Canadian Dollar”

USDCAD is consolidating around 1.3300. Possibly, the pair may grow to break 1.3319 and then continue trading inside the uptrend with the predicted target at 1.3355.

USDCAD
Risk Warning: the result of previous trading operations do not guarantee the same results in the future

XAUUSD, “Gold vs US Dollar”

There was a gap at the beginning of today’s trading session, which helped Gold to reach 1550.50 and complete this growth. Possibly, today the pair may consolidate near the current highs. Later, the market may break 1535.00 and resume trading downwards with the first target at 1510.00.

GOLD
Risk Warning: the result of previous trading operations do not guarantee the same results in the future

BRENT

Brent is consolidating near the lows. According to the main scenario, the price is expected to break 59.20 upwards and reach the first target at 59.90. However, the pair may choose an alternative scenario to fall to form a new descending structure to reach 57.60 first and then start another towards the above-mentioned target.

BRENT
Risk Warning: the result of previous trading operations do not guarantee the same results in the future

BTCUSD, “Bitcoin vs US Dollar”

BTCUSD is forming a wide consolidation range. Possibly, today the pair may fall to break the downside border at 9944.00 and then continue trading inside the downtrend with the predicted target at 9400.00.

BTCUSD
Risk Warning: the result of previous trading operations do not guarantee the same results in the future

Article By RoboForex.com

Attention!
Forecasts presented in this section only reflect the author’s private opinion and should not be considered as guidance for trading. RoboForex LP bears no responsibility for trading results based on trading recommendations described in these analytical reviews.

Fibonacci Retracements Analysis 26.08.2019 (GOLD, USDCHF)

Article By RoboForex.com

XAUUSD, “Gold vs US Dollar”

In the H4 chart, after completing a slight correction and breaking the previous high, XAUUSD is still trading upwards. The short-term targets are inside the post-correctional extension area between 138.2% and 161.8% fibo at 1555.95 and 1569.27 respectively; the long-term target is 76.0% fibo at 1616.45. The local support is the low at 1479.45.

GOLD_H4
Risk Warning: the result of previous trading operations do not guarantee the same results in the future

As we can see in the H1 chart, there was a gap at the beginning of today’s trading session and the pair started a new short-term pullback, which has already reached 23.6% fibo. The next downside targets may be 38.2% and 50.0% fibo at 1531.05 and 1523.70 respectively. If the price breaks the local high at 1554.99, the uptrend will continue.

GOLD_H1
Risk Warning: the result of previous trading operations do not guarantee the same results in the future

USDCHF, “US Dollar vs Swiss Franc”

As we can see in the H4 chart, the previous correctional uptrend has reached 61.8% fibo; right now, the price is falling towards the low at 0.9660. After breaking the low, the instrument may continue falling towards the post-correctional extension area between 138.2% and 161.8% fibo at 0.9586 and 0.9522 respectively.

USDCHF_H4
Risk Warning: the result of previous trading operations do not guarantee the same results in the future

In the H1 chart, after finishing the descending impulse, USDCHF is being corrected to the upside; it has already reached 38.2% fibo and may yet continue towards 50.0% fibo at 0.9795. The support is the low at 0.9713.

USDCHF_H1
Risk Warning: the result of previous trading operations do not guarantee the same results in the future

Article By RoboForex.com

Attention!
Forecasts presented in this section only reflect the author’s private opinion and should not be considered as guidance for trading. RoboForex LP bears no responsibility for trading results based on trading recommendations described in these analytical reviews.

Bitcoin’s new normal bottom is $10,000: deVere CEO

By George Prior

Bitcoin’s new normal bottom is $10,000, predicts the CEO of one of the world’s largest independent financial advisory organizations.

The comment from Nigel Green, the chief executive and founder of deVere Group, the $12bn advisory giant that launched deVere Crypto in early 2018, comes as the world’s largest cryptocurrency has lingered around this mark for several days, before jumping up Monday.

Mr Green notes: “Looking at its performance this year, I believe that the new normal bottom price for Bitcoin is $10,000.

“It bounces at this price. If it fluctuates below this level, it shoots back up again. We have seen this in action on Monday when Bitcoin hit $10,500 in a matter of minutes.”

Earlier this month, the deVere CEO predicted that Bitcoin could hit $15,000 in the near future. It is a prediction he is doubling down on.

He says: “Bitcoin can be expected to imminently reach $15,000 for four main reasons.

“First, geopolitical issues, such as the U.S.-China trade war and Brexit, are intensifying and investors will increase exposure to decentralized, non-sovereign, secure digital currencies, such as Bitcoin, to shield them from the turmoil taking place in traditional markets.

“Second, technical network improvements are further improving performance. Bitcoin’s hash rate has smashed through another new all-time high recently and this fuels investor confidence.

“Third, the 2020 Bitcoin halving will help drive the price skywards.  The code for mining Bitcoin halves around every four years and the next one is set for May 2020. When the code halves, miners receive 50 per cent fewer coins every few minutes.  History shows that there is typically a considerable Bitcoin surge resulting from halving events.

“And fourth – and perhaps the most important one – is that public awareness is consistently growing. Cryptocurrencies, and in particular Bitcoin, are increasingly part of mainstream finance. This is evidenced not only in the financial sector, in which all major banks are increasingly looking at blockchain and crypto, but with big names within the tech and retail sectors too.”

The deVere CEO concludes: There is increasing global acceptance that cryptocurrencies, such as Bitcoin, are not only the future of money, but increasingly the money of today.  This will be reflected in Bitcoin’s new normal bottom price of $10,000.”

About:

deVere Group is one of the world’s largest independent advisors of specialist global financial solutions to international, local mass affluent, and high-net-worth clients.  It has a network of more than 70 offices across the world, over 80,000 clients and $12bn under advisement.