The US dollar has moved away from local highs against a basket of major currencies. US President Donald Trump has criticized the Fed’s actions on Twitter again. The President believes that the Fed does not provide adequate support to the US economy. Meanwhile, Kansas City Federal Reserve President, Esther George, said that the Fed aimed to promote maximum employment and price stability. That is why the regulator does not intend to reduce the interest rate sharply. Investors expect a speech by Fed’s Chairman, Jerome Powell, at the Jackson Hole Summit to be held today. The US dollar index (#DX) closed the trading session in the negative zone (-0.12%).
Quite optimistic economic data from the Eurozone and the US were published yesterday. Thus, German services PMI rose to 43.6 in August instead of 43.0. Manufacturing PMI in the Eurozone also grew by 47.0 in August, although experts forecasted 46.3. Initial jobless claims in the US fell to 209K instead of 216K. Today, we expect economic data from Canada and the US.
The “black gold” prices are consolidating. At the moment, futures for the WTI crude oil are testing the $55.30 mark per barrel.
Market Indicators
Yesterday, there was a variety of trends in the US stock markets: #SPY (-0.03%), #DIA (+ 0.20%), #QQQ (-0.32%).
The 10-year US government bonds yield has been recovering. At the moment, the indicator is at the level of 1.65-1.66%.
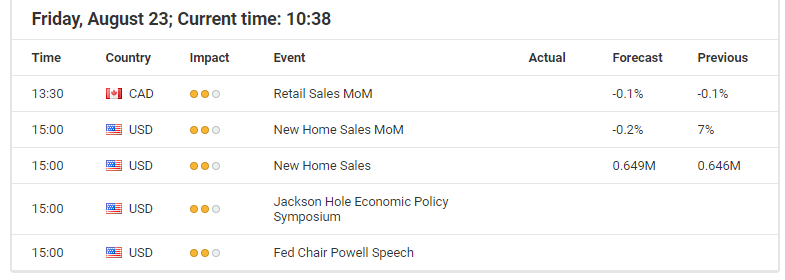
The news feed for 2019.08.23:
– Report on retail sales in Canada at 15:30 (GMT+3:00); – New home sales in the US at 17:00 (GMT+3:00).
At 17:00 (GMT+3:00), the Fed’s Chairman will speak at the Jackson Hole Symposium.
Since the economic calendar is quite thin into the weekly close, all eyes will likely be on Fed chairman Powell’s speech from the symposium in Jackson Hole.
This is particularly true in regards to the USD/JPY, after the BoJ confirmed on Wednesday that deputy governor Wakatabe attends the Jackson Hole symposium instead of Haruchiko Kuroda, meaning that no significant, market-moving news from Japan’s central bank should be expected.
While US-Treasury yields seem to find at least a short-term bottom over the last few days (going hand in hand with no further escalation in the trade dispute between the US and China), the JPY saw no significant gains against the US dollar.
Still, the USD/JPY couldn’t recapture 106.80/107.00. The main reason is probably that market participants, with interest rates making historic moves globally, expect Fed chair Powell in Jackson Hole to clarify the intentions of the US central bank in regards to further rate cuts.
And in addition to that, the latest tweets from US president Trump last Monday, where he started to talk the first time about “some quantitative easing” from the Fed, one could probably also expect some hints from Powell in regards to extraordinary monetary policy measures like re-launching QE anytime soon and if further rate cuts aren’t working in case of an economic downturn.
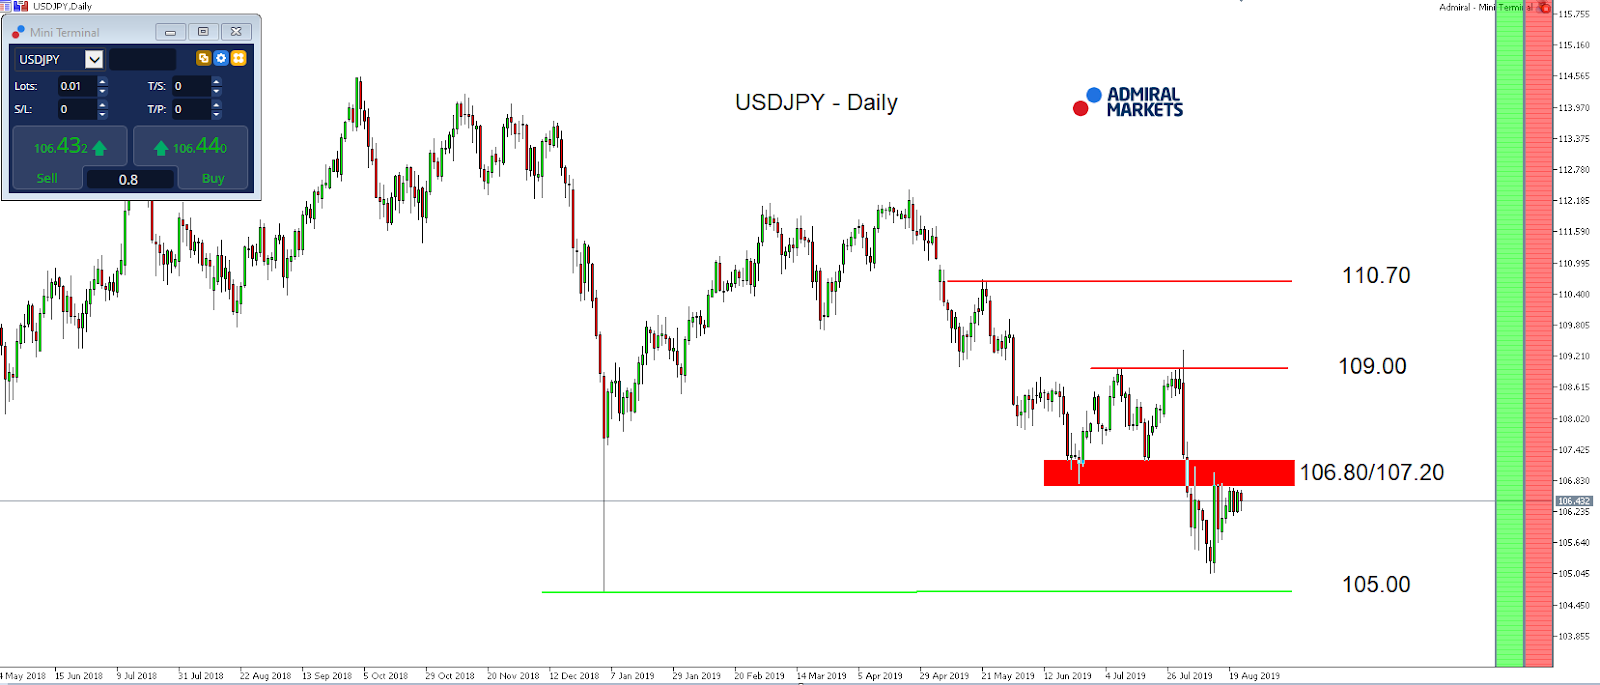
With that in mind, we stay bullish for the JPY against the USD, technically as long as we trade below 106.80/107.00, where we expect another stint to 105.00 and even lower.
Recapturing 106.80/107, on the other hand, could trigger a deeper regressive move in the days to come to around 108.50/109:
Source: Admiral Markets MT5 with MT5-SE Add-on USD/JPY Daily chart (between May 24, 2018, to August 22, 2019). Accessed: August 22, 2019, at 10:00pm GMT – Please note: Past performance is not a reliable indicator of future results, or future performance.
In 2014, the value of USDJPY increased by 13.7%, in 2015, it increased by 0.5%, in 2016, it fell by 2.8%, in 2017, it fell by 3.6%, in 2018, it fell by 2.7%, meaning that after five years, it was up by 4.1%.
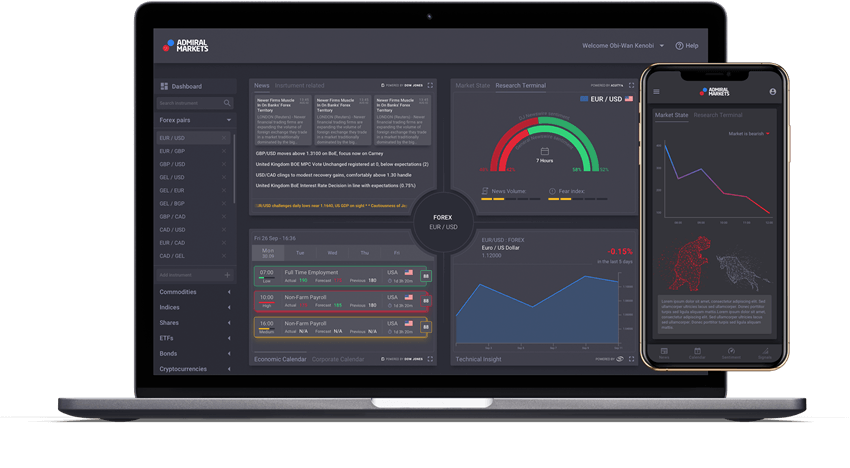
Discover the world’s #1 multi-asset platform
Admiral Markets offers professional traders the ability to trade with a custom, upgraded version of MetaTrader 5, allowing you to experience trading at a significantly higher, more rewarding level. Experience benefits such as the addition of the Market Heat Map, so you can compare various currency pairs to see which ones might be lucrative investments, access real-time trading data, and so much more. Click the banner below to start your FREE download of MT5 Supreme Edition!
Disclaimer: The given data provides additional information regarding all analysis, estimates, prognosis, forecasts or other similar assessments or information (hereinafter “Analysis”) published on the website of Admiral Markets. Before making any investment decisions please pay close attention to the following:
This is a marketing communication. The analysis is published for informative purposes only and are in no way to be construed as investment advice or recommendation. It has not been prepared in accordance with legal requirements designed to promote the independence of investment research, and that it is not subject to any prohibition on dealing ahead of the dissemination of investment research.
Any investment decision is made by each client alone whereas Admiral Markets shall not be responsible for any loss or damage arising from any such decision, whether or not based on the Analysis.
Each of the Analysis is prepared by an independent analyst (Jens Klatt, Professional Trader and Analyst, hereinafter “Author”) based on the Author’s personal estimations.
To ensure that the interests of the clients would be protected and objectivity of the Analysis would not be damaged Admiral Markets has established relevant internal procedures for prevention and management of conflicts of interest.
Whilst every reasonable effort is taken to ensure that all sources of the Analysis are reliable and that all information is presented, as much as possible, in an understandable, timely, precise and complete manner, Admiral Markets does not guarantee the accuracy or completeness of any information contained within the Analysis. The presented figures refer that refer to any past performance is not a reliable indicator of future results.
The contents of the Analysis should not be construed as an express or implied promise, guarantee or implication by Admiral Markets that the client shall profit from the strategies therein or that losses in connection therewith may or shall be limited.
Any kind of previous or modeled performance of financial instruments indicated within the Publication should not be construed as an express or implied promise, guarantee or implication by Admiral Markets for any future performance. The value of the financial instrument may both increase and decrease and the preservation of the asset value is not guaranteed.
The projections included in the Analysis may be subject to additional fees, taxes or other charges, depending on the subject of the Publication. The price list applicable to the services provided by Admiral Markets is publicly available from the website of Admiral Markets.
Leveraged products (including contracts for difference) are speculative in nature and may result in losses or profit. Before you start trading, you should make sure that you understand all the risks.
On Thursday the 22nd of August, trading on the euro closed slightly down. It was a volatile day for the single currency. We got some sharp fluctuations in response to Angela Merkel’s comments on Brexit, which pushed the pound up 150 pips against the US dollar. It later turned out that markets had misinterpreted her comments, and has opened long positions on the pound without verifying the information.
What Merkel said was that the EU and the UK may have time to find a solution by the 31st of October that would eliminate the need for the so-called Irish backstop. British media interpreted this as meaning that a solution would be found in time, although Merkel simply referenced the 31st of October as this is the date on which the UK intends to leave the EU.
The GBPUSD pair didn’t fall back. The correction on the pound gathered pace today as the dollar made gains across the board.
Day’s news (GMT+3):
15:30 Canada: retail sales (Jun).
17:00 US: new home sales (Jul).
20:00 US: Baker Hughes US oil rig count.
Current situation:
As expected, the pair remained within the sideways trend. The bears were held up by the 1.1066 support. Judging by the timing and the wave structure, there’s an increased risk of dropping to 1.1047. Given that trading has been flat for the last 6 days, it’s not worth considering a drop as far as 1.1020. It’s better to highlight 1.1047 as an intermediate level, from which we could get a bounce.
Markets are in wait-and-see mode ahead of US Fed Chair Jerome Powell’s speech in Jackson Hole. Nobody knows what he will say at the symposium, so if we don’t get any news from the UK or Italy, markets should be calm up until 17:00 (GMT+3). There’s a resistance level at 1.1088.
The U.S. could “drown the world in oil” over the next decade, which, according to Global Witness, would “spell disaster” for the world’s attempts to address climate change.
The U.S. is set to account for 61 percent of all new oil and gas production over the next decade. A recent report from this organization says that to avoid the worst effects of climate change, “we can’t afford to drill up any oil and gas from new fields anywhere in the world.” This, of course, would quickly cause a global deficit, as the world continues to consume around 100 million barrels per day (bpd) of oil.
Global Witness notes that the industry is not slowing down in the United States, notwithstanding recent spending cuts by independent and financially-strapped oil and gas firms. If anything, the consolidation in the Permian and other shale basins, increasingly led by the oil majors, ensures that drilling will continue at a steady pace for years to come.
It isn’t as if the rest of the world is slowing down either. The global oil industry is set to greenlight $123 billion worth of new offshore oil projects this year, nearly double the $69 billion that moved forward last year, according to Rystad Energy. In fact, while shale drilling has slowed a bit over the past year amid investor skepticism and poor financial returns, offshore projects have begun to pick up pace.
But that trend might turn out to be just a blip. The U.S. is still expected to account of the bulk of new drilling and the vast majority of new production, with much of that coming from shale. Already, the U.S. is the world’s largest producer of both oil and natural gas. And the pace has accelerated in recent years. In 2018, U.S. oil and gas production increased by 16 and 12 percent, respectively. According to the EIA, the U.S. surpassed Russia in terms of gas production in 2011, claiming the top spot, and it surpassed Saudi Arabia in oil production last year.
Going forward, new production from the U.S. will be eight times larger than the next largest source of growth, which is Canada. In fact, the U.S. will add 1.5 times more oil and gas than the rest of the world combined, according to Global Witness.
But because so much drilling in the U.S. is concentrated in a few areas, individual U.S. states on their own tower over the rest of the world. If Texas were a country, it would account for the most new oil and gas production in the world. Between 2020 and 2029, Texas could account for 28 percent of all additional output, Global Witness says.
Canada and Pennsylvania tie for second and third with 7 percent each. Then comes New Mexico at 5 percent of the growth and North Dakota at 4 percent. Oklahoma, Brazil, Colorado, Russia and Ohio are all tied at 3 percent a piece.
In other words, 7 out of the top 10 sources of new oil and gas production globally over the next decade are U.S. states.
“If things don’t change, by the end of the next decade, new oil and gas fields in the US will produce more than twice what Saudi Arabia produces today,” Global Witness said in its report.
This presents a massive challenge. “To avoid the worst impacts of climate change, our analysis shows that global oil and gas production needs to drop by 40% over the next decade. Yet, instead of declining, US oil and gas output is set to rise by 25% over this time, fueled by expansion in new fields,” the report warned.
Admiral Markets has partnered with Trading Central, Acuity and Dow Jones Newswires to provide clients with an advanced trading and investing analytics portal, powered by trusted, high-quality content.
Available for free to all Admiral Markets clients, the Premium Analytics portal is designed to help traders and investors make informed decisions as well as find new opportunities.
With features including real-time news, professional market research, macroeconomic and corporate calendars, technical and fundamental analysis, pattern recognition and big-data-driven sentiment tools, Admiral Markets’ clients are now able to dive into the global markets through a convenient and user-friendly interface that works well on any device.
The enhanced news feature gives traders access to real-time multi-asset news, which covers up to 2,500 of the world’s most popular markets, including currencies, indices, commodities and stocks. Working in partnership with Dow Jones to provide a rich stream of news and data, Admiral Markets’ clients can easily navigate and customise the portal according to their interests.
Meanwhile, the Economic and Corporate calendars, powered by Dow Jones, show case market-impacting events in real-time across the political, economic and corporate sectors with enhanced functionality to allow traders and investors to follow their favourite companies.
The news sentiment widget, powered by Acuity, uses unique machine learning technology to reveal hidden insights from the text of millions of news articles, informing users through intuitive visualisations how positive the world is towards their favourite instruments. Whether traders use news sentiment to build their trading strategy or combine it with their current strategy, news sentiment can help all types of traders by freeing them from reading a range of information sources and providing an aggregated sentiment of the world’s financial media.
Another feature of the Premium Analytics portal is an award-winning professional widget – powered by Trading Central’s Technical Insight. This technical and fundamental analysis and trading signals tool was previously available only for professional traders and investors. Technical Insight empowers investors of all skill levels to optimise their trading strategies through a combination of actionable technical analysis, educational guidance and customisable alerts. Previously only available for Forex via MetaTrader Supreme Edition, the Admiral Markets’ Premium Analytics version will offer 24/7 coverage of all available markets.
Chairman of the Management Board of Admiral Markets Group, Sergei Bogatenkov, commented, “Admiral Markets is excited to be partnering with Dow Jones Newswires, Acuity and Trading Central to be offering our clients these advanced analytics features. Our mission is to provide our clients with the best trading experience, to ensure they have the best chances of success in their trading. Tools like Premium Analytics are an important step towards providing the best trading experience on the market.”
“The new research portal is the first stage of new developments by Admiral Markets aimed at giving their traders a far greater understanding of the markets and, in turn, more opportunities to trade,” says Andrew Lane, CEO of Acuity. “The visualisation of traditionally complex data sets in one portal combined with the embedded AI technology from Acuity exposes unique data correlations and previously undetected market insight. We worked closely with our partners at Dow Jones, utilising our detailed knowledge of news content and technology to deliver an exceptionally unique research portal for Admiral Markets.”
Meanwhile, Alain Pellier, CEO and co-founder of Trading Central commented, “At Trading Central, we’re dedicated to supporting investment decisions through innovation and we’re proud to partner with Admiral Markets to reach more traders and investors in the moments that matter. Their new Premium Analytics portal is blazing a path for modern experiences and holistic research. Technical Insight acts as a natural fit for this, with its premium, actionable technical analysis, educational commentary, and award-winning interface.”
About Admiral Markets Admiral Markets is a leading online trading and investing provider. In addition to a wide range of financial instruments, Admiral Markets offers free educational materials, including analytics, webinars and seminars. Admiral Markets is proud to announce being awarded the coveted “2019 CFD Broker of the Year” award by a customer survey conducted by Broker-Test.de, on the eve of celebrating 18 years of success in trading and client service.
About Acuity Acuity is a financial technology company specialising in the analysis and extraction of valuable data from financial news content. Founded in 2013, Acuity’s mission is to help traders to find and translate relevant news content into viable trading opportunities through the use of AI driven data tools and powerful visualisation techniques. Combining our team of academics, news specialists, proprietary technology and our partnership with Dow Jones, Acuity is harnessing the power of news and enriching the experience for Dow Jones clients worldwide.
About Trading Central Trading Central has been successfully supporting investment decisions through innovation since 1999. Our broad portfolio of market solutions combines award-winning analyst research and patented pattern recognition with 24H global multi-asset coverage. Collectively, these provide technical and fundamental analysis on 75,000+ instruments every market day to offer timely and actionable insight. Our tools empower today’s investors to participate in financial markets by helping them to generate trade ideas, validate investment decisions and manage risk- all at the point of action.
About Dow Jones Dow Jones is a global provider of news and business information, delivering content to consumers and organizations around the world across multiple formats, including print, digital, mobile and live events. Dow Jones has produced unrivaled quality content for more than 130 years and today has one of the world’s largest news-gathering operations globally. It produces leading publications and products including the flagship Wall Street Journal, America’s largest newspaper by paid circulation; Factiva, Barron’s, MarketWatch, Mansion Global, Financial News, Dow Jones Risk & Compliance and Dow Jones Newswires. Dow Jones is a division of News Corp (Nasdaq: NWS, NWSA; ASX: NWS, NWSLV).
*** Risk disclosure: CFDs are complex instruments and come with a high risk of losing money rapidly due to leverage. 77% of retail investor accounts lose money when trading CFDs with this provider. You should consider whether you understand how CFDs work and whether you can afford to take the high risk of losing your money. Read more at admiralmarkets.com
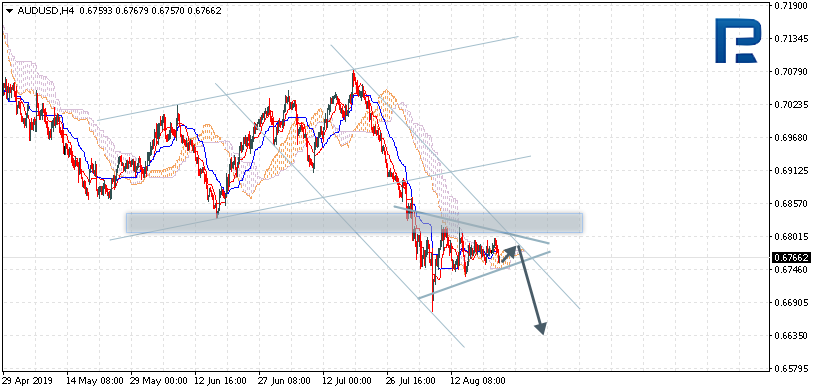
AUDUSD is trading at 0.6766; the instrument is moving inside Ichimoku Cloud, thus indicating a sideways tendency. The markets could indicate that the price may test the cloud’s upside border at 0.6775 and then resume moving downwards to reach 0.6635. Another signal to confirm further descending movement is the price’s rebounding from the descending channel’s upside border. However, the scenario that implies further decline may be canceled if the price breaks the cloud’s upside border and fixes above 0.6825. In this case, the pair may continue growing towards 0.6905. After breaking Triangle’s downside border and fixing below 0.6720, the price may continue moving downwards.
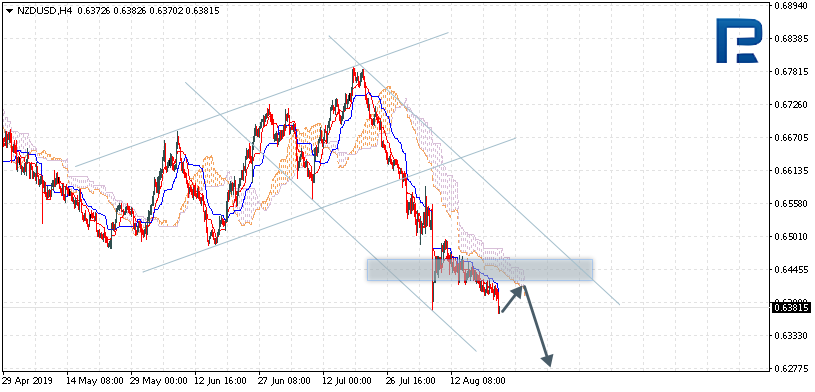
NZDUSD, “New Zealand Dollar vs US Dollar”
NZDUSD is trading at 0.6381; the instrument is moving below Ichimoku Cloud, thus indicating a descending tendency. The markets could indicate that the price may test the cloud’s downside border at 0.6405 and then resume moving downwards to reach 0.6275. Another signal to confirm further descending movement is the price’s rebounding from the resistance level. However, the scenario that implies further decline may be canceled if the price breaks the cloud’s upside border and fixes above 0.6490. In this case, the pair may continue growing towards 0.6595.
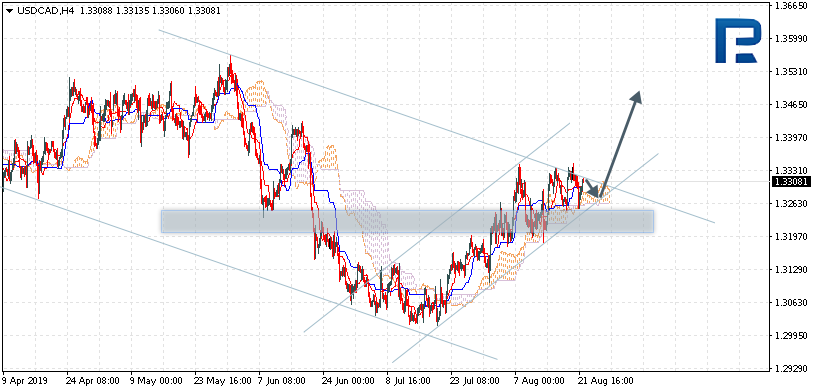
USDCAD, “US Dollar vs Canadian Dollar”
USDCAD is trading at 1.3308; the instrument is moving above Ichimoku Cloud, thus indicating an ascending tendency. The markets could indicate that the price may test the cloud’s upside border at 1.3270 and then resume moving upwards to reach 1.3475. Another signal to confirm further ascending movement is the price’s rebounding from the support level. However, the scenario that implies further growth may be canceled if the price breaks the cloud’s downside border and fixes below 1.3255. In this case, the pair may continue falling towards 1.3165. After breaking the descending channel’s upside border and fixing above 1.3345, the price may continue moving upwards.
Attention! Forecasts presented in this section only reflect the author’s private opinion and should not be considered as guidance for trading. RoboForex LP bears no responsibility for trading results based on trading recommendations described in these analytical reviews.
As we can see in the H4 chart, USDCHF is no longer moving inside the “oversold area”. In this case, the pair may break 2/8 and continue growing towards the resistance at 3/8. However, this scenario may no longer be valid if the price rebounds from 2/8. After that, the instrument may continue falling towards the support at -1/8.
In the M15 chart, the pair may break the downside line of the VoltyChannel indicator and, as a result, continue moving downwards.
XAUUSD, “Gold vs US Dollar”
As we can see in the H4 chart, XAUUSD is still trading inside the “overbought area”. In this case, the price is expected to break 8/8 and then resume falling to reach the support at 6/8. However, this scenario may no longer be valid if the price breaks +1/8. After that, the instrument may continue growing towards the resistance at +2/8.
In the M15 chart, the pair may break the downside line of the VoltyChannel indicator and, as a result, continue moving downwards to reach 6/8 from the H4 chart.
Attention! Forecasts presented in this section only reflect the author’s private opinion and should not be considered as guidance for trading. RoboForex LP bears no responsibility for trading results based on trading recommendations described in these analytical reviews.
The EUR/USD currency pair continues to trade in a flat. Unidirectional trends are not observed. According to the FOMC protocols, further adjustment of the monetary policy of the Fed will be determined on the basis of incoming data. Participants in the financial markets are awaiting a speech by Fed Chairman Jerome Powell at the Jackson Hole Summit on Friday. Today, investors will evaluate the minutes of the last ECB meeting, as well as a number of indicators on business activity in the EU. Positions must be opened from key levels.
The Economic News Feed for 22.08.2019:
– Business activity report (GER, EU) – 10:30 (GMT+3:00);
– ECB meeting minutes (EU) – 14:30 (GMT+3:00);
– Initial Jobless Claims (US) – 15:30 (GMT+3:00);
Indicators do not give accurate signals: 50 MA crossed 100 MA.
The MACD histogram is in the negative zone and below the signal line, which gives a strong signal to sell EUR/USD.
The Stochastic Oscillator is in the neutral zone, the% K line is below the% D line, which also indicates a bearish sentiment.
Trading recommendations
Support levels: 1.10700, 1.10500
Resistance levels: 1.11100, 1.11300, 1.11650
If the price consolidates above 1.11100, expect the price to correct toward 1.11300-1.11600.
Alternatively, the quotes can decrease toward 1.10400-1.10200.
The GBP/USD currency pair
Technical indicators of the currency pair:
Prev Open: 1.21698
Open: 1.21233
% chg. over the last day: -0.31
Day’s range: 1.21167 – 1.21340
52 wk range: 1.2015 – 1.3385
The technical picture on the GBP/USD currency pair remains ambiguous. The pound continues to consolidate. Investors expect additional drivers. At the moment, the local support and resistance levels are 1.21150 and 1.21450. We do not exclude further recovery of GBP/USD quotes. We recommend keeping track of current information on the Brexit issue. Positions must be opened from key levels.
The Economic News Feed for 22.08.2019 is calm.
Indicators do not give accurate signals, 50 MA has crossed 100 MA.
The MACD histogram moved into the negative zone, which points to a bearish sentiment.
The Stochastic Oscillator is in the neutral zone, the% K line began to cross the% D line. There are no signals at the moment.
Trading recommendations
Support levels: 1.21150, 1.21000, 1.20700
Resistance levels: 1.21450, 1.21750, 1.22000
If the price consolidates above 1.21450, expect further growth toward 1.21750-1.22000.
Alternatively, the quotes could descend toward 1.20800-1.20600.
The USD/CAD currency pair
Technical indicators of the currency pair:
Prev Open: 1.33177
Open: 1.32849
% chg. over the last day: -0.21
Day’s range: 1.32822 – 1.33152
52 wk range: 1.2727 – 1.3664
The last trading session on the USD/CAD currency pair is very active. At the same time, there is no defined trend. CAD is trading in a flat. At the moment, the local support and resistance levels are 1.32900 and 1.33200. USD/CAD quotes can grow further. Pay attention to the dynamics of oil prices. Positions must be opened from key levels.
At 15:30 (GMT+3:00), a report on the volume of wholesale sales in Canada will be published.
Indicators do not give accurate signals, the price crossed 50 MA and 100 MA.
The MACD histogram is close to 0.
The Stochastic Oscillator is in the overbought zone, the %K line crossed the %D line. There are no signals at this time.
Trading recommendations
Support levels: 1.32900, 1.32550, 1.32150
Resistance levels: 1.33200, 1.33450, 1.33700
If the price consolidates above 1.33200, expect further growth toward 1.33500-1.33700.
Alternatively, the quotes could drop toward 1.32600-1.32400.
The USD/JPY currency pair
Technical indicators of the currency pair:
Prev Open: 106.223
Open: 106.623
% chg. over the last day: +0.35
Day’s range: 106.294 – 106.654
52 wk range: 104.97 – 114.56
The USD/JPY currency pair continues to trade flat. The technical picture is ambiguous. Since the beginning of this week, the following key support and resistance levels have been formed: 106.200 and 106.650, respectively. Investors expect additional drivers. We recommend keeping track of up-to-date information regarding the trade conflict between the USA and China. Positions must be opened from key levels.
The Economic News Feed for 22.08.2019 is calm.
Indicators do not give accurate signals: 50 MA crossed 100 MA.
The MACD histogram is near 0.
The Stochastic Oscillator is in the oversold zone, the %K line crossed the %D line. There are no signals at the moment.
Trading recommendations
Support levels: 106.200, 105.750, 105.500
Resistance levels: 106.650, 107.000
If the price consolidates above 106.650, expect further growth toward 107.000-107.200.
Alternatively, the quotes can drop toward 105.850-105.700.
The US dollar strengthened against a basket of major currencies amid the publication of optimistic economic data from the US. Thus, existing home sales rose by 0.5% in July, while experts forecasted growth only by 0.2%. The FOMC minutes were also published yesterday. It should be recalled that according to the results of the last meeting, the Fed lowered its key interest rate by 25 basis points to 2.00%-2.25%. Based on the minutes, Fed officials abandoned any forecasting of future policies. The regulator will focus on future economic releases. At the moment, investors expect a symposium in Jackson Hole. The US Dollar Index (#DX) closed the trading session in the positive zone (+0.12%).
At the same time, US President, Donald Trump, continues to criticize the actions by Fed Chairman, Jerome Powell. The President considers Powell the biggest problem in the US economy. “Doing great with China and other Trade Deals. The only problem we have is Jay Powell and the Fed. He’s like a golfer who can’t putt, has no touch. Big U.S. growth if he does the right thing, BIG CUT – but don’t count on him! So far he has called it wrong, and only let us down,” said Donald Trump.
The “black gold” prices have moved away from local highs. At the moment, futures for the WTI crude oil are testing the $55.90 mark per barrel.
Market Indicators
Yesterday, the bullish sentiment was observed in the US stock markets: #SPY (+0.81%), #DIA (+0.90%), #QQQ (+0.89%).
The 10-year US government bonds yield has fallen again. At the moment, the indicator is at the level of 1.57-1.58%.
The news feed for 2019.08.22:
– Data on economic activity in Germany and the Eurozone at 10:30 (GMT+3:00) and 11:00 (GMT+3:00), respectively; – ECB monetary policy account at 14:30 (GMT+3:00); – Initial jobless claims in the US at 15:30 (GMT+3:00).
On Wednesday the 21st of August, trading on the euro closed down. The FOMC minutes didn’t have much of an effect on markets. The US Fed continues to rely mostly on economic data to guide its policy, and is expecting one more rate slash in 2019. The EURUSD pair responded to the minutes with a drop from 1.1101 to 1.1081.
The EURUSD pair has been trading sideways within a range of 1.1066 – 1.1107 since the 16th of August. In today’s Asian session, the pair slipped to 1.1077. The bears are targeting 1.1066 once again. Since the stochastic is in the buy zone, it’s unlikely that the pair will break this level to decline any further.
All eyes are on the Jackson Hole symposium, which starts today and will go on until the 24th of August. The heads of central banks will convene here, along with G7 finance ministers and other financial market officials. The ECB will publish the minutes from its latest monetary policy meeting at 14:30 (GMT+3). This could see the euro collapse against all the majors.