Risk off remains the ‘base case’ of my FX thinking.
Volatility is the highest it’s been in 2019 as the sporadic nature of geo-politics coupled with a backdrop of a slowing global economy has created a perfect FX risk caldron and one that has us looking at XAU and crosses that are long JPY.
EURJPY remains the cross of choice as risk off coupled with the ECB’s September policy changes should see the cross continuing its 45-degree slide to a consensus view of ¥111.00 by year end.
What is also apparent in this market is there are trades that one should try to avoid despite how ‘appealing’ they might seem. In my opinion Cable is a prime example Brexit is creating a very difficult and unknown lever in GBP/USD which has only amplified since the election of populist Prime Minster Boris Johnson.
His gambit to suspend Parliament by the end of this week to force the House to find a Brexit deal is creating a constitutional crisis of the highest order. It has been attacked by all side of the Parliament and his own Speaker has made it clear how ‘unprecedented’ this move is. In short – this event is as negative as negative could be.
Yet, when you look at the trading in Cable this event has actually seen the pair appreciated, not what one would expect.
If you look at some of the Fibonacci retracement levels there is clear support sub-$1.215. Again, if an event like the Prime Minster dissolving Parliament and pushing a no Brexit deal to the front of the cue of possibilities doesn’t cause GBP/USD fall then what will?
Thus, the clear take out of the global set up currently is choose your opportunity. There is enough volatility to find trades that provide returns, but it also means you need to find trades that have some structure based in either technical or fundamental or both to have confidence event risk wont wipe the trade out.
Cryptocurrency adoption over the years has increased on a massive scale. Hundreds of new businesses have started accepting cryptocurrencies en masse due to the overall popularity of the coins.
However, there are thousands of other traditional companies that refuse to accept cryptos under any circumstance. What makes these two types of companies different from each other? Why would one accept these coins, while others would decline them? Is there some kind of disparity between them?
Let’s find out some of the reasons.
Local crypto volumes
Although cryptocurrencies open up so much potential for tapping into the global markets, most companies prefer to target the local populace before they can attempt global coverage. In order for them to test their products or if the whole idea of accepting crypto will be well received, they need to have a sizeable crypto trading community in their relative country.
As we all know, there aren’t too many countries where people would have so many cryptos that they’d be willing to spend them rather than keep them in the cold wallets expecting the price to grow.
However, if the country does have a lot of crypto holders, let’s say hundreds of thousands. Then the company could easily afford to launch the service as they’d expect at least 10% of these people to use their cryptos for shopping.
Furthermore, accepting Bitcoin has become somewhat of a unique feature for a company. Promoting their “affiliation with the blockchain” could drive in new customers even if they won’t use cryptos as payments.
People don’t want to pay cryptos for services
The argument for companies not accepting via cryptocurrencies is because it’s not really viable in some cases. Most of the crypto community believe that cryptocurrencies need to be exchanged for goods rather than services for it to have real liquidity and better adoption.
This all comes from the human sub-conscious actually. Whenever you’re buying something online it’s a completely different experience if it’s a service and not a physical object you can hold or even consume. However, whenever a specific asset can be used for those physical objects, it drives this perception for value.
This was the case with Georgian Forex brokers who decided it was a good idea to offer the local population payments in cryptocurrencies for their services. However, it was quickly discovered that almost none of the crypto holders in the country, which is roughly 40%, so about 6-700,000 people refused to participate in the offer.
This all stems from the population’s understanding of using cryptos for value, as it was the reason that half of the people surveyed answered, while the other half said they’d rather hold on to their cryptos as they expected them to grow in the near future.
The growth of the asset is also one of the main reasons why companies refuse to accept cryptos.
Potential for future fluctuations
Although I mentioned that the reason was the growth of the digital asset, it’s the potential for losses that usually bothers the companies, while the consumers are the other way around.
Let’s imagine a scenario of a company that was accepting Bitcoin payments in 2017 when BTC was about to hit its peak. Whatever they sold for BTC, they pretty much lost 80% on that item rather than make a profit.
This would be more than enough to scare most companies out of offering crypto payments. In fact, we don’t even need to imagine a company, there was actually a case with Steam, one of the largest video game libraries in the world. The company was accepting Bitcoin for years before it had to cut it short because of market volatility.
When it comes to accepting crypto payments, smaller companies have much less to lose as there is no real outside damage. For a large company which is listed on an exchange, it could be disastrous. In one quarter they may report $5 million revenue in cryptos, when in the second quarter that would equal $1 million. It’s just too risky for the investors themselves, who are usually the largest deterrents.
Low safety
The other major deterrent for these companies is how dangerous it is to have large volumes of cryptocurrencies concentrated on one single address. If that address were to take a hit from a hacker, so much capital would be in jeopardy.
But diversifying them across multiple channels would be too much hassle for it to be worth it. Furthermore, there would be no business benefits from the banks which are usually the repositories of the companies’ profits.
Overall, it’s safe to say that traditional companies don’t like being paid in cryptos because of how small the global crypto adoption is in modern times.
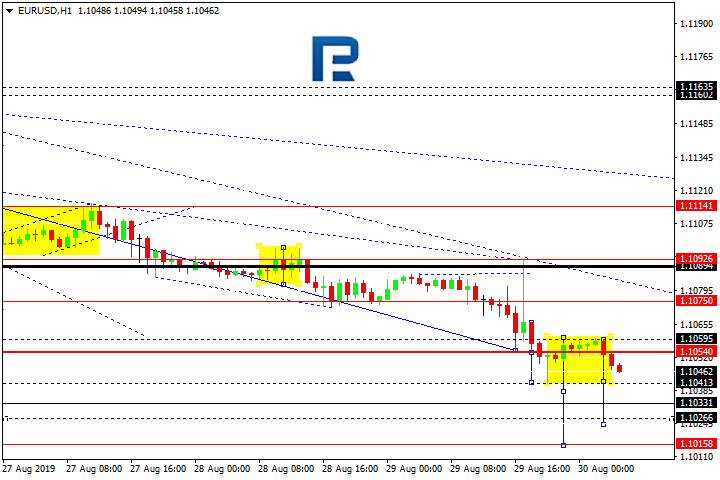
After reaching another target at 1.1055, EURUSD has returned to 1.1090; right now, it is forming another descending wave towards 1.1026. After that, the instrument may start a new correction to return to 1.1055 and then resume trading inside the downtrend with the target at 1.1016.
GBPUSD, “Great Britain Pound vs US Dollar”
GBPUSD is falling. Today, the pair may form a new descending structure to reach 1.2152 and then start another correction with the target at 1.2190. Later, the market may resume trading downwards to reach 1.2131.
USDCHF, “US Dollar vs Swiss Franc”
USDCHF is moving upwards. Possibly, the pair may reach 0.9895 and then start a new correction with the first target at 0.9850.
USDJPY, “US Dollar vs Japanese Yen”
USDJPY has reached 106.66; right now, it is consolidating below it. Possibly, the pair may be corrected towards 106.22 and then resume trading upwards with the target at 106.88.
AUDUSD, “Australian Dollar vs US Dollar”
AUDUSD has reached the downside target. Possibly, today the pair may consolidate near the lows. Later, the market may break the range to the upside and then start a new correction with the first target at 0.6767.
USDRUB, “US Dollar vs Russian Ruble”
USDRUB is forming the second descending impulse towards 66.36. Later, the market may consolidate. If the price breaks this range to the downside, the instrument may resume trading inside the downtrend with the target at 66.82.
USDCAD, “US Dollar vs Canadian Dollar”
USDCAD is still consolidating around 1.3279; it has already formed Triangle pattern. Possibly, the pair may fall towards 1.3285 and then grow to reach 1.3310. If later the price breaks this pattern to the upside, the instrument may continue trading inside the uptrend to reach 1.3366; if to the downside – continue the correction with the target at 1.3225.
XAUUSD, “Gold vs US Dollar”
Gold is forming the second descending impulse; right now, it is forming a continuation pattern around 1523.38. Possibly, today the pair may reach 1516.98 and then form one more ascending structure towards 1521.38. After that, the instrument may resume trading downwards with the target at 1501.60.
BRENT
Brent is moving upwardsю Today, the pair may reach 61.24, Later, the market may be corrected towards 60.06 and then form a new descending structure with the target at 61.41.
BTCUSD, “Bitcoin vs US Dollar”
BTCUSD has reached the downside target; right now, it is consolidating above 9300.00. If the price breaks this range to the upside, the instrument may start a new correction with the target at 10100.00.
Attention! Forecasts presented in this section only reflect the author’s private opinion and should not be considered as guidance for trading. RoboForex LP bears no responsibility for trading results based on trading recommendations described in these analytical reviews.
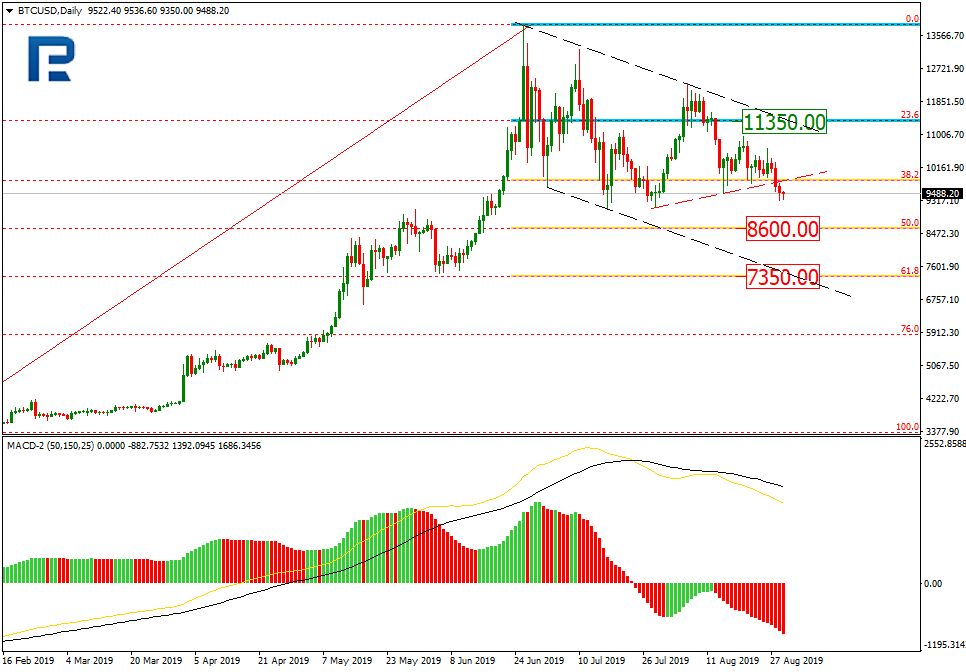
As we can see in the daily chart, after testing 38.2% fibo, BTCUSD has formed a new descending impulse and broken its local lows. In the future, the instrument may continue falling towards 50.0% and 61.8% fibo at 8600.00 and 7350.00 respectively. The resistance is 23.6% fibo at 11350.00.
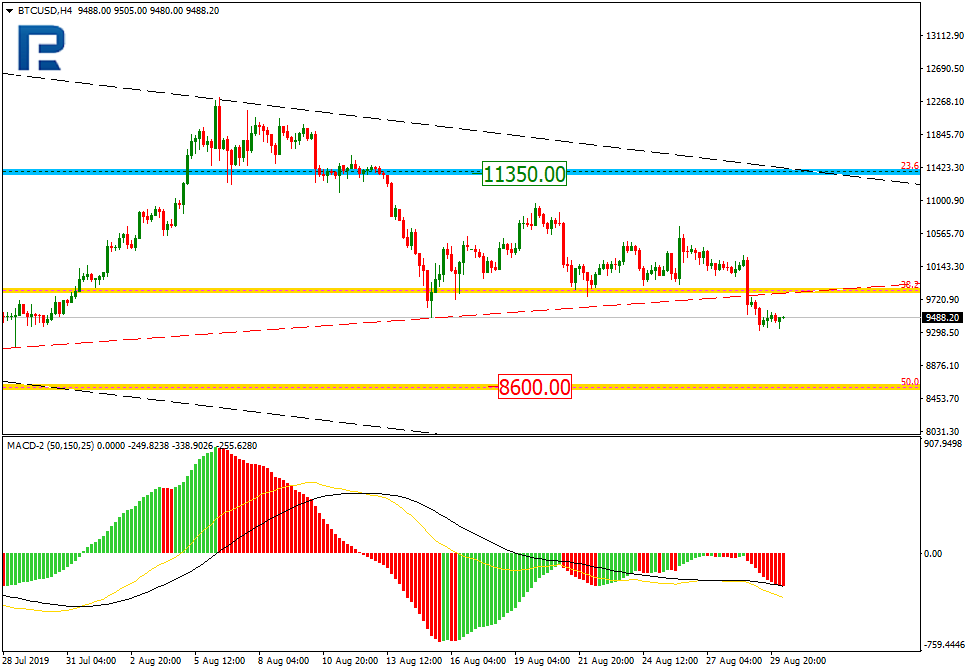
In the H4 chart, the pair is trading towards 50.0% fibo. At the same time, there is a local convergence on MACD Oscillator, which may indicate a possible pullback.
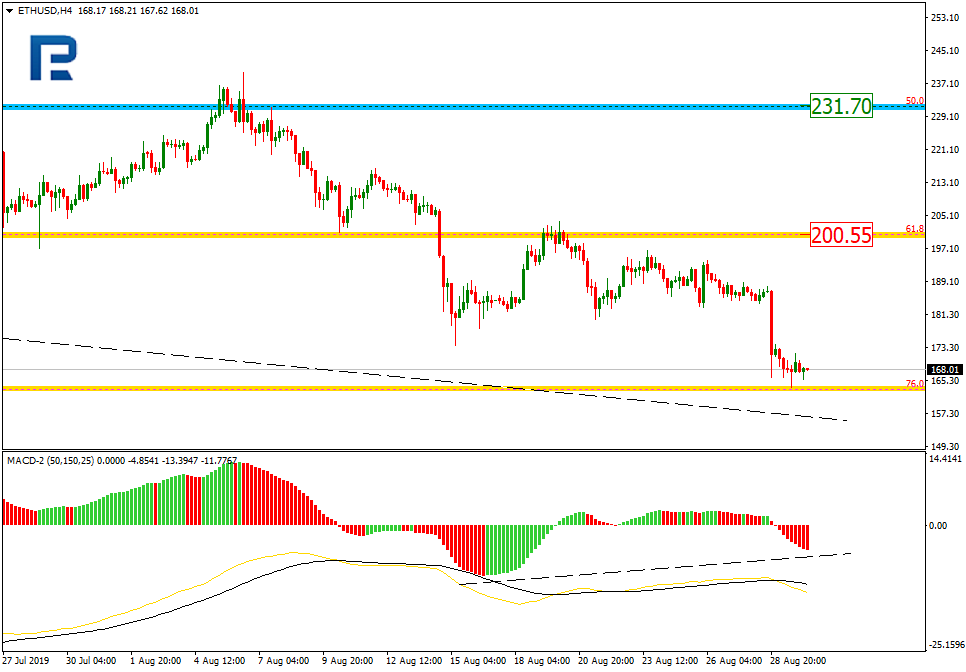
ETHUSD, “Ethereum vs. US Dollar”
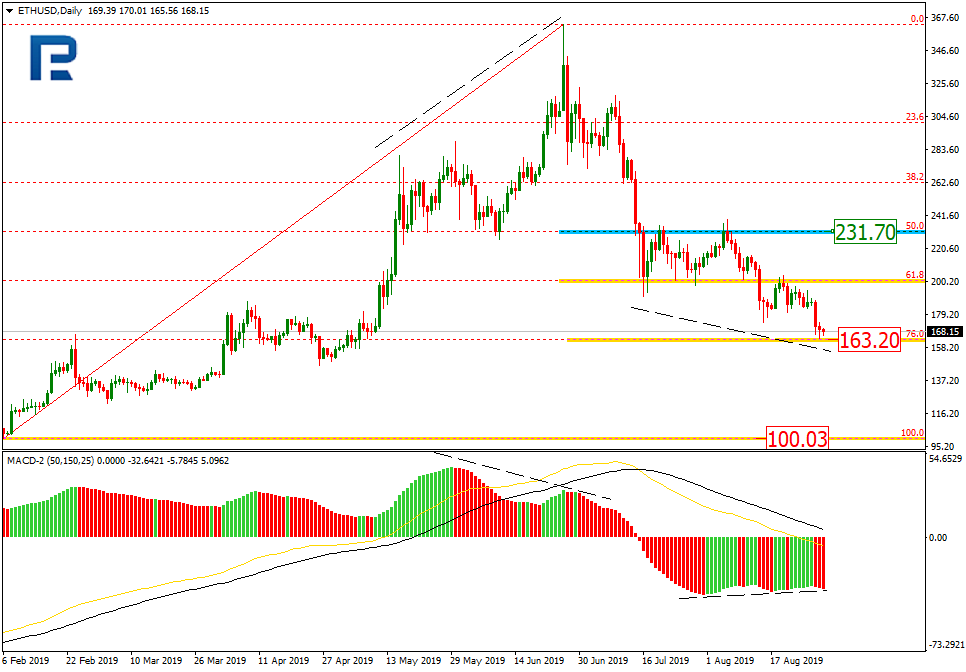
As we can see in the daily chart, ETHUSD has completed another descending impulse and reached 76.0% fibo. After breaking this level and fixing below it, the pair may continue falling towards 100.03. At the same time, there is a convergence on MACD, which may indicate a new pullback. The resistance is 50.0% fibo at 231.50, which may be the target of the correction.
In the H4 chart, the instrument is heading towards 76.0% fibo to test it. At the same time, there is a convergence, which may indicate a short-term correction towards the local resistance at 61.8% fibo at 200.55.
Attention! Forecasts presented in this section only reflect the author’s private opinion and should not be considered as guidance for trading. RoboForex LP bears no responsibility for trading results based on trading recommendations described in these analytical reviews.
In the coming months, some of the worst collateral damage of US tariff wars will occur in sub-Saharan Africa. The adverse impact is likely to be aggravated by US protectionism, which shuns economic integration in Africa.
After US tariff wars undermined the global recovery momentum in 2018, the World Bank projected in June that the world economy would only expand by 2.6 percent. The International Monetary Fund (IMF) has affirmed the trade wars could wipe $455 billion off global GDP in 2020.
The adverse impact on sub-Saharan Africa is reflected by downgraded projections. In April, the World Bank cut the 2019 growth forecast for the region to 2.8 percent from 3.3 percent.
Until the commodity price slump of 2015, Africa enjoyed a decade of rapid growth. The recovery of those growth levels could take long, due to the decline in industrial production and particularly as the US-Sino trade war is taking its toll.
Indeed, the collateral damage in Africa is about to begin.
Trade wars’ impact on Africa
Recently, Akinwumi Adesina, president of the African Development Bank (AfDB) warned that the US-China trade war and uncertainty over Brexit pose risks to Africa’s economic prospects that are “increasing by the day.”Such prospects are also fueled by a recession in Germany.
Indirectly, the diminished prospects are reflected by three major economies – Nigeria, South Africa and Angola – that make up about 60% of sub-Saharan Africa’s annual economic output. At the moment, all are coping with various challenges, curbing their contribution to the growth momentum.
Although Africa is not the direct target of the US-Sino trade war, US tariffs have typically heralded plunging commodity prices, local currencies and major equity exchanges. Earlier in the year, AfDB warned that the trade conflicts could result in a 2.5 percent reduction in the GDP of resource-intensive African countries and 1.0 percent reduction for oil exporters in the next two years.
As US tariffs and diminishing global prospects slow down Chinese production and thus reduce Beijing’s demand for raw materials from Africa, the prospect of slowing Chinese demand could further reduce annual exports from Africa.
The largest regional exporters to China – South Africa and Angola, but also the Republic of Congo, Democratic Republic of Congo, Ghana and Gabon, and Nigeria which rely on China’s need for resources for a significant chunk of their exports – are said to be vulnerable. And so are other African countries with more than 40 percent of their exports going to China, such as South Sudan, Eritrea, Gambia, Guinea and Zimbadwe. Conversely, Africa’s biggest exporters to the US – particularly Angola and South Africa, the Republic of Congo and Democratic Republic of Congo, Gabon and Ghana, Guinea and Nigeria which are dependent on US absorption capacity – remain particularly vulnerable.
Recently, international spotlight has lingered on those African countries that rely on Chinese trade and investment. The highlight should be extended to those countries that depend on US trade and investment, due to the dramatic shifts in US economic presence in Africa in the past two to three decades.
Disruptive changes in US and Chinese trade and FDI
Since December 2018, the Trump administration’s new “Africa strategy” has stressed three priorities: advancing U.S. trade across the region, combating terrorism and aid reduction in the name of efficiency. The first tenet is reflected by the ‘Prosper Africa’ initiative, whose stated goal is to substantially increase trade and investment between the U.S. and Africa.
Yet, to understand the real economic role of the United States and China in Africa, it is instructive to take a long view. Let’s start with trade. Between the end of the Cold War and the onset of the Bush era, US exports to and imports from Africa were less than $1 billion annually. Africa was non-existent to Washington. In the same time period, Chinese exports to Africa more than quintupled to $6 billion, whereas imports from Africa increased even faster, almost 10-fold to over $4 billion.
Prior to global crisis, U.S. trade soared to $100 billion, falling only $2 billion behind that of China. While Chinese trade with Africa was balanced, U.S. trade wasn’t. America imported 2.5 times more from Africa than it exported to Africa.
Until the end of the commodity super-cycle and the collapse of energy prices, Chinese trade soared to more than $200 billion in 2015. After the subsequent plunge, it returned to $155 billion in 2017. Meanwhile, US trade plunged to $50 billion and remains only $55 billion annually. China’s trade surplus with Africa is about $35 billion, whereas U.S. trade deficit with Africa is almost $13 billion. The former has led to some discontent in Africa; the latter is unacceptable to Trump’s trade hawks (Figure 1).
Figure 1US and Chinese Trade with Africa, 1992-2017
Sources: Data UN Comtrade; Chinese Customs
What about the foreign direct investment (FDI) flows? US FDI into Africa peaked at more than $9 billion in 2009. At the same time, Chinese FDI into Africa soared from less than $0.1 billion to $5.5 billion annually. Following the global crisis, the Obama administration pledged greater investments in Africa. In reality, the era saw a dramatic fall of US FDI into Africa, as it plunged to a negative of $2 billion in 2016. Concurrently, Chinese investment in Africa took a hit as well, decreasing to $2.5 billion in 2012. In 2017, US investment rose to only $0.3 billion; while Chinese FDI exceeded $4.1 billion annually (Figure 2).
Figure 2US and Chinese FDI into Africa, 2003-2017
Sources: Data from UNCTAD, BEA
In the 2018 Forum on China Africa Cooperation (FOCAC), President Xi Jinping pledged $60 billion to the continent in loans, grants, and development financing. That’s when the Trump administration developed its “new Africa strategy,” which is constrained by trade protectionism and longer-standing U.S. geopolitical goals.
Differences of US and Chinese presence in Africa
Initially, the Bush administration did push for Africa’s economic self-reliance, but its “war on terror” offset that goal.
The Obama administration’s rhetoric failed to disguise the dramatic collapse of US trade and investment in Africa in the mid-2010s.
In 2014, the US pledged to invest $14 billion in Africa over the next decade. With the most protectionist administration since the 1930s, this may prove unlikely. The Trump administration’s penchant for trade wars shuns efforts to contain collateral damage in Africa. Remedies simply aren’t viable as long as protectionism remains the White House’s primary weapon.
Moreover, the $252 million funding cuts to Ebola response efforts in early 2018 illustrate the gap between the stated goals and effective actions. Finally, expectations should also be cautioned by the Trump administration’s racial bias.
For all practical purposes, the U.S. Africa strategy is largely dictated by the concern that China has become Africa’s largest economic partner. That’s why Washington misrepresents China’s Belt and Road Initiative (BRI) in Africa and elsewhere.
In the postwar era, US-led globalization did not occur without significant mistakes. In the early 21st century, the BRI is going through its own birth pains. But unlike past globalization, the BRI seeks to boost industrialization in emerging and developing countries – that is, countries that have been largely ignored by the advanced West.
In the final analysis, economic development is a win-win game; geopolitics isn’t. Africa is a case in point.
About the Author:
Dan Steinbock is the founder of Difference Group and has served at the India, China and America Institute (US), Shanghai Institute for International Studies (China) and the EU Center (Singapore). For more, see http://www.differencegroup.net/
This commentary was originally published by China-US Focus on August 29, 2019
USD once again strengthened against a basket of world currencies. EUR/USD quotes updated the key lows. Participants in the financial markets continue to monitor the situation in the international trade. The Chinese Ministry of Commerce confirmed that the parties are discussing and scheduling meetings of trade delegations scheduled for September. The trading instrument is currently consolidating. The local support and resistance levels are: 1.10400 and 1.10700, respectively. The EUR/USD currency pair can decline further. We recommend opening positions from the key levels.
The Economic News Feed for 30.08.2019:
– The consumer price index (EU) – 12:00 (GMT+3:00);
Indicators point to the strength of sellers: the price has fixed below 50 MA and 100 MA.
The MACD histogram is in the negative zone and continues to decline, which signals a bearish sentiment.
Stochastic Oscillator has started to leave the oversold zone, the %K line is above the %D line, which gives a signal to buy EUR/USD.
Trading recommendations
Support levels: 1.10400, 1.10000
Resistance levels: 1.10700, 1.10900, 1.11150
If the price consolidates below 1.10400, expect a further descend to 1.10000.
Alternatively, the quotes could recover toward 1.10850-1.11100.
The GBP/USD currency pair
Technical indicators of the currency pair:
Prev Open: 1.22049
Open: 1.21803
% chg. over the last day: -0.23
Day’s range: 1.21747 – 1.21918
52 wk range: 1.2015 – 1.3385
The GBP/USD currency pair stabilized after a sharp decline since the beginning of this week. GBP is currently consolidating without a single common trend. The key support and resistance levels are 1.21600 and 1.22000, respectively. Investors expect up-to-date information regarding the Brexit process. Today we recommend paying attention to statistics from the United States. Positions must be opened from the key levels.
The Economic News Feed for 30.08.2019 is calm.
The price fixed below 50 MA and 100 MA, which signals the strength of sellers.
The MACD histogram is in the negative zone, but above the signal line, which gives a weak signal to sell GBP/USD.
The Stochastic Oscillator is in the neutral zone, the %K line is above the %D line, which indicates bullish sentiment.
Trading recommendations
Support levels: 1.21600, 1.21100, 1.20700
Resistance levels: 1.22000, 1.22500, 1.23000
If the price consolidates above 1.22000, expect the quotes to rise toward 1.22400-1.22600.
Alternatively, the quotes can decrease toward 1.21300-1.21100.
The USD/CAD currency pair
Technical indicators of the currency pair:
Prev Open: 1.33063
Open: 1.32897
% chg. over the last day: -0.18
Day’s range: 1.32774 – 1.33111
52 wk range: 1.2727 – 1.3664
CAD is in lateral movement. There is no defined trend. At the moment, USD/CAD quotes are testing the key support and resistance levels at 1.32800 and 1.33150, respectively. Investors took a wait and see attitude before the release of important statistics on the Canadian economy. We also recommend paying attention to the dynamics of oil quotes. Positions must be opened from key levels.
At 15:30 (GMT+3:00), Canada will publish a GDP report.
Indicators do not give accurate signals: the price crossed 50 MA and 100 MA.
The MACD histogram is close to 0.
The Stochastic Oscillator is in the overbought zone, the %K line crossed the %D line. There are no signals at the moment.
Trading recommendations
Support levels: 1.32800, 1.32550, 1.32300
Resistance levels: 1.33150, 1.33400
If the price consolidates above 1.33150, expect an increase toward 1.33400-1.33600.
Alternatively, the quotes could drop toward 1.32600-1.32450.
The USD/JPY currency pair
Technical indicators of the currency pair:
Prev Open: 106.103
Open: 106.517
% chg. over the last day: +0.31
Day’s range: 106.286 – 106.543
52 wk range: 104.97 – 114.56
On the USD/JPY currency pair, bullish sentiment prevails. The trading tool has reached key extremes. Demand for “safe” assets has weakened amid optimism in international trade. At the moment, USD/JPY quotes are consolidating in the range 106.200-106.700. We do not exclude further growth of the trading instrument. We recommend that you pay attention to the dynamics of yield on US government bonds. Positions must be opened from key levels.
A number of controversial economic releases from Japan were published in the Asian trading session.
Indicators indicate the strength of buyers: the price has fixed above 50 MA and 100 MA.
The MACD histogram is in the positive zone, but below the signal line, which gives a weak signal to buy USD/JPY.
The Stochastic Oscillator is in the neutral zone, the %K line is below the %D line, which indicates a bearish sentiment.
Trading recommendations
Support levels: 106.200, 105.850, 105.500
Resistance levels: 106.700, 107.000
If the price consolidates above 106.700, expect further growth toward 107,000.
Alternatively, the quotes could drop toward 105.850-105.600.
Yesterday, the US dollar strengthened against a basket of major currencies despite the release of mixed economic data. Yesterday, preliminary data on the US GDP were published, according to which GDP (q/q) counted to 2.0% in the second quarter, as experts forecasted. Pending home sales index was published, which fell by 2.5% in July, although investors expected growth by 0.1%. The US dollar index (#DX) closed in the positive zone (+0.34%).
The trade war between the US and China is still in the focus of attention. Yesterday, spokesman for China’s Ministry of Commerce, Gao Feng, said that China would not immediately respond to new threats from the US President, Donald Trump, to impose new tariffs on Chinese goods. According to the official, China intends to prevent the escalation of the trade war, and not accelerate it.
Meanwhile, the Australian and New Zealand dollars are getting cheaper amid falling demand for commodity currencies due to a continuous trade dispute between the US and China, as well as a slowdown in global economic growth. Investors expect additional signals regarding US-China trade relations.
The “black gold” prices are consolidating. Currently, futures for the WTI crude oil are testing the $56.25 mark per barrel.
Market Indicators
Yesterday, the bullish sentiment was observed in the US stock markets: #SPY (+1.28%), #DIA (+1.35%), #QQQ (+1.53%).
The 10-year US government bonds yield is recovering. At the moment, the indicator is at the level of 1.53-1.54%.
The News Feed on 2019.08.30:
– Consumer price index in the Eurozone at 12:00 (GMT+3:00); – Canada’s GDP data at 15:30 (GMT+3:00); – Personal spending in the US at 15:30 (GMT+3:00); – Michigan consumer expectations and sentiment at 17:00 (GMT+3:00).
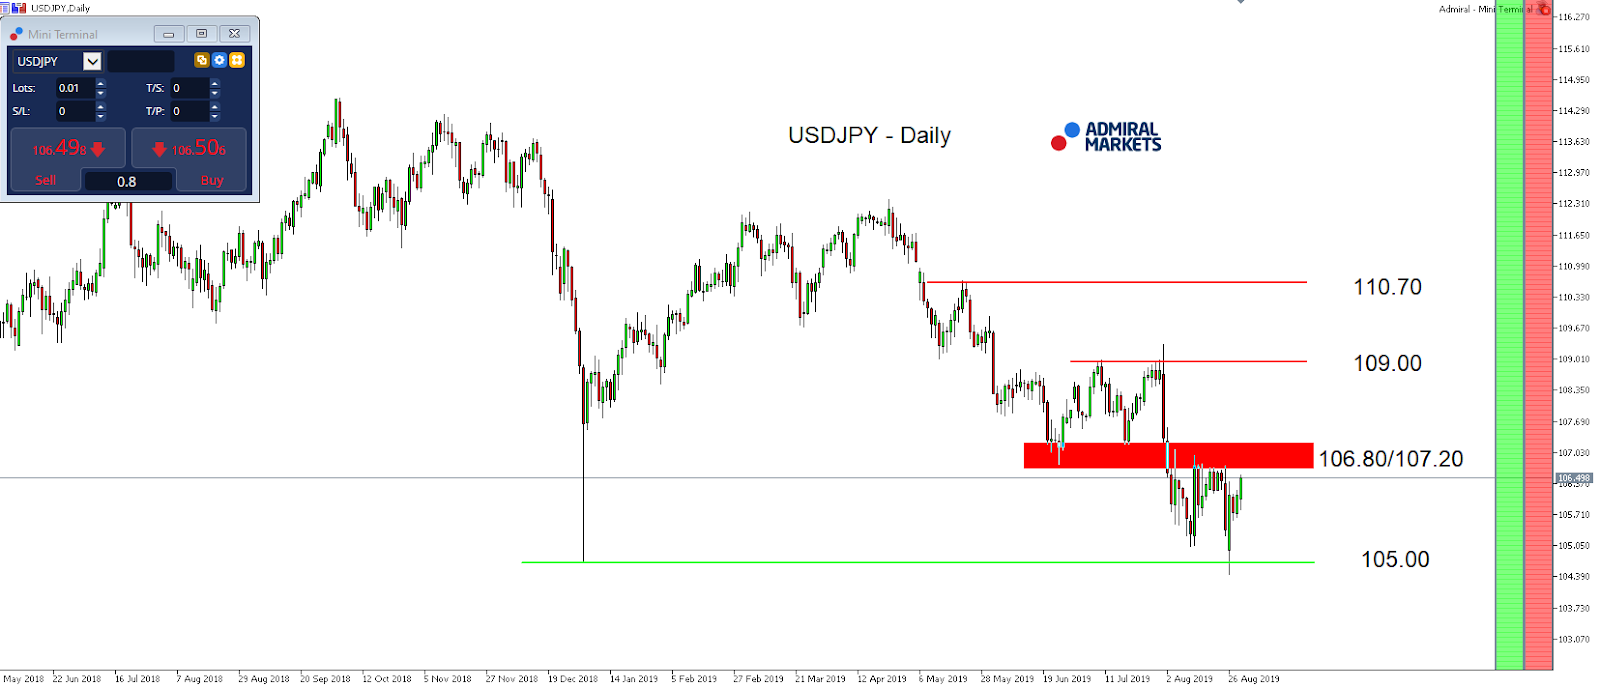
After the currency pair opened below 105.00 last Monday, and briefly traded at its lowest levels since November 2016, the JPY gave back some of its gains while financial markets stabilised a bit.
One major reason was surely a comment from US President Trump who said at the G7 meeting on Monday, that China called over the weekend and started an attempt to get at a table with the US again which was not confirmed by the Chinese.
With rising scepticism that Trump probably “reinvented the truth” a little here, and the USD/JPY still trading below 106.80/107.00, the advantage clearly stays on the short-side in the coming days with uncertainty remaining high among market participants.
In general, USD/JPY traders should remain cautious and expect potential volatility, not only because of a packed economic calendar (ISM Manufacturing (Mo), ISM Non-Manufacturing, ADP (Wed), NFPs (Fri), but also with the still existing speculation of an outright currency market intervention from the US.
That said, a sooner-rather-than-later attack of the region around 105.00 and sustainable break lower should definitely be expected in the USD/JPY, while only recapturing 106.80/107 will brighten the technical picture a little:
Source: Admiral Markets MT5 with MT5-SE Add-on USD/JPY Daily chart (between May 31, 2018, to August 29, 2019). Accessed: August 29, 2019, at 10:00pm GMT – Please note: Past performance is not a reliable indicator of future results, or future performance.
In 2014, the value of the USD/JPY increased by 13.7%, in 2015, it increased by 0.5%, in 2016, it fell by 2.8%, in 2017, it fell by 3.6%, in 2018, it fell by 2.7%, meaning that after five years, it was up by 4.1%.
Discover the world’s #1 multi-asset platform
Admiral Markets offers professional traders the ability to trade with a custom, upgraded version of MetaTrader 5, allowing you to experience trading at a significantly higher, more rewarding level. Experience benefits such as the addition of the Market Heat Map, so you can compare various currency pairs to see which ones might be lucrative investments, access real-time trading data, and so much more. Click the banner below to start your FREE download of MT5 Supreme Edition!
Disclaimer: The given data provides additional information regarding all analysis, estimates, prognosis, forecasts or other similar assessments or information (hereinafter “Analysis”) published on the website of Admiral Markets. Before making any investment decisions please pay close attention to the following:
This is a marketing communication. The analysis is published for informative purposes only and are in no way to be construed as investment advice or recommendation. It has not been prepared in accordance with legal requirements designed to promote the independence of investment research, and that it is not subject to any prohibition on dealing ahead of the dissemination of investment research.
Any investment decision is made by each client alone whereas Admiral Markets shall not be responsible for any loss or damage arising from any such decision, whether or not based on the Analysis.
Each of the Analysis is prepared by an independent analyst (Jens Klatt, Professional Trader and Analyst, hereinafter “Author”) based on the Author’s personal estimations.
To ensure that the interests of the clients would be protected and objectivity of the Analysis would not be damaged Admiral Markets has established relevant internal procedures for prevention and management of conflicts of interest.
Whilst every reasonable effort is taken to ensure that all sources of the Analysis are reliable and that all information is presented, as much as possible, in an understandable, timely, precise and complete manner, Admiral Markets does not guarantee the accuracy or completeness of any information contained within the Analysis. The presented figures refer that refer to any past performance is not a reliable indicator of future results.
The contents of the Analysis should not be construed as an express or implied promise, guarantee or implication by Admiral Markets that the client shall profit from the strategies therein or that losses in connection therewith may or shall be limited.
Any kind of previous or modeled performance of financial instruments indicated within the Publication should not be construed as an express or implied promise, guarantee or implication by Admiral Markets for any future performance. The value of the financial instrument may both increase and decrease and the preservation of the asset value is not guaranteed.
The projections included in the Analysis may be subject to additional fees, taxes or other charges, depending on the subject of the Publication. The price list applicable to the services provided by Admiral Markets is publicly available from the website of Admiral Markets.
Leveraged products (including contracts for difference) are speculative in nature and may result in losses or profit. Before you start trading, you should make sure that you understand all the risks.
On Thursday the 29th of August, trading on the EURUSD pair closed down. The pair rose to 1.1093 during the US session following comments from ECB Governing Council member Klaas Knot, who said that the ECB currently has no need for a renewed QE program (according to a report by Bloomberg).
US data sent the euro down to new intraday lows. US GDP data showed a 2% rise in line with expectations. Germany’s inflation report ensured that pressure on the euro remained, which posted a worse-than-expected reading for August.
Markets were boosted by reports that the US and China are discussing the possibility of continuing trade negotiations in September. China’s Commerce Ministry spokesman Gao Feng told reporters that China will hold off on introducing any countermeasures to newly imposed tariffs from the US as they look to set the conditions necessary for both sides to continue negotiations.
This increased the appetite for risk among market participants, while safe haven assets such as the yen, franc, and gold, went into decline.
Day’s news (GMT+3):
11:30 UK: net lending to individuals (Jul), M4 money supply (Jul), mortgage approvals (Jul).
15:30 Canada: GDP (Jun), industrial product price (Jul).
15:30 US: personal spending (Jul), personal income (Jul), personal consumption expenditures – price index (Jul).
16:45 US: Chicago PMI (Aug).
17:00 US: Michigan Consumer Sentiment Index (Aug).
23:00 US: Baker Hughes US oil rig count.
Current situation:
Yesterday’s expectations were met in full; a drop to the 1.1065 support followed by a rebound. This was helped along by Klaas Knot. The drop below the support was not foreseen. The day closed below 1.1065.
The pair has hit fresh lows in today’s Asian session. Despite an easing of tensions in the US-Sino trade conflict, the majors are trading down against the dollar. The safe havens have moved into positive territory (gold, yen). Markets are likely nervous given that the monthly candlestick is set to close, which is expected to bring with it high volatility. Be ready for some sharp fluctuations ahead of the weekend. In order for the bulls to gather their strength, they need to bring the rate back up to 1.1065. The technical picture doesn’t look good for them as it stands. Don’t be surprised if the pair drops as far as 1.10.
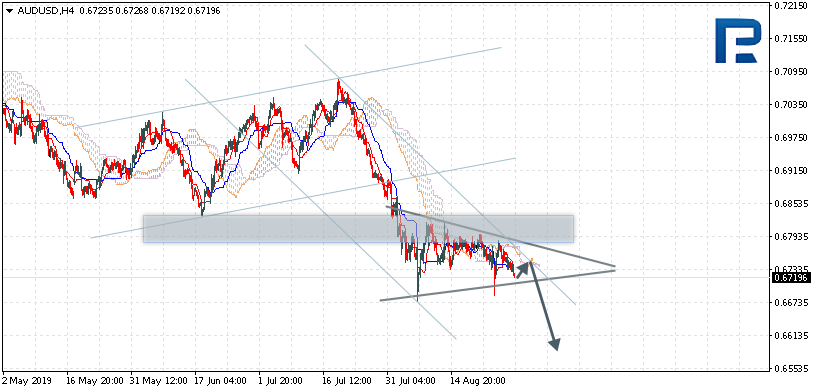
AUDUSD is trading at 0.6719; the instrument is moving below Ichimoku Cloud, thus indicating a descending tendency. The markets could indicate that the price may test the cloud’s downside border at 0.6735 and then resume moving downwards to reach 0.6590. Another signal to confirm further descending movement is the price’s rebounding from the descending channel’s upside border. However, the scenario that implies further decline may be canceled if the price breaks the cloud’s upside border and fixes above 0.6785. In this case, the pair may continue growing towards 0.6905. After breaking Triangle’s downside border and fixing below 0.6675, the price may continue moving downwards.
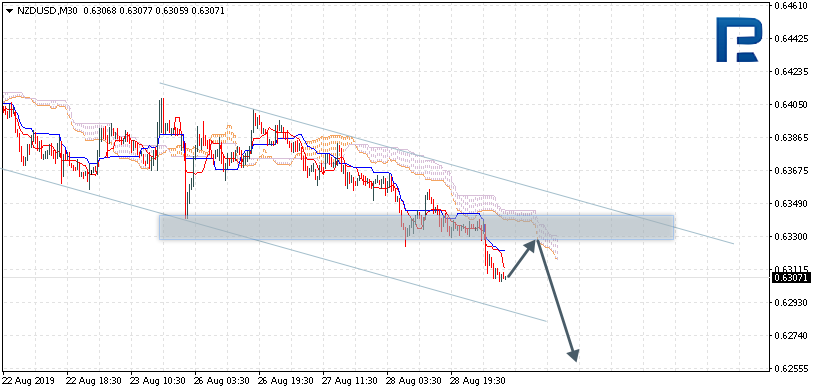
NZDUSD, “New Zealand Dollar vs US Dollar”
NZDUSD is trading at 0.6307; the instrument is moving below Ichimoku Cloud, thus indicating a descending tendency. The markets could indicate that the price may test the cloud’s downside border at 0.6315 and then resume moving downwards to reach 0.6175. Another signal to confirm further descending movement is the price’s rebounding from the resistance level. However, the scenario that implies further decline may be canceled if the price breaks the cloud’s upside border and fixes above 0.6355. In this case, the pair may continue growing towards 0.6425.
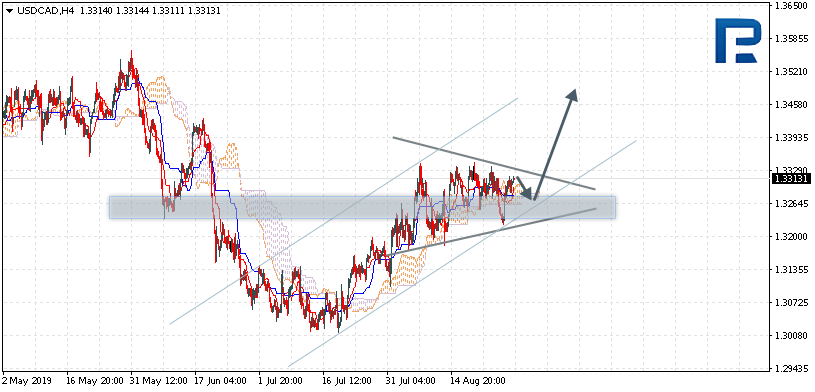
USDCAD, “US Dollar vs Canadian Dollar”
USDCAD is trading at 1.3313; the instrument is moving above Ichimoku Cloud, thus indicating an ascending tendency. The markets could indicate that the price may test the cloud’s downside border at 1.3270 and then resume moving upwards to reach 1.3465. Another signal to confirm further ascending movement is the price’s rebounding from the rising channel’s downside border. However, the scenario that implies further growth may be canceled if the price breaks the cloud’s downside border and fixes below 1.3245. In this case, the pair may continue falling towards 1.3140. After breaking Triangle’s upside border and fixing above 1.3350, the price may continue moving upwards.
Attention! Forecasts presented in this section only reflect the author’s private opinion and should not be considered as guidance for trading. RoboForex LP bears no responsibility for trading results based on trading recommendations described in these analytical reviews.