Article By RoboForex.com
BTCUSD, “Bitcoin vs US Dollar”
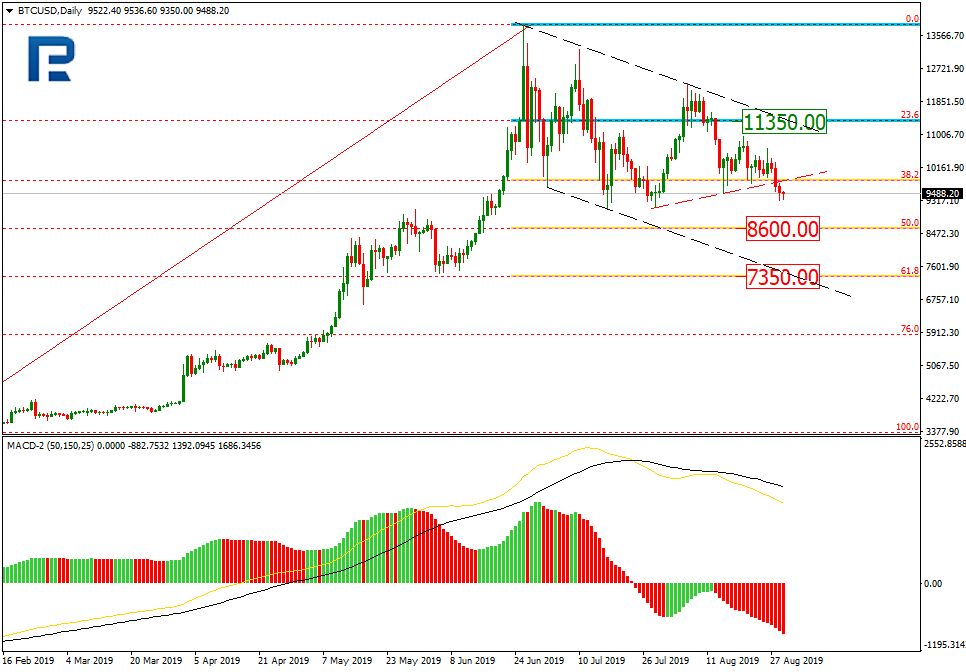
As we can see in the daily chart, after testing 38.2% fibo, BTCUSD has formed a new descending impulse and broken its local lows. In the future, the instrument may continue falling towards 50.0% and 61.8% fibo at 8600.00 and 7350.00 respectively. The resistance is 23.6% fibo at 11350.00.

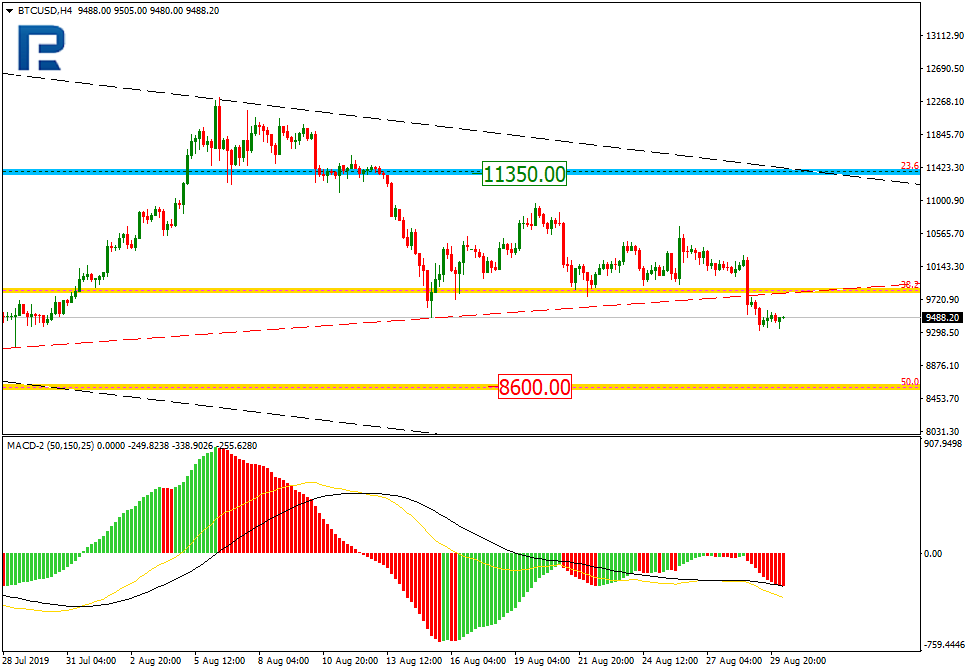
In the H4 chart, the pair is trading towards 50.0% fibo. At the same time, there is a local convergence on MACD Oscillator, which may indicate a possible pullback.
ETHUSD, “Ethereum vs. US Dollar”
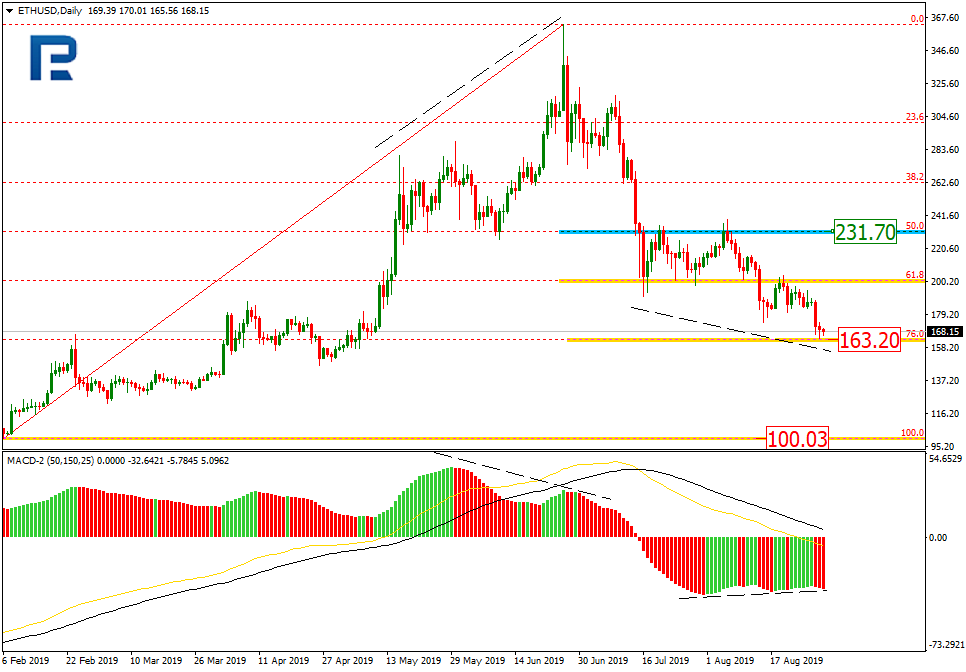
As we can see in the daily chart, ETHUSD has completed another descending impulse and reached 76.0% fibo. After breaking this level and fixing below it, the pair may continue falling towards 100.03. At the same time, there is a convergence on MACD, which may indicate a new pullback. The resistance is 50.0% fibo at 231.50, which may be the target of the correction.
Free Reports:
 Get Our Free Metatrader 4 Indicators - Put Our Free MetaTrader 4 Custom Indicators on your charts when you join our Weekly Newsletter
 Get our Weekly Commitment of Traders Reports - See where the biggest traders (Hedge Funds and Commercial Hedgers) are positioned in the futures markets on a weekly basis.
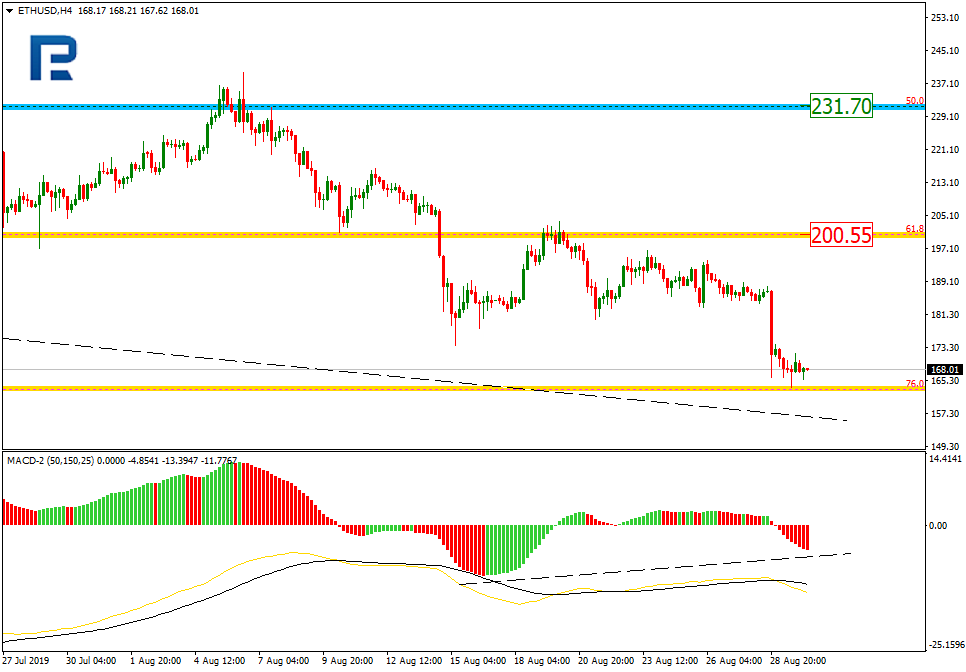
In the H4 chart, the instrument is heading towards 76.0% fibo to test it. At the same time, there is a convergence, which may indicate a short-term correction towards the local resistance at 61.8% fibo at 200.55.
Article By RoboForex.com
Attention!
Forecasts presented in this section only reflect the author’s private opinion and should not be considered as guidance for trading. RoboForex LP bears no responsibility for trading results based on trading recommendations described in these analytical reviews.