Author Archive for InvestMacro – Page 174

Solid NFPs + relaxation between the US and China = USD/JPY above 107?

By Admiral Markets

Source: Economic Events September 6, 2019 – Admiral Markets’ Forex Calendar

As we go into the weekly close, all eyes will be on the US employment situation, the Non-Farm Payrolls.

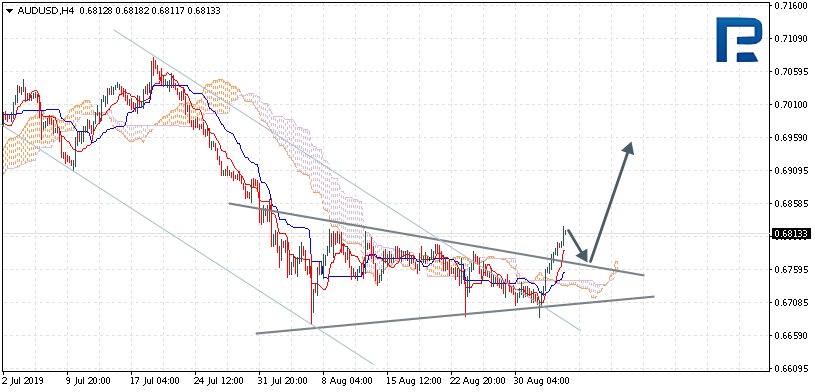
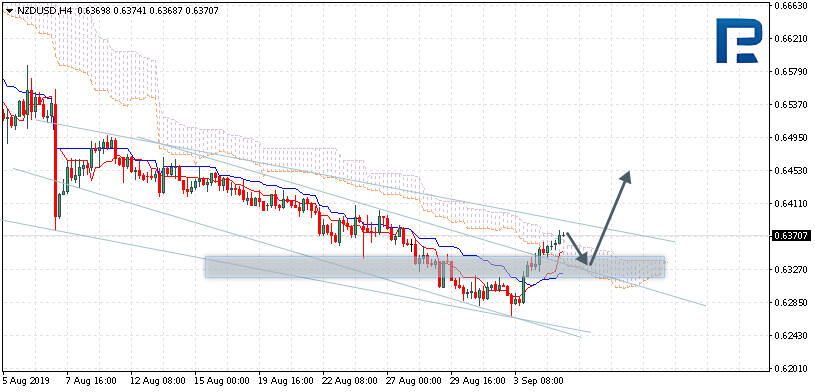
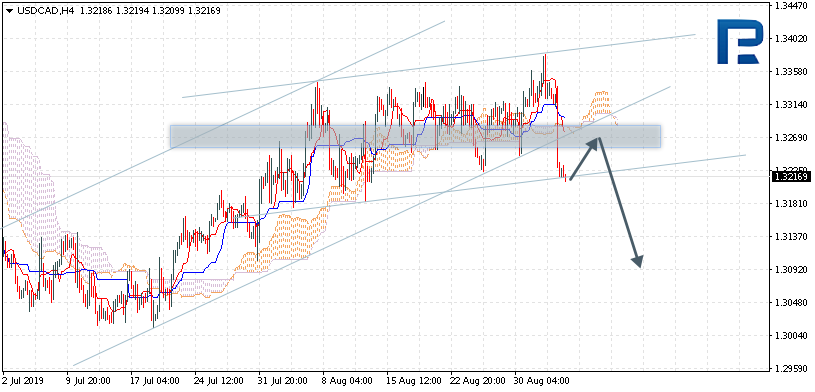
After last Tuesday, where the ISM Manufacturing PMI in the US fell to 49.1 in August 2019 from 51.2 in July (and missed market expectations of 51.1 while pointing to the first month of contraction in the manufacturing sector since January 2016 as new orders and particularly employment declining), amid concerns about a further escalation in US-Chinese trade conflict, the outlook for today’s NFPs is not very promising.

What’s particularly interesting now is that on Thursday, headlines made rounds that US and Chinese envoys will meet in early October for more talks aimed at ending the tariff war that threatens global economic growth. With stabilising 10-year US yields, the USD/JPY went for an attack of the region around 106.80/107.00 and seems to go for a try to sustainably recapture it.

That said, our take is: any NFP print which comes in better than expected will likely see USD/JPY bulls push significantly back above 107.00 into the weekly close, taking on further bullish momentum and a stint up to 108.50/109.00 being an option, especially if speculation of a favourable trade deal between the US and China for both sides start to manifest over the next days and weeks.

On the other hand: any disappointing NFP print and/or new “Twitter escalation” from US president Trump such as “Sure, we aim at a favourable deal – for the US! China will pay!” could dampen the hopes and speculation that the US and China will agree on a deal, meaning that yesterday’s push above 107 was a fake out.

A sharper drop below 105.80 could trigger here a wave of further selling and quickly activate the region around 105.00 again:

Source: Admiral Markets MT5 with MT5-SE Add-on USD/JPY Daily chart (between June 7, 2018 to September 5, 2019). Accessed: September 5, 2019, at 10:00pm GMT – Please note: Past performance is not a reliable indicator of future results, or future performance.

In 2014, the value of the USD/JPY increased by 13.7%, in 2015, it increased by 0.5%, in 2016, it fell by 2.8%, in 2017, it fell by 3.6%, in 2018, it fell by 2.7%, meaning that after five years, it was up by 4.1%.

Discover the world’s #1 multi-asset platform

Admiral Markets offers professional traders the ability to trade with a custom, upgraded version of MetaTrader 5, allowing you to experience trading at a significantly higher, more rewarding level. Experience benefits such as the addition of the Market Heat Map, so you can compare various currency pairs to see which ones might be lucrative investments, access real-time trading data, and so much more. Click the banner below to start your FREE download of MT5 Supreme Edition!

Download MetaTrader 5 and begin trading today!

Disclaimer: The given data provides additional information regarding all analysis, estimates, prognosis, forecasts or other similar assessments or information (hereinafter “Analysis”) published on the website of Admiral Markets. Before making any investment decisions please pay close attention to the following:

  1. This is a marketing communication. The analysis is published for informative purposes only and are in no way to be construed as investment advice or recommendation. It has not been prepared in accordance with legal requirements designed to promote the independence of investment research, and that it is not subject to any prohibition on dealing ahead of the dissemination of investment research.
  2. Any investment decision is made by each client alone whereas Admiral Markets shall not be responsible for any loss or damage arising from any such decision, whether or not based on the Analysis.
  3. Each of the Analysis is prepared by an independent analyst (Jens Klatt, Professional Trader and Analyst, hereinafter “Author”) based on the Author’s personal estimations.
  4. To ensure that the interests of the clients would be protected and objectivity of the Analysis would not be damaged Admiral Markets has established relevant internal procedures for prevention and management of conflicts of interest.
  5. Whilst every reasonable effort is taken to ensure that all sources of the Analysis are reliable and that all information is presented, as much as possible, in an understandable, timely, precise and complete manner, Admiral Markets does not guarantee the accuracy or completeness of any information contained within the Analysis. The presented figures refer that refer to any past performance is not a reliable indicator of future results.
  6. The contents of the Analysis should not be construed as an express or implied promise, guarantee or implication by Admiral Markets that the client shall profit from the strategies therein or that losses in connection therewith may or shall be limited.
  7. Any kind of previous or modeled performance of financial instruments indicated within the Publication should not be construed as an express or implied promise, guarantee or implication by Admiral Markets for any future performance. The value of the financial instrument may both increase and decrease and the preservation of the asset value is not guaranteed.
  8. The projections included in the Analysis may be subject to additional fees, taxes or other charges, depending on the subject of the Publication. The price list applicable to the services provided by Admiral Markets is publicly available from the website of Admiral Markets.
  9. Leveraged products (including contracts for difference) are speculative in nature and may result in losses or profit. Before you start trading, you should make sure that you understand all the risks.

By Admiral Markets

Ichimoku Cloud Analysis 05.09.2019 (AUDUSD, NZDUSD, USDCAD)

Article By RoboForex.com

AUDUSD, “Australian Dollar vs US Dollar”

AUDUSD is trading at 0.6813; the instrument is moving above Ichimoku Cloud, thus indicating an ascending tendency. The markets could indicate that the price may test Tenkan-Sen and Kijun-Sen at 0.6765 and then resume moving upwards to reach 0.6960. Another signal to confirm further ascending movement is the price’s rebounding from Triangle’s upside border. However, the scenario that implies further growth may be canceled if the price breaks the cloud’s downside border and fixes below 0.6695. In this case, the pair may continue falling towards 0.6595.

AUDUSD
Risk Warning: the result of previous trading operations do not guarantee the same results in the future

NZDUSD, “New Zealand Dollar vs US Dollar”

NZDUSD is trading at 0.6370; the instrument is moving above Ichimoku Cloud, thus indicating an ascending tendency. The markets could indicate that the price may test the cloud’s downside border at 0.6330 and then resume moving upwards to reach 0.6455. Another signal to confirm further ascending movement is the price’s rebounding from the descending channel’s upside border. However, the scenario that implies further growth may be canceled if the price breaks the cloud’s downside border and fixes below 0.6280. In this case, the pair may continue falling towards 0.6195.

NZDUSD
Risk Warning: the result of previous trading operations do not guarantee the same results in the future

USDCAD, “US Dollar vs Canadian Dollar”

USDCAD is trading at 1.3216; the instrument is moving below Ichimoku Cloud, thus indicating a descending tendency. The markets could indicate that the price may test Tenkan-Sen and Kijun-Sen at 1.3265 and then resume moving downwards to reach 1.3095. Another signal to confirm further descending movement is the price’s rebounding from the rising channel’s downside border. However, the scenario that implies further decline may be canceled if the price breaks the cloud’s upside border and fixes above 1.3365. In this case, the pair may continue growing towards 1.3450.

USDCAD

Article By RoboForex.com

Attention!
Forecasts presented in this section only reflect the author’s private opinion and should not be considered as guidance for trading. RoboForex LP bears no responsibility for trading results based on trading recommendations described in these analytical reviews.

Murrey Math Lines 05.09.2019 (USDCHF, GOLD)

Article By RoboForex.com

USDCHF, “US Dollar vs Swiss Franc”

As we can see in the H4 chart, USDCHF is moving above 1/8. In this case, the pair may continue growing towards the resistance at 3/8. However, as long as the price is trading below 1/8, the instrument is expected to continue falling towards 0/8.

USDCHF_H4
Risk Warning: the result of previous trading operations do not guarantee the same results in the future

In the M15 chart, the pair may break the upside line of the VoltyChannel indicator and, as a result, move upwards to reach 3/8 from the H4 chart..

USDCHF_M15
Risk Warning: the result of previous trading operations do not guarantee the same results in the future

XAUUSD, “Gold vs US Dollar”

As we can see in the H4 chart, XAUUSD is still moving inside the “overbought area”. In this case, the price is expected to break +1/8 and then continue falling to reach the support at 7/8. However, this scenario may no longer be valid if the price breaks +2/8. After that, the levels on the chart will be redrawn.

GOLD_H4
Risk Warning: the result of previous trading operations do not guarantee the same results in the future

In the M15 chart, the pair may break the downside line of the VoltyChannel indicator and, as a result, start a new decline.

GOLD_M15

Article By RoboForex.com

Attention!
Forecasts presented in this section only reflect the author’s private opinion and should not be considered as guidance for trading. RoboForex LP bears no responsibility for trading results based on trading recommendations described in these analytical reviews.

The Brexit and US/China Trade Negotiations Remain in the Spotlight

by JustForex

USD weakened yesterday against the majors. The USD closed in the negative zone (-0,56%). The pressure on USD is caused by the stream of weak economic reports. For example, the US trading balance saldo lowered in June by 54B USD while the experts expected a descend by 53,50B. The investors are in a negative mood due to the lack of progress in the US/China relationships.

However, today the financial market participants are in a better mood since both China and US are willing to continue negotiations in October. Until the negotiations begin, the leaders will remain in touch to make the negotiations most productive. Both sides want a positive outcome.

GBP strengthened against the USD since the lawmakers of the British government approved the bill to prevent Boris Johnson from leaving the US without a deal, and later refused the additional elections in October proposed by the PM. This bill officially obliges Johnson to request an extension of Brexit until both sides arrive to an acceptable bill.

The Bank of Canada finalized the key interest rate. The regulator kept the indicator at the same level of 1.75%, as expected.

The prices on oil are consolidating after a sharp growth. Right now the WTI futures are testing the mark of 56.15 USD/barrel. At 18:00 (GMT+3:00) the US will publish the report on the crude oil inventories.

Market Indicators

The US stock markets are in a bullish mood: #SPY (+1,14%), #DIA (+0,96%), #QQQ (+1,44%).

The US Treasury 10-year obligations slightly grew in value. Right now the indicator is at 1.50-1.51%.

The Economic News Feed for 05.09.2019:
  • – ADP Nonfarm Employment Change (Aug) (US) – 15:15 (GMT+3:00);
  • – Initial Jobless Claims (US) – 15:30 (GMT+3:00);
  • – ISM Non-Manufacturing PMI (US) – 17:00 (GMT+3:00).

by JustForex

EURUSD: pair aiming for 112–135-degree range

By Alpari.com

On Wednesday the 4th of September, trading on the euro closed up. The single currency’s rise was helped along by several factors: a broadly weaker dollar, reduced tensions in Hong Kong, and improved political situations in Italy and the UK.

The market’s appetite for risk has increased in today’s Asian session following the publication of Chinese PMI data. The pound has recovered from its low point following a vote in parliament. The House of Commons debated a bill that could delay the UK’s departure from the EU by forcing the government to seek an extension.

Italian Prime Minister Giuseppe Conte has reached a deal on forming a new coalition government. The day ended with news that Hong Kong leader Carrie Lam has officially announced the withdrawal of the extradition bill that sparked the protests.

The EURUSD pair has recovered to 1.1039.

Day’s news (GMT+3):

  • 15:15 US: ADP employment change (Aug).
  • 15:30 US: unit labor costs (Q2), nonfarm productivity (Q2), initial jobless claims (30 Aug).
  • 16:45 US: Markit services PMI (Aug).
  • 17:00 US: ISM non-manufacturing PMI (Aug), factory orders (Jul).
  • 18:00 US: EIA crude oil stocks change (30 Aug).

EURUSD H1Current situation:

The pair rose to the 67th degree as expected. The news even sent it past this mark to reach the 90th degree. After a correction to 1.1017, the pair recovered to 1.1035. The bulls are preparing to push on higher to the 112th degree at 1.1060. There are no technical barriers to achieving this. The U3 MA line runs through 1.1099. The pair could make it this far if the dollar continues its downward correction against the majors.

High volatility is expected in today’s US session with the release of employment data. Ahead of the payrolls report, there are a lot of important statistics being released that could have an effect on market sentiment as well as US bond yields.

By Alpari.com

More Than 1,000 New Instruments Added to R Trader

September 5, 2019 – Limassol, Cyprus – RoboMarkets, a European investment company, which provides financial services to clients from many countries of the EU, has added more than 1,000 new instruments to R Trader platform and significantly improved the functionality of the terminal and Trading Robots builder.

More than 1,000 new instruments are already available to RoboMarkets clients in multi-asset platform R Trader. The complete list, which consists of more than 11,700 instruments, now includes CFDs on stocks of the companies placed on American stock exchanges Nasdaq and NYSE. A lot of new instruments will be added automatically during the IPO.

Apart from the addition of new instruments, R Trader now offers several new features, such as saving layouts on the server, a new appearance of trading windows, a new type of indicator (Heiken Ashi), sorting in Watchlists, and exporting backtest results in Strategy Builder in CSV format.

Kiryl Kirychenka, the head of R Trader project, is commenting: “Interest to the stock market among RoboMarkets clients has been steadily increasing for the last few years and we respond to this tendency by developing our trading solutions and providing access to a wide range of assets. With this update, we not only added a pool of new trading instruments but also introduced several new features to the platform, which will surely be appreciated by our clients”.

You can read more information about these new features on RoboMarkets website.


About R Trader

R Trader is a result of cooperation between RoboMarkets and UMSTEL, a fin-tech company that develops a “cloud” multi-asset trading platform. R Trader platform provides access to trade 8 types of assets and more than 11,700 trading instruments. The platform is very convenient and easy to use and guarantees the maximum transparency of all trading operations, while its functionality matches the leading desktop platforms. More detailed information about the platform can be found at www.robomarkets.com.

About RoboMarkets

RoboMarkets is an investment company with the CySEC license No. 191/13. RoboMarkets offers investment services in many European countries by providing traders, who work on financial market, with access to its proprietary trading platforms. More detailed information about the Company’s products and activities can be found on the official website at www.robomarkets.com.


Snap election amid political chaos in the UK: Here’s how to protect your assets

By George Prior

Another defeat for Boris Johnson. No-one is able to predict the intensifying political turmoil engulfing Brexit-weary Britain, meaning the only way to secure your wealth and assets is to remain invested and diversified.

This is the message from the CEO and founder of deVere Group, one of the world’s largest independent financial advisory organizations, as UK Prime Minister Boris Johnson lost yet another crucial parliamentary vote on Wednesday evening.  Against this backdrop, Boris Johnson has tabled a motion for a snap general election.

British lawmakers passed a bill aimed at preventing a no-deal Brexit, in another decisive blow to Mr Johnson.  It cleared the House of Commons by 327 votes to 299.

It now goes to the House of Lords where it can be expected that there will be extensive delaying tactics.

Mr Green comments: “In the last few days, Prime Minister Boris Johnson has ordered the UK parliament to be suspended, lost his working majority in the House of Commons, and purged senior politicians from within his own party – including the grandson of his idol, Winston Churchill.

“On Wednesday, his highly controversial ‘do or die’ approach to Brexit was thrown out yet again by MPs, meaning the chance of a no-deal Brexit is further slashed.

“Whichever way you look at, Mr Johnson’s political options for his agenda are now significantly reduced and therefore he’s moved a motion for a snap general election.

“However, he might not get his way on that either.  The leader of the opposition Labour Party, Jeremy Corbyn, has said that he would only agree to a general election after a law is passed removing the risk of a no-deal Brexit.”

The deVere CEO insisted on Wednesday: “The squeeze on Boris Johnson’s plans will have a positive effect on the pound in the short term – we can expect it to trade considerably higher in the coming sessions as the potential for the PM losing his threat of no-deal increases.”

“However, this might also be put in context.  The rebound will be tempered by an imminent election.

“An election always creates uncertainty and therefore turbulence for sterling, but even before it is called there will be major question marks as Jeremy Corbyn, the Labour leader, is now demanding no-deal is off the table before he agrees to go to the polls.

“And should a Corbyn-led Labour party win that election, there will be even more bad news for the pound.

“His anti-business rhetoric and high tax and low-profit policies would lead to a significant sterling sell-off.”

The deVere CEO concludes: “No-one – but no-one- is able to predict the frenetic intensifying political turmoil engulfing Brexit-weary Britain – there are too many variables and too many potential outcomes and consequences.

“This means the only way to secure your wealth and assets is to remain invested, to take advantage of the upswing when it happens, and to be diversified across asset classes, sectors and regions.”

About:

deVere Group is one of the world’s largest independent advisors of specialist global financial solutions to international, local mass affluent, and high-net-worth clients.  It has a network of more than 70 offices across the world, over 80,000 clients and $12bn under advisement

The pound will rebound short-term but remains vulnerable and volatile

By George Prior

The pound will be rebounding in the short term as the UK Parliament seizes control to try and block a no-deal Brexit – but with major political chaos and a looming election, the currency remains vulnerable.

This is the warning from Nigel Green, the CEO and founder of financial advisory giant deVere Group, which has more than $12bn under advisement.

It comes as Uk lawmakers s on Tuesday night in the House of Commons voted in favour of debating a motion to take the no-deal Brexit off the table and ask the EU for an extension. Prime Minister Boris Johnson has declared he will call a general election if the motion passes.

Mr Green observes: “After falling to its lowest level in 34 years on Tuesday, the pound began to rebound after the Prime Minister lost his Commons majority as Conservative member of parliament Phillip Lee crossed the floor to join the Liberal Democrats – putting Boris Johnson’s ‘do or die’ Brexit agenda under enormous pressure.

“There was then another enormous blow to the PM on Tuesday evening when he lost his first Parliamentary Brexit battle.

“Lawmakers have, in effect, seized control of Parliament’s agenda on Wednesday and will try and force through legislation to stop a no-deal Brexit.

“The squeeze on Boris Johnson’s plans will have a positive effect on the pound in the short term – we can expect it to trade considerably higher in the coming sessions as the potential for the PM losing his threat of no-deal increases.”

He continues: “However, this might also be put in context.  The rebound will be tempered by the possibility of an imminent election.

“An election always creates uncertainty and therefore turbulence for sterling, but even before it is called there will be major question marks as Jeremy Corbyn, the opposition Labour leader, is now demanding no-deal is off the table before he agrees to go to the polls.

“And should a Corbyn-led Labour party win that election, there will be even more bad news for the pound.

“His anti-business rhetoric and high tax and low-profit policies would lead to a significant sterling sell-off.”

The deVere CEO concludes: “Whilst recent developments in the parliament move towards reducing the risk of a no-deal Brexit, it is still a critical issue for the performance of the pound.

“There remains major political upheaval in the UK and a looming election.  This uncertainty means the currency remains vulnerable and volatile.”

About:

deVere Group is one of the world’s largest independent advisors of specialist global financial solutions to international, local mass affluent, and high-net-worth clients.  It has a network of more than 70 offices across the world, over 80,000 clients and $12bn under advisement.


Forex Technical Analysis & Forecast 04.09.2019 (EURUSD, GBPUSD, USDCHF, USDJPY, AUDUSD, USDRUB, USDCAD, GOLD, BRENT, BTCUSD)

Article By RoboForex.com

EURUSD, “Euro vs US Dollar”

EURUSD has reached the target of the first ascending impulse; right now, it is forming a new consolidation range around 1.0970. Possibly, the pair may expand the range towards 1.0983 and then fall to reach 1.0960. If later the price breaks this range to the downside, the instrument may form a new descending structure towards 1.0944; if to the upside – start another growth with the target at 1.1002.

EURUSD
Risk Warning: the result of previous trading operations do not guarantee the same results in the future

GBPUSD, “Great Britain Pound vs US Dollar”

GBPUSD has completed the first ascending impulse; right now, it is consolidating at the top close to 1.2089. If later the price breaks this range to the downside at 1.2070, the instrument may continue trading downwards to reach 1.2025; if to the upside – form one more ascending structure with the target at 1.2220.

GBPUSD
Risk Warning: the result of previous trading operations do not guarantee the same results in the future

USDCHF, “US Dollar vs Swiss Franc”

USDCHF has completed the descending impulse at 0.9860. Today, the pair may start another growth to reach 0.9894 and then form a new consolidation range between these two levels. If later the price breaks this range to the downside at 0.9860, the instrument may form a new descending structure towards 0.9820; if to the upside at 0.9898 – resume trading upwards with the target at 0.9930.

USDCHF
Risk Warning: the result of previous trading operations do not guarantee the same results in the future

USDJPY, “US Dollar vs Japanese Yen”

USDJPY has broken Triangle pattern and may continue the correction. Possibly, today the pair may reach 106.12 and then start a new decline towards 105.70. Later, the market may form one more ascending structure with the target at 106.16.

USDJPY
Risk Warning: the result of previous trading operations do not guarantee the same results in the future

AUDUSD, “Australian Dollar vs US Dollar”

After completing an upside continuation pattern at 0.6725, AUDUSD has finished one more ascending structure. Today, the pair may form a new consolidation range at the top of this impulse. Possibly, the price may expand the range towards 0.6787, fall to reach 0.6757, and then grow to return to 0.6770. If later the price breaks this range to the downside, the instrument may form a new descending structure towards 0.6717 if to the upside – start another growth with the target at 0.6890.

AUDUSD
Risk Warning: the result of previous trading operations do not guarantee the same results in the future

USDRUB, “US Dollar vs Russian Ruble”

USDRUB has reached 67.07; it looks like the price is forming Double Top pattern. Possibly, the pair may rebound from it and then start a new decline with the first target at 66.25.

USDRUB
Risk Warning: the result of previous trading operations do not guarantee the same results in the future

USDCAD, “US Dollar vs Canadian Dollar”

USDCAD is still moving upwards to reach 1.3400. Possibly, today the pair may be corrected to test 1.3300 from above and then form one more ascending structure towards 1.3400. Later, the market may start a new correction to reach 1.3355 at least and then grow with the target at 1.3434 to finish this wave. After that, the instrument may continue trading downwards with the target at 1.2950.

USDCAD
Risk Warning: the result of previous trading operations do not guarantee the same results in the future

XAUUSD, “Gold vs US Dollar”

After breaking Triangle pattern, Gold has completed one more structure. Today, the pair may reach 1550.60 and then form a new descending structure with the target at 1533.90.

GOLD
Risk Warning: the result of previous trading operations do not guarantee the same results in the future

BRENT

Brent has finished another ascending impulse towards 58.85; right now, it is consolidating to break the channel’s upside border. If later the price breaks this range to the upside at 58.88, the instrument may resume trading inside the uptrend with the first target at 59.60; if to the downside at 58.50 – complete the correction at 58.20 and then start a new growth towards the above-mentioned target.

BRENT
Risk Warning: the result of previous trading operations do not guarantee the same results in the future

BTCUSD, “Bitcoin vs US Dollar”

BTCUSD has completed the first descending impulse at 10461.00 along with the correction at 10592.00. Possibly, today the pair may fall to break 10460.88 and then continue trading downwards with the target at 10092.00. However, the price may choose an alternative scenario to form one more ascending structure towards 10790.00 and then start a new decline with the target at 9900.00.

BITCOIN
Risk Warning: the result of previous trading operations do not guarantee the same results in the future

Article By RoboForex.com

Attention!
Forecasts presented in this section only reflect the author’s private opinion and should not be considered as guidance for trading. RoboForex LP bears no responsibility for trading results based on trading recommendations described in these analytical reviews.

Fibonacci Retracements Analysis 04.09.2019 (GBPUSD, EURJPY)

Article By RoboForex.com

GBPUSD, “Great Britain Pound vs US Dollar”

As we can see in the H4 chart, after finishing the correction at 50.0% fibo and breaking the low, GBPUSD is still trading downwards. The next downside targets are inside the post-correctional extension area between 138.2% and 161.8% fibo at 1.2019 and 1.1788 respectively. The resistance is at 1.2286. At the same time, there is a convergence on MACD, which indicates slowdown of the descending tendency.

GBPUSD_H4
Risk Warning: the result of previous trading operations do not guarantee the same results in the future

In the H1 chart, the pair is correcting to the upside and has already reached 38.2% fibo. The next target may be 50.0% fibo at 1.2133. The support is close to the low at 1.1958.

GBPUSD_H1
Risk Warning: the result of previous trading operations do not guarantee the same results in the future

EURJPY, “Euro vs. Japanese Yen”

As we can see in the daily chart, after breaking the significant low, EURUSD is still moving downwards. The targets are inside the post-correctional extension area between 138.2% and 161.8% fibo at 114.33 and 112.06 respectively. The resistance is at 117.96..

EURJPY_D1
Risk Warning: the result of previous trading operations do not guarantee the same results in the future

In the H4 chart, there is a convergence, which may indicate a possible pullback soon. The targets of this correction may be 23.6%, 38.2%, and 50.0% fibo at 117.18, 117.96, and 118.62 respectively. The support is near the low at 115.86.

EURJPY_H4

Article By RoboForex.com

Attention!
Forecasts presented in this section only reflect the author’s private opinion and should not be considered as guidance for trading. RoboForex LP bears no responsibility for trading results based on trading recommendations described in these analytical reviews.