by JustForex
The EUR/USD currency pair
- Prev Open: 1.10342
- Open: 1.10257
- % chg. over the last day: -0.05
- Day’s range: 1.10155 – 1.10295
- 52 wk range: 1.0931 – 1.1817
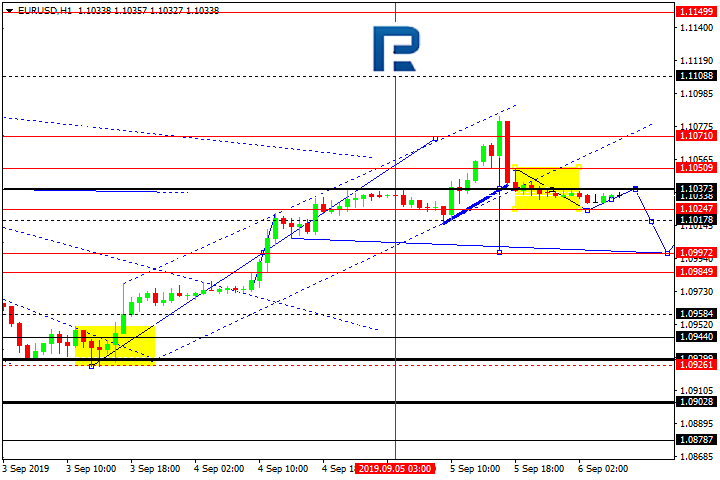
On Friday, the main currency pairs showed a variety of trends. The United States released a mixed labor market report for August. 130K new jobs were created in the non-agricultural sector of the country, which is lower than the forecast value at the level of 160K. The growth in average hourly wages accelerated from 0.3% to 0.4%. The unemployment rate remained unchanged at 3.7%. At the moment, the EUR/USD quotes are consolidating around 1.10100-1.10500. Investors expect up-to-date information regarding trade negotiations between Washington and Beijing. The EUR/USD currency pair has the potential for further recovery. We recommend opening positions from key levels.
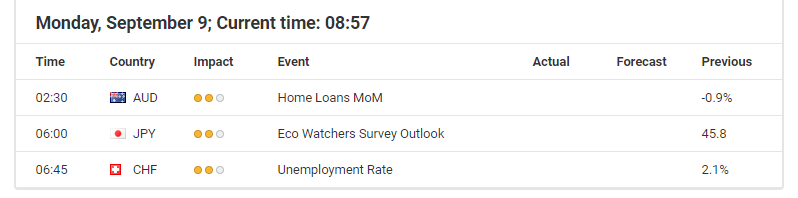
The Economic News Feed for 09.09.2019 is calm.

Indicators do not give accurate signals: the price has fixed between 50 MA and 100 MA.
The MACD histogram is in the negative zone, but has started to rise, which gives a weak signal to sell EUR/USD.
The Stochastic Oscillator is near the overbought zone, the %K line is above the %D line, which indicates bullish sentiment.
- Support levels: 1.10100, 1.09650, 1.09300
- Resistance levels: 1.10500, 1.10850, 1.11150
If the price consolidates above 1.10500, expect further growth toward 1.11000.
Alternatively, the quotes can decrease toward 1.09800-1.09600.
The GBP/USD currency pair
- Prev Open: 1.23260
- Open: 1.22700
- % chg. over the last day: -0.40
- Day’s range: 1.22647 – 1.22907
- 52 wk range: 1.1995 – 1.3385
The GBP/USD currency pair retreated from local highs after a sharp rally last week. Investors began to partially fix the sterling position. The trading instrument is currently consolidating. GBP/USD quotes test local support and resistance levels: 1.22550 and 1.23000, respectively. Financial market participants continue to monitor the situation around Brexit. Today we expect important economic releases from the UK. Positions must be opened from key levels.
The Economic News Feed for 09.09.2019:
- – UK GDP report – 11:30 (GMT + 3: 00);
- – Manufacturing Industry Production Volume – 11:30 (GMT+3:00);

Indicators do not give accurate signals: the price has fixed between 50 MA and 100 MA.
The MACD histogram has moved to the negative zone, which signals the strength of sellers.
The Stochastic Oscillator is in the oversold zone, the% K line crossed the% D line. There are no signals at the moment.
- Support levels: 1.22550, 1.22100, 1.21600
- Resistance levels: 1.23000, 1.23550, 1.24000
If the price consolidates above 1.23000, expect further growth toward 1.23500-1.23700.
Alternatively, the quotes can drop toward 1.22200-1.22000.
The USD/CAD currency pair
- Prev Open: 1.32264
- Open: 1.31748
- % chg. over the last day: -0.43
- Day’s range: 1.31640 – 1.31769
- 52 wk range: 1.2727 – 1.3664
The USD/CAD currency pair continues to show a negative trend. On Friday, the quotes once again updated the local lows. CAD was supported by positive data on the Canadian labor market for the August. The trading tool found support at 1.31600. 1.31900 is already a “mirror” resistance. USD/CAD quotes can decline further. We recommend paying attention to the dynamics of oil quotes. Positions must be opened from key levels.
The Economic News Feed for 09.09.2019 is calm.

The price fixed below 50 MA and 100 MA, which signals the strength of sellers.
The MACD histogram is in the negative zone, but above the signal line, which gives a weak signal to sell USD/CAD.
The Stochastic Oscillator is in the neutral zone, the %K line crossed the %D line. There are no signals at the moment.
- Support levels: 1.31600, 1.31300
- Resistance levels: 1.31900, 1.32250, 1.32450
If the price consolidates below 1.31600, a further drop in the USD/CAD quotes is expected. The potential movement is to 1.31300-1.31000.
Alternatively the quotes could recover toward 1.32150-1.32400.
The USD/JPY currency pair
- Prev Open: 106.925
- Open: 106.824
- % chg. over the last day: -0.04
- Day’s range: 106.761 – 107.022
- 52 wk range: 104.97 – 114.56
The USD/JPY currency pair stabilized after a rather long growth last week. The trading instrument is currently consolidating. There is no defined trend. The local support and resistance levels are 106.700 and 107.000, respectively. Investors expect additional drivers. We recommend that you pay attention to the dynamics of yield on US government bonds. Positions must be opened from key levels.
Japan’s GDP growth in the second quarter met market expectations and amounted to 1.3% (y/y).

Indicators do not give accurate signals: the price crossed 50 MA.
The MACD histogram is near the 0 mark. There are no signals at the moment.
Stochastic Oscillator is in the neutral zone, the% K line crossed the% D line. There are no signals at this time.
- Support levels: 106.700, 106.300, 105.850
- Resistance levels: 107.000, 107.200, 107.500
If the price consolidates above 107.000, expect further growth toward 107.200-107.500.
Alternatively, the quotes can drop toward 106.450-106.200.
by JustForex