Author Archive for InvestMacro – Page 170

As the ECB dust settles – DAX30 CFD bulls emerge in control

By Admiral Markets

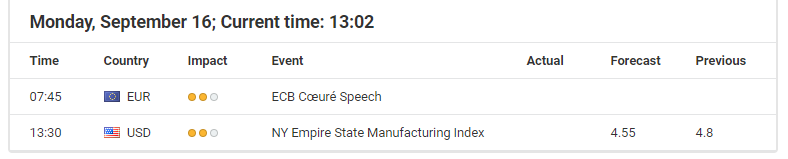
Source: Economic Events September 16, 2019 – Admiral Markets’ Forex Calendar

With the Economic calendar being quite thin as we begin the trading week, trading in the DAX30 CFD will be most likely driven by technical factors and the ECB decision’s aftermath.

Our view in general is that the ECB opened the door for further gains in the German index with the decision to cut the deposit rate to -0.5%, implementing a 2-tier system for reserve remuneration and especially re-launching QE at €20bn per month beginning November 1, and will, for as long as necessary, reinforce the accommodative impact of policy rates.

With the long sequence on H1 staying intact above 12,300 points, our target on the upside around 12,600/650 points stays active.

Only a drop below 12,300 points would darken the technical picture, switch the mode to neutral, activating the region around 12,180/200 points as a first target:

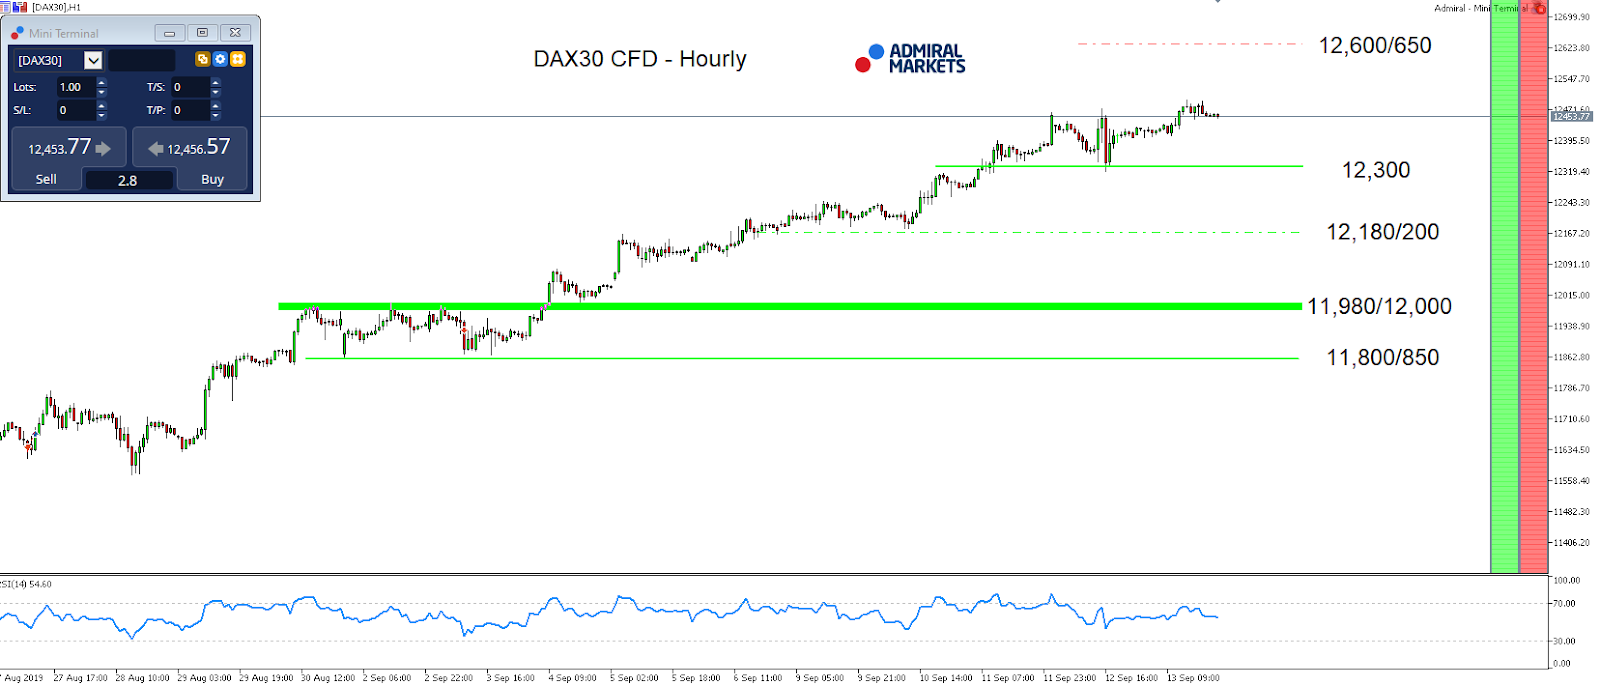
Source: Admiral Markets MT5 with MT5-SE Add-on DAX30 CFD Hourly chart (between August 26, 2019, to September 13, 2019). Accessed: September 13, 2019, at 10:00pm GMT

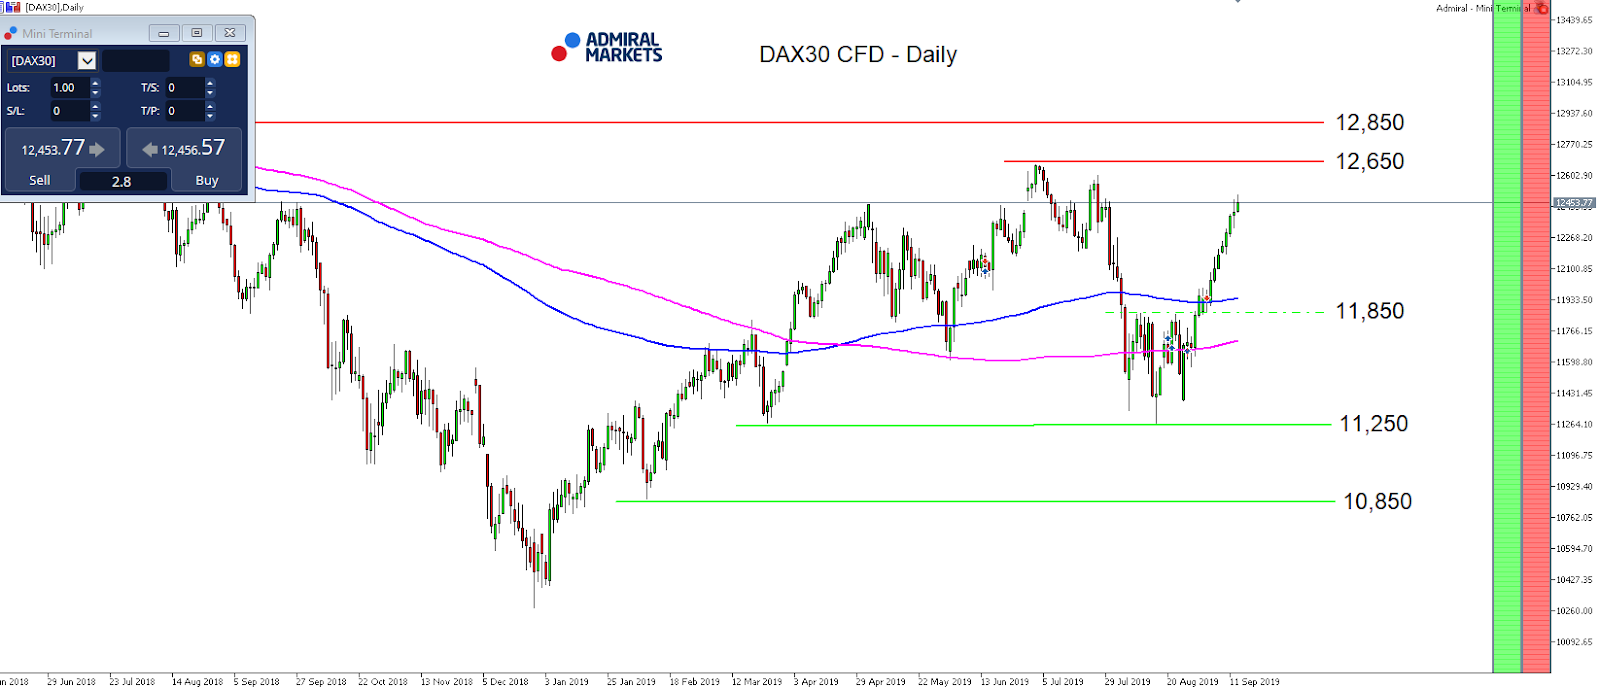
Source: Admiral Markets MT5 with MT5-SE Add-on DAX30 CFD Daily chart (between June 7, 2018, to September 13, 2019). Accessed: September 13, 2019, at 10:00pm GMT – Please note: Past performance is not a reliable indicator of future results, or future performance.

In 2014, the value of the DAX30 CFD increased by 2.65%, in 2015, it increased by 9.56%, in 2016, it increased by 6.87%, in 2017, it increased by 12.51%, in 2018, it fell by 18.26%, meaning that after five years, it was up by 10.5%.

Discover the world’s #1 multi-asset platform

Admiral Markets offers professional traders the ability to trade with a custom, upgraded version of MetaTrader 5, allowing you to experience trading at a significantly higher, more rewarding level. Experience benefits such as the addition of the Market Heat Map, so you can compare various currency pairs to see which ones might be lucrative investments, access real-time trading data, and so much more. Click the banner below to start your FREE download of MT5 Supreme Edition!

Download MetaTrader 5 and begin trading today!

Disclaimer: The given data provides additional information regarding all analysis, estimates, prognosis, forecasts or other similar assessments or information (hereinafter “Analysis”) published on the website of Admiral Markets. Before making any investment decisions please pay close attention to the following:

  1. This is a marketing communication. The analysis is published for informative purposes only and are in no way to be construed as investment advice or recommendation. It has not been prepared in accordance with legal requirements designed to promote the independence of investment research, and that it is not subject to any prohibition on dealing ahead of the dissemination of investment research.
  2. Any investment decision is made by each client alone whereas Admiral Markets shall not be responsible for any loss or damage arising from any such decision, whether or not based on the Analysis.
  3. Each of the Analysis is prepared by an independent analyst (Jens Klatt, Professional Trader and Analyst, hereinafter “Author”) based on the Author’s personal estimations.
  4. To ensure that the interests of the clients would be protected and objectivity of the Analysis would not be damaged Admiral Markets has established relevant internal procedures for prevention and management of conflicts of interest.
  5. Whilst every reasonable effort is taken to ensure that all sources of the Analysis are reliable and that all information is presented, as much as possible, in an understandable, timely, precise and complete manner, Admiral Markets does not guarantee the accuracy or completeness of any information contained within the Analysis. The presented figures refer that refer to any past performance is not a reliable indicator of future results.
  6. The contents of the Analysis should not be construed as an express or implied promise, guarantee or implication by Admiral Markets that the client shall profit from the strategies therein or that losses in connection therewith may or shall be limited.
  7. Any kind of previous or modeled performance of financial instruments indicated within the Publication should not be construed as an express or implied promise, guarantee or implication by Admiral Markets for any future performance. The value of the financial instrument may both increase and decrease and the preservation of the asset value is not guaranteed.
  8. The projections included in the Analysis may be subject to additional fees, taxes or other charges, depending on the subject of the Publication. The price list applicable to the services provided by Admiral Markets is publicly available from the website of Admiral Markets.
  9. Leveraged products (including contracts for difference) are speculative in nature and may result in losses or profit. Before you start trading, you should make sure that you understand all the risks.

By Admiral Markets

RoboMarkets Launches Trading Cloudflare Stocks

13 September, 2019 – Limassol, Cyprus. RoboMarkets is launching trading stocks of the American company Cloudflare Inc., which filed for an IPO and is expected to float on September 13th 2019 on the New York Stock Exchange (NYSE) with the NET ticker. From the very first trading session, RoboMarkets offers an opportunity to buy and sell both real stocks and CFDs on Cloudflare stocks in R Trader multi-asset platform.

Kiryl Kirychenka, RoboMarkets Product Manager: “Cloudflare is one of the global leaders in the SaaS segment. The company has great prospects in terms of its future growth and is of great interest from investment point of view. We are pleased to provide our clients with the opportunity to invest in Cloudflare shares from the very first day of trading”.

Cloudflare is the developer of a global cloud platform that provides companies with a set of services for protecting information and networking. At the last investment round in May 2019, Cloudflare was valued at $ 3.2 billion. The company’s revenue for the past 12 months is $ 234 million with a quarterly growth of 49% year-on-year.

About RoboMarkets

RoboMarkets is an investment company with the CySEC license No. 191/13. RoboMarkets offers brokerage services in many European countries by providing traders, who work on financial market, with access to its proprietary trading platforms. The Company’s clients have access to trading 8 types of assets and more than 11,700 trading instruments.

About R Trader

R Trader is brought to you by RoboMarkets and UMSTEL, a fintech company working on a cloud-based multi-market trading platform. R Trader enables access to over 11,000 instruments across 8 asset classes. This platform is user-friendly and guarantees maximum transaction transparency, while also being in line with the leading desktop trading terminals.


Trade Hopes Weigh On Gold

By Orbex

Despite some two way action, gold prices are ending the week in the red, as of writing. Earlier in the week, gold prices were weighed down by a firm recover in risk sentiment. It had improved in response to better relations between the US and China. Equities initially rallied on the news that the next set of Trump’s tariffs are postponed for two weeks. This was in line with reports that China was considering US agricultural purchases.

Later in the week, this theme developed further. Reports highlighted that the Trump administration is now considering offering China a limited trade deal. This would postpone further tariffs and even roll back some of the tariffs already in place. This would be in exchange for a commitment to intellectual property as well as agricultural purchases.

On Wednesday Trump announced that a 5% levy increase which was due to take effect as of October 1st, would now be postponed for two weeks. Trump said that China had asked for the delay and are also making plans to remover some of the tariffs on US goods. China released a list of 16 US imports which will now be exempt from tariffs. This includes anti-cancer drugs and animal feed.

Writing on Twitter, Trump said:

“on October 1st, we have agreed, as a gesture of goodwill, to move the increased Tariffs on 250 Billion Dollar’s worth of goods (25% to 30%), from October 1st to October 15th

News of Trump’s postponed tariffs comes ahead of the next round of US/China trade talks due this month. The markets are now hopeful that a deal (even a partial deal) can be done. The negative impact of the nearly two-year-long trade war has been clear around the globe. As central banks roll out fresh easing to deal with the global downturn there is even more pressure on both sides to return to normal trading conditions.

Technical Perspective

xauusd

The sell-off in gold this week, which saw the rejection from 1522.75 continue, has now taken gold back below the upper line of the bullish channel running from 2015 lows. While gold remains capped by the 1522.75 level, a further retracement lower could be in store. While above the 1434.81 highs, the focus remains on a further grind to the upside.

Silver

Silver prices have broadly tracked the moves in gold this week. Prices have come under pressure as risk sentiment improves, though are fighting to stay in the green as of writing. Indeed, expectations of a Fed rate cut this month and the potential for a weaker USD, are offering some support in the near term.

Additionally, downside linked to its relationship with gold is being partially offset by higher equities prices. This is given silver’s frequent industrial usage. Optimism over an interim US/China trade deal is helping keep equities prices well bid into the end of the week, lending some support to silver also.

Technical Perspective

xagusd

The burst above 18.6404 last week proved short-lived with price quickly retreating back below the level. However, the subsequent downside move has not broken back below the 17.6936 level. Above here, the focus is on a further push to the topside in the near term.

By Orbex

EUR Surges Despite Fresh ECB Easing

By Orbex

Dollar Dives Down

The US dollar weakened significantly over the European morning on Friday as optimism over a partial US/China trade deal led equities higher, taking some of the safe-haven bid out of USD. The fall comes despite data yesterday which showed core inflation rising to one year high in August. For now, however, the market is still expecting the Fed to ease this month though pricing for a further hike in 2019 is receding. USD index trades 97.59 last.

EUR Rallies Despite ECB Easing

EURUSD remains firmly bid today as the market continues to rally in the wake of the ECB announcing a wave of easing measures at yesterday’s September meeting. Despite both a cut to the deposit rate and the restarting of QE, it seems that some were expecting a more aggressive move, leading EURUSD back up to challenge the 1.1112 level last.

Fading No-Deal Brexit Risks Boost GBP

GBPUSD has been firmly bid today. Optimism around the receding chances of a no-deal Brexit happening by October 31st has caused a strong short squeeze in GBP. Law passed this week means that unless a deal (or a no-deal exit) can be approved by parliament by October 19th, the PM must request an extension to Article 50 until January 31st, 2020. GBPUSD trades 1.2463 last with price having broken firmly above the 1.2382 level.

Risk Sentiment Strong Into Weekend

Risk assets have remained well supported over the final European session of the week in light of a fresh wave of stimulus in Europe, growing optimism around both a potential US / China trade deal and the aversion of a no-deal Brexit. SPX500 trades 3019.30 last, with price making its way back up to near all-time highs. The prospect of further Fed easing is also keeping the outlook bullish in the near term.

Softer USD Supports Gold & JPY

Safe-havens have both been a little higher today, despite the rally in risk sentiment, as a weaker USD creates space to the upside in both JPY and gold. USDJPY trades 107.99 last as the bearish USD move has seen price pulling away from recent highs. XAUUSD trades 1507.74 last with price rallying back up following the recent rejection at the 1522.75 level.

Crude Rallies on USD Dip

Oil prices have recovered off initial lows on the day in light of the strong move lower in USD. Earlier this week, the EIA reported a large drawdown in US crude stores though this was upstaged by a set of bearish forecasts from OPEC, which is now considering further production cuts in December. Crude trades 55.03 last.

Commodity Currencies Supported

USDCAD has softened today given the weakness in USD and the recovery in oil. Price trades 1.3220 last, though still above the 1.3207 level for now. US data later today could still turn the tide for USD though the focus on improvements in global trade expectations is keeping CAD supported for now.

AUDUSD remains well supported today also. The growing optimism around US/China trade negotiations following Trump postponing the start of the next round of tariffs, as well as news of a potential interim trade deal, is helping keep AUD sentiment buoyant with price trading .6874 last.

By Orbex

Forex Technical Analysis & Forecast 13.09.2019 (EURUSD, GBPUSD, USDCHF, USDJPY, AUDUSD, USDRUB, USDCAD, GOLD, BRENT, BTCUSD)

Article By RoboForex.com

EURUSD, “Euro vs US Dollar”

After finishing the descending wave at 1.0927 and almost forming Double Bottom pattern, EURUSD has completed the ascending impulse towards 1.1085; right now, it is consolidating around 1.1056. If later the price breaks this range to the upside, the instrument may resume trading upwards with the target at 1.1185; if to the downside – then start another decline to reach 1.1000.

EURUSD
Risk Warning: the result of previous trading operations do not guarantee the same results in the future

GBPUSD, “Great Britain Pound vs US Dollar”

After completing the descending wave at 1.2288, GBPUSD has formed the ascending wave towards 1.2355. Possibly, today the pair may consolidate around 1.2343. If later the price breaks this range to the upside, the instrument may form one more ascending structure with the target at 1.2396; if to the downside – then start a new correction to reach 1.2300.

GBPUSD
Risk Warning: the result of previous trading operations do not guarantee the same results in the future

USDCHF, “US Dollar vs Swiss Franc”

USDCHF has finished the descending impulse at 0.9898; right now, it is consolidating around this level. According to the main scenario, the price may break the range downwards and fall with the target at 0.9849.

USDCHF
Risk Warning: the result of previous trading operations do not guarantee the same results in the future

USDJPY, “US Dollar vs Japanese Yen”

USDJPY is consolidating around 107.87. Today, the pair may form a new descending structure to reach 107.45 and then resume trading inside the uptrend with the target at 107.87.

USDJPY
Risk Warning: the result of previous trading operations do not guarantee the same results in the future

AUDUSD, “Australian Dollar vs US Dollar”

AUDUSD has completed the descending impulse towards 0.6860; right now, it is correcting to reach 0.6877. Possibly, today the pair may start another decline with the first target at 0.6828.

AUDUSD
Risk Warning: the result of previous trading operations do not guarantee the same results in the future

USDRUB, “US Dollar vs Russian Ruble”

USDRUB is moving downwards. Today, the pair may reach 64.44 and then resume trading upwards with the target at 64.84. Later, the market may continue moving downwards to reach 64.10.

USDRUB
Risk Warning: the result of previous trading operations do not guarantee the same results in the future

USDCAD, “US Dollar vs Canadian Dollar”

USDCAD is moving upwards to reach 1.3220. Possibly, the pair may reach this level and start a new correction towards 1.3190, at least. After that, the instrument may form one more ascending structure with the target at 1.3300.

USDCAD
Risk Warning: the result of previous trading operations do not guarantee the same results in the future

XAUUSD, “Gold vs US Dollar”

Gold is consolidating around 1505.50. If later the price breaks this range to the downside, the instrument may resume trading downwards with the target at 1487.20; if to the upside – then start another growth to reach 1526.60.

GOLD
Risk Warning: the result of previous trading operations do not guarantee the same results in the future

BRENT

Brent is moving upwards to reach 61.23. Later, the market may form a new descending structure towards 60.11 and then resume trading inside the uptrend with the first target at 63.60.

BRENT
Risk Warning: the result of previous trading operations do not guarantee the same results in the future

BTCUSD, “Bitcoin vs US Dollar”

BTCUSD is moving downwards with the target at 9800.00. After that, the instrument may form one more ascending structure towards 10180.00 and then resume trading inside the downtrend with the first target at 9500.00.

BTCUSD

Article By RoboForex.com

Attention!
Forecasts presented in this section only reflect the author’s private opinion and should not be considered as guidance for trading. RoboForex LP bears no responsibility for trading results based on trading recommendations described in these analytical reviews.

Fibonacci Retracements Analysis 13.09.2019 (BITCOIN, ETHEREUM)

Article By RoboForex.com

BTCUSD, “Bitcoin vs US Dollar”

As we can see in the daily chart, the correctional Triangle continues close to 38.2% fibo. If the price breaks the current resistance level and 23.6% fibo at 11375.00, BTCUSD will continue growing towards the high at 13857.20. At the same time, MACD lines are heading downwards, which means that the decline may yet continue towards 50.0% and 61.8% fibo at 8580.00 and 7350.00 respectively.

BTCUSD
Risk Warning: the result of previous trading operations do not guarantee the same results in the future

In the H4 chart, the pair is correcting to the upside after the convergence and has already reached 50.0% fibo. In the future, the correction may continue towards 61.8% fibo at 11170.00. The support is the low at 9322.70.

BTCUSD_H4
Risk Warning: the result of previous trading operations do not guarantee the same results in the future

ETHUSD, “Ethereum vs. US Dollar”

As we can see in the daily chart, the descending tendency reached 76.0% fibo and then there was a convergence on MACD. However, the pullback that started later can’t be called very significant. Still, the pullback may yet continue towards 61.8% and 50.0% fibo at 200.55 and 231.70 respectively. After breaking 163.20, the instrument may plummet to reach 100.03.

ETHEREUM
Risk Warning: the result of previous trading operations do not guarantee the same results in the future

The H4 chart shows more detailed structure of the current correction. By now, the pair has already reached 23.6% fibo. Later, the price may continue growing towards 38.2% and 50.0% fibo 192.54 and 201.60 respectively.

ETHUSD

Article By RoboForex.com

Attention!
Forecasts presented in this section only reflect the author’s private opinion and should not be considered as guidance for trading. RoboForex LP bears no responsibility for trading results based on trading recommendations described in these analytical reviews.

The Analytical Overview of the Main Currency Pairs on 2019.09.13

by JustForex

The EUR/USD currency pair

Technical indicators of the currency pair:
  • Prev Open: 1.10094
  • Open: 1.10638
  • % chg. over the last day: +0.42
  • Day’s range: 1.10554 – 1.10802
  • 52 wk range: 1.0931 – 1.1817

Yesterday, the EUR/USD currency pair showed high trading activity and volatility. The ECB, as expected, reduced the rate on deposit funds to -0.50% from -0.40%. The regulator plans to resume the quantitative easing program from November 1 in the amount of 20 billion euros per month. The central bank has also introduced a multi-level system of applying deposit rates to help European banks. Currently, EUR/USD quotes are consolidating. The key range is 1.10550-1.10850. We recommend opening positions from key levels.

At 15:30 (GMT+3:00), the financial market participants will evaluate the report on US retail sales.

EUR/USD

The price has fixed above 100 MA, which signals the strength of buyers.

The MACD histogram is located in the positive zone and above the signal line, which gives a strong signal to buy EUR/USD.

The Stochastic Oscillator is in the overbought zone, the %K line crossed the %D line. There are no signals at the moment.

Trading recommendations
  • Support levels: 1.10550, 1.10200, 1.09900
  • Resistance levels: 1.10850, 1.11000, 1.11300

If the price consolidates above the level of 1.10850, consider buying EUR/USD. The quotes will rise toward 1.11200-1.11400.

Alternatively, the quotes can descend toward 1.10300-1.10100.

The GBP/USD currency pair

Technical indicators of the currency pair:
  • Prev Open: 1.23173
  • Open: 1.23325
  • % chg. over the last day: +0.03
  • Day’s range: 1.23272 – 1.23713
  • 52 wk range: 1.1995 – 1.3385

GBP/USD is still trading flat. Unidirectional trends are not observed. At the moment, the following local support and resistance levels can be distinguished: 1.23250 and 1.23800, respectively. A trading instrument has the potential for further growth. Investors are waiting for new information on the UK exit from the EU. Today we recommend paying attention to retail sales data in the USA. Positions must be opened from key levels.

The news background on the UK economy is calm.

GBP/USD

Indicators do not provide accurate singals: 50 MA crossed 100 MA.

The MACD histogram is near the 0 mark.

Stochastic Oscillator is in the overbought zone, the %K line is above the %D line, which gives a weak signal to buy GBP/USD.

Trading recommendations
  • Support levels: 1.23250, 1.22900, 1.22550
  • Resistance levels: 1.23800, 1.24400

If the price consolidates above the resistance level of 1.23800, GBP/USD is expected to grow toward 1.24200-1.24400.

Alternatively, the qutoes can drop toward 1.22800-1.22600.

The USD/CAD currency pair

Technical indicators of the currency pair:
  • Prev Open: 1.31923
  • Open: 1.32041
  • % chg. over the last day: +0.13
  • Day’s range: 1.32026 – 1.32256
  • 52 wk range: 1.2727 – 1.3664

The USD/CAD currency pair continues to recover. The trading tool again updated local highs. The negative dynamics of oil quotes puts additional pressure on the Canadian dollar. CAD is currently testing a resistance level of 1.32250. 1.31900 is already a mirror support. We do not exclude further correction of the USD/CAD quotes. Today we recommend paying attention to economic releases from the USA. Positions must be opened from key levels.

The Economic News Feed for 13.09.2019 is calm.

USD/CAD

Indicators point to the strength of buyers: the price has fixed above 50 MA and 100 MA.

The MACD histogram is in the positive zone and continues to rise, indicating bullish sentiment.

Stochastic Oscillator is in the overbought zone, the %K line is above the %D line, which gives a weak signal to buy USD/CAD.

Trading recommendations
  • Support levels: 1.31900, 1.31600, 1.31350
  • Resistance levels: 1.32250, 1.32450, 1.32800

If the price consolidates above 1.32250, expect further correction to 1.32500-1.32700.

Alternatively, the quotes could drop to 1.31700-1.31500.

The USD/JPY currency pair

Technical indicators of the currency pair:
  • Prev Open: 107.812
  • Open: 108.080
  • % chg. over the last day: +0.33
  • Day’s range: 107.980 – 108.259
  • 52 wk range: 104.97 – 114.56

The USD/JPY currency pair stabilized after a protracted rally. The trading instrument is currently consolidating. There is no defined trend. The local support and resistance levels are 107.850 and 108.250, respectively. In the near future, technical correction is not ruled out. Today we recommend that you pay attention to economic releases, as well as the dynamics of yield on US government bonds. Positions must be opened from key levels.

The Economic News Feed for 13.09.2019 is quite calm.

USD/JPY

Indicators signal the strength of buyers: the price has fixed above 50 MA and 100 MA.

The MACD histogram is in the positive zone, but below the signal line, which gives a weak signal to buy USD/JPY.

The Stochastic Oscillator is in the neutral zone, the %K line is below the %D line, which indicates the correction of USD / JPY quotes.

Trading recommendations
  • Support levels: 107.850, 107.500, 107.150
  • Resistance levels: 108.250, 108.500

If the price consolidates below 107.850, expect a correction to 107.500-107.300.

Alternatively, the quotes could increase toward 108.500-108.700.

by JustForex

European Central Bank Eases Monetary Policy Again

by JustForex

Yesterday, the ECB meeting was a key event in the financial markets. There were high trading activity and volatility on the EUR/USD currency pair. The regulator, as expected, reduced the deposit rate by 10 basis points to -0.50%. The Central Bank lowered its forecast for GDP growth and inflation in the Eurozone for the current and next years. The ECB plans to resume the quantitative easing program of 20 billion euros a month from November 1. The Central Bank has also introduced a multi-level system of applying deposit rates to help European banks. Donald Trump has criticized the Fed for a “strong” dollar after the ECB meeting.

Demand for “safe haven” currencies is still low enough amid optimistic news on the settlement of trade disputes between Washington and Beijing. The US President said that he did not exclude the conclusion of an interim agreement with China. We recommend following current information on this issue. Today, investors will assess the report on US retail sales.

The bearish sentiment prevails in the “black gold” market. Currently, futures for the WTI crude oil are testing the $54.75 mark per barrel. Today we recommend paying attention to data on oil rig count in the US at 20:00 (GMT+3:00).

Market Indicators

Yesterday, the main US stock indexes closed in the green zone: #SPY (+0.35%), #DIA (+0.23%), #QQQ (+0.42%).

The 10-year US government bonds yield has been growing. At the moment, the indicator is at the level of 1.79-1.80%.

The Economic News Feed for 13.09.2019:
  • At 15:30 (GMT+3:00), statistics on retail sales will be published in the US.

by JustForex

US Retail Sales to be a trigger from the Fed, to push Gold next week?

By Admiral Markets

Source: Economic Events September 13, 2019 – Admiral Markets’ Forex Calendar

With the continuous signs over the last few days that the US and China are set to return to negotiating on trade, 10-year US Treasury yields kept on bouncing from their lows of around 1.5%, while Gold saw a corrective move and dropped below 1,500 USD.

Today’s release of the US Retail Sales data could, in fact, trigger further bearish momentum in the precious metal if and surprises like the ones we saw last month, are repeated again this month. In August, Retail Sales numbers came in at 0.7% against 0.3% (MoM), and are expected to come in this month at 0.2%.

Still, we shouldn’t expect volatility to shoot up significantly with all eyes already being on the Fed Rate decision next Wednesday.

From the technical perspective, on a daily time-frame, the latest drop back below 1,500 USD is in our opinion no big deal.

As long as Gold trades above 1,380 USD, we consider the precious metal to be bullish with a potential mid-term long trigger around 1,440/450 USD and with an overall potential target around 1,650/700 USD in the weeks to come.

Source: Admiral Markets MT5 with MT5-SE Add-on Gold Daily chart (between June 14, 2018, to September 12, 2019). Accessed: September 12, 2019, at 10:00pm GMT – Please note: Past performance is not a reliable indicator of future results, or future performance.

In 2014, the value of Gold fell by 1.7%, in 2015, it fell by 10.4%, in 2016, it increased by 8.1%, in 2017, it increased by 13.1%, in 2018, it fell by 1.6%, meaning that after five years, it was up by 6.4%.

Discover the world’s #1 multi-asset platform

Admiral Markets offers professional traders the ability to trade with a custom, upgraded version of MetaTrader 5, allowing you to experience trading at a significantly higher, more rewarding level. Experience benefits such as the addition of the Market Heat Map, so you can compare various currency pairs to see which ones might be lucrative investments, access real-time trading data, and so much more. Click the banner below to start your FREE download of MT5 Supreme Edition!

Download MetaTrader 5 and begin trading today!

Disclaimer: The given data provides additional information regarding all analysis, estimates, prognosis, forecasts or other similar assessments or information (hereinafter “Analysis”) published on the website of Admiral Markets. Before making any investment decisions please pay close attention to the following:

  1. This is a marketing communication. The analysis is published for informative purposes only and are in no way to be construed as investment advice or recommendation. It has not been prepared in accordance with legal requirements designed to promote the independence of investment research, and that it is not subject to any prohibition on dealing ahead of the dissemination of investment research.
  2. Any investment decision is made by each client alone whereas Admiral Markets shall not be responsible for any loss or damage arising from any such decision, whether or not based on the Analysis.
  3. Each of the Analysis is prepared by an independent analyst (Jens Klatt, Professional Trader and Analyst, hereinafter “Author”) based on the Author’s personal estimations.
  4. To ensure that the interests of the clients would be protected and objectivity of the Analysis would not be damaged Admiral Markets has established relevant internal procedures for prevention and management of conflicts of interest.
  5. Whilst every reasonable effort is taken to ensure that all sources of the Analysis are reliable and that all information is presented, as much as possible, in an understandable, timely, precise and complete manner, Admiral Markets does not guarantee the accuracy or completeness of any information contained within the Analysis. The presented figures refer that refer to any past performance is not a reliable indicator of future results.
  6. The contents of the Analysis should not be construed as an express or implied promise, guarantee or implication by Admiral Markets that the client shall profit from the strategies therein or that losses in connection therewith may or shall be limited.
  7. Any kind of previous or modeled performance of financial instruments indicated within the Publication should not be construed as an express or implied promise, guarantee or implication by Admiral Markets for any future performance. The value of the financial instrument may both increase and decrease and the preservation of the asset value is not guaranteed.
  8. The projections included in the Analysis may be subject to additional fees, taxes or other charges, depending on the subject of the Publication. The price list applicable to the services provided by Admiral Markets is publicly available from the website of Admiral Markets.
  9. Leveraged products (including contracts for difference) are speculative in nature and may result in losses or profit. Before you start trading, you should make sure that you understand all the risks.

By Admiral Markets

Weakening Shale Productivity “VERY Bullish” For Oil Prices

By OilPrice.com

After years of improvements in drilling techniques and impressive “efficiency gains,” there is now evidence that the U.S. shale industry is reaching the end of the road on well productivity.

A report earlier this month from Raymond James & Associates finds that the U.S. shale industry may struggling to achieve further productivity gains. If these improvements begin to fizzle out, it could result in “an inflection point in future global oil supply/demand balances,” the investment bank said.

Well productivity is “tracking WAY below our model,” analysts Marshall Adkins and John Freeman wrote in the report. They note that U.S. oil production is up less than 100,000 bpd over the first seven months of 2019, compared to the 600,000-bpd increase over the same period in 2018.

The analysts note that over the past eight years, Raymond James has been one of the most aggressive forecasters for U.S. shale growth, and even then, actual output tended to exceed their forecasts. But this year U.S. shale growth is significantly below their prediction.

The reason is that productivity improvements have suddenly come to an end. Since 2010, initial production rates for the first 30 days of production (IP-30) improved by 30 percent annually on average, according to Raymond James. That was largely the result of the “bigger hammer” approach, the bank said. In other words, drillers threw more of everything at the problem – more money, longer laterals, more sand, and more frac stages. Earlier this decade, IP-30 rates were growing by roughly 40 percent per year. But that slowed to 11 percent in 2017 and 15 percent last year.

However, in the first seven months of 2019, IP-30 rates are up only 2 percent, compared to the 10 percent prediction from Raymond James. Part of the reason is that there is simply a limit to “more, longer and bigger,” the analysts said. “We believe that this represents clear evidence that U.S. well productivity gains are beginning to reach maximum limits and may even roll over in the coming years as the industry struggles to offset well interference issues and rock quality deterioration.” Even 2018 figures may have been a “one-off” increase as the oil majors – Chevron and ExxonMobil – escalated activity.

But perhaps the first 30 days is too short of a timeframe to analyze well productivity. So, the investment bank looked at 90 days of production (IP-90). On that metric, the industry is faring even worse, showing an outright decline of 2 percent in the first half of the year compared to the first six months of 2018.

“Recent Permian IP-90 well productivity trends are especially dire,” the analysts wrote. “While U.S. IP-90s declined 2%, Permian IP-90s declined 10% relative to 2018.” Because the Permian is the largest source of shale production and the most important source of growth, whatever happens there will determinate the trajectory for U.S. production figures on the whole.

Raymond James said that a slight uptick in productivity on an IP-30 basis but a decline on an IP-90 basis suggests that well interference is taking a toll. In other words, shale well performance is suffering as time goes on because wells have been spaced too close together. “Put another way, the average decline curve is becoming steeper than we thought because the wells are starting to cannibalize each other,” the analysts wrote.

Problems with “parent-child” well interference have become more of a concern over the past year or so, which refers to the first well drilled within a given block (the parent well), and subsequent wells drilled (the child wells). As Raymond James notes, not only do they cannibalize each other, but the longer the parent is online, the more the block sees a drop in pressure.

But here’s the thing – a lot of companies have drilled parent wells on various tracts, incentivized to do so because their leases can expire if they don’t demonstrate activity. They held off on the child wells, focusing on drilling parents. Then, at a later point, they go back and drill child wells to squeeze more oil from their acreage. The problem is that so much of the output growth over the last few years came from parent wells. Going forward, the growth will need to increasingly come from the less productive child wells.

But as Raymond James notes, the longer they wait, the less productive the child wells become, because the area loses more and more pressure over time.

In specific terms, the average child well is 30 percent less productive than the parent. But a child well drilled six months after the parent may only see a 10 percent degradation in productivity, while a two-year delay might result in more substantial 40 percent reduction in productivity.

On the other hand, the “cube development” approach, which entails intense development all at the same time, also has problems. Cube development consists of multiple wells, often rising to more than a dozen, are drilled pretty much simultaneously to avoid well interference and pressure decline. Also, in theory, costs are lower because it takes less time, while shared infrastructure reduces costs as well.

But well interference still occurs, and a growing number of companies have reported disappointing results, suggesting that there are limits to density. In a high-profile admission just a few weeks ago, Concho Resources said its 23-well “Dominator” project proved disappointing. The company said it would space out its projects more. Raymond James says there is some middle ground on well-density that companies still need to figure out, but because the industry has boasted about ever-increasing well-density, the pullback is translating into stagnating productivity.

Ultimately, the investment bank says that because of weaker-than-expected productivity, U.S. oil production may only grow by around 350,000 bpd in 2020, versus the market consensus of around 1.5 million barrels per day. In a scenario in which productivity actually falls to zero, production would remain flat for the next few years.

Because “the single most important driver of the oil market over the next decade will be trends in U.S. well productivities,” Raymond James analysts wrote, this is “VERY bullish for oil prices next year.”

“Given that the oil market seems to be pricing in virtually unlimited U.S. oil supply growth at $50/bbl over the next five years, the implications…are very, very important to upside oil price surprises over the coming years.”

Link to article: https://oilprice.com/Energy/Crude-Oil/Weakening-Shale-Productivity-VERY-Bullish-For-Oil-Prices.html

By Nick Cunningham of Oilprice.com