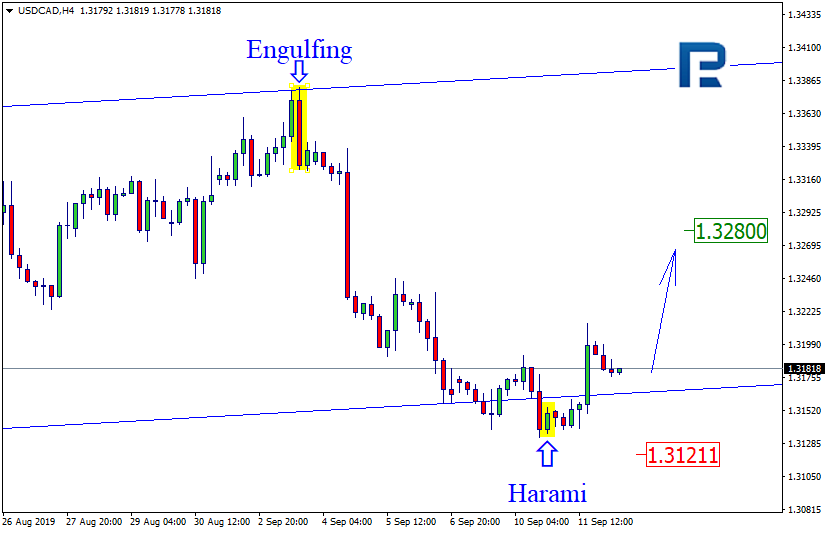
As we can see in the H4 chart, USDCAD continues trading close to the rising channel’s downside border and forming reversal patterns. Right now, the pair is trying to reverse after forming Harami pattern. At the moment, it may be assumed that the price may complete a slight correction and resume growing towards 1.3280. However, we shouldn’t ignore a possibility that the instrument may update the low and continue its decline to reach 1.3121.
AUDUSD, “Australian Dollar vs US Dollar”
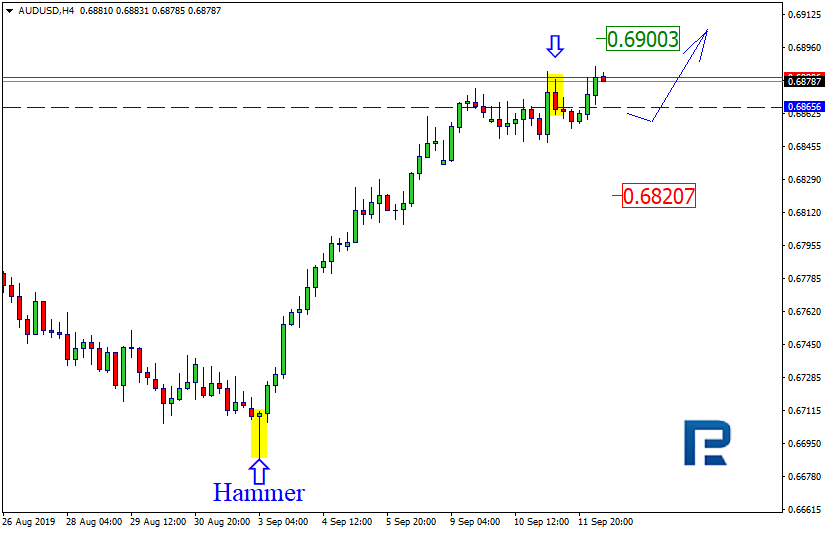
As we can see in the H4 chart, AUDUSD is trading close to the resistance level and forming reversal patterns, including Harami. The pair wasn’t able to reverse and updated the high instead. Judging by the previous movements, we may assume that the price may continue trading upwards to reach 0.6900. However, we shouldn’t ignore a possibility that the instrument may resume falling 0.6820.
Attention! Forecasts presented in this section only reflect the author’s private opinion and should not be considered as guidance for trading. RoboForex LP bears no responsibility for trading results based on trading recommendations described in these analytical reviews.
In the H4 chart, USDCHF is expected to test the resistance at 3/8, rebound from it, and then resume falling towards the support at 1/8. However, this scenario may no longer be valid if the price breaks 3/8 to the upside. After that, the instrument may continue growing towards the resistance at 4/8.
In the M15 chart, the pair may break the downside line of the VoltyChannel indicator and, as a result, move downwards to reach the support at 1/8 from the H4 chart.
XAUUSD, “Gold vs US Dollar”
In the H4 chart, XAUUSD is moving below 8/8. In this case, the price is expected to continue falling to reach the support at 7/8. However, this scenario may no longer be valid if the price breaks 8/8 to the upside. After that, the instrument may continue growing towards the resistance at +1/8.
As we can see in the M15 chart, the pair has broken the downside line of the VoltyChannel indicator and, as a result, may continue its decline.
Attention! Forecasts presented in this section only reflect the author’s private opinion and should not be considered as guidance for trading. RoboForex LP bears no responsibility for trading results based on trading recommendations described in these analytical reviews.
The single currency fell to a weekly low against the US dollar before today’s ECB meeting. It is expected that the regulator will reduce the rate on deposit funds to -0.50% from -0.40%. Experts also predict that the Central Bank may announce the introduction of additional measures to stimulate the economy. We recommend that you pay attention to the comments and rhetoric of the ECB representatives. Currently, the EUR/USD currency pair is consolidating. The key trading range is 1.09900-1.10200. Positions must be opened from these marks.
The price fixed below 50 and 100 MA, which signals the strength of sellers.
The MACD histogram is in the negative zone, but above the signal line, which gives a weak signal to sell GBP/USD.
The Stochastic Oscillator is in the neutral zone, the %K line began to cross the %D line. There are no signals at the moment.
Trading recommendations
Support levels: 1.09900, 1.09600, 1.09300
Resistance levels: 1.10200, 1.10500, 1.10650
If the price consolidates above the level of 1.10200, consider purchasing EUR/USD. The price is expected to rise to 1.10500-1.10700.
Alternatively, the quotes can decrease toward 1.09600-1.09400.
The GBP/USD currency pair
Technical indicators of the currency pair:
Prev Open: 1.23447
Open: 1.23173
% chg. over the last day: -0.11
Day’s range: 1.23173 – 1.23361
52 wk range: 1.1995 – 1.3385
The GBP/USD currency pair continues to consolidate. There is no defined trend. The key support and resistance levels are 1.23100 and 1.23800, respectively. In the near future, technical correction of the trading instrument is rather possible. Market participants are waiting for new information regarding the Brexit process. Today we recommend paying attention to economic releases from the USA. Positions must be opened from key levels.
The Economic News Feed for 12.09.2019 is calm.
Indicators do not give accurate signals: the price crossed 50 MA and 100 MA.
The MACD histogram is near 0.
The Stochastic Oscillator is in the neutral zone, the %K line crossed the %D line. There are no signals at the moment.
Trading recommendations
Support levels: 1.23100, 1.22550, 1.22100
Resistance levels: 1.23800, 1.24400
If the price consolidates below the support level of 1.23100, expect a correction toward 1.22600-1.22400.
Alternatively, the quotes can grow toward 1.24000-1.24300.
The USD/CAD currency pair
Technical indicators of the currency pair:
Prev Open: 1.31528
Open: 1.31923
% chg. over the last day: +0.25
Day’s range: 1.31770 – 1.32000
52 wk range: 1.2727 – 1.3664
The USD/CAD currency pair began to recover. The trading tool has updated local highs. CAD came under pressure after a sharp collapse in oil prices during yesterday’s trading. At the moment, the key support and resistance levels are: 1.31650 and 1.32000, respectively. USD/CAD quotes have the potential for further correction. Today we recommend paying attention to economic releases from the USA. Positions must be opened from key levels.
The news background on the Canadian economy is calm.
Indicators do not give accurate signals: the price is consolidating near 50 MA and 100 MA.
The MACD histogram is in the positive zone, but below the signal line, which gives a weak signal to buy USD/CAD.
The Stochastic Oscillator is in the neutral zone, the %K line is above the %D line, which indicates further correction of the USD/CAD quotes.
Trading recommendations
Support levels: 1.31650, 1.31350, 1.31000
Resistance levels: 1.32000, 1.32250, 1.32450
If the price consolidates above the round level of 1.32000, expect further correction toward 1.32250-1.32450.
Alternatively, the quotes could drop to 1.31400-1.31200.
The USD/JPY currency pair
Technical indicators of the currency pair:
Prev Open: 107.538
Open: 107.812
% chg. over the last day: +0.43
Day’s range: 107.775 – 108.168
52 wk range: 104.97 – 114.56
The USD/JPY currency pair continues to show a steady uptrend. The trading tool again updated local highs. USD/JPY found resistance at 108.150. Mark 107.800 is already a “mirror” support. In the near future, technical correction is not ruled out. Today we recommend paying attention to the news background from the USA. Positions must be opened from key levels.
During the Asian trading session, positive data on business activity in the Japanese services sector were published.
Indicators signal the strength of buyers: the price has fixed above 50 MA and 100 MA.
The MACD histogram is in the positive zone and above the signal line, indicating bullish sentiment.
The Stochastic Oscillator is in the neutral zone, the %K line is below the %D line, which indicates a possible correction of the USD/JPY currency pair.
Trading recommendations
Support levels: 107.800, 107.500, 107.150
Resistance levels: 108.150, 108.500
If the price consolidates above 108.150, expect further growth toward 108.500-108.700.
Alternatively, the quotes could drop toward 107.600-107.400.
Yesterday, the US dollar recovered part of the losses against a basket of world currencies. The dollar index (#DX) closed the trading session in the green zone (+0.33%). Positive economic releases from the US supported the greenback. In August, the core producer price index rose by 0.3% (m/m), which was higher than the market expectations of 0.2% (m/m). Today, investors will assess data on inflation in the US.
Financial market participants are focused on today’s ECB meeting. It is expected that the Central Bank will reduce the deposit rate to -0.50% from -0.40%. Experts also forecast that the regulator may announce the introduction of additional measures to stimulate the Eurozone economy. We recommend paying attention to the comments by the ECB representatives.
Investors continue to monitor the trade relations between the US and China. The partners took steps to resolve trade disputes, which further weakened demand for the safe-haven currencies. Beijing has exempted 16 categories of US goods from additional tariffs. At the same time, Donald Trump said on Twitter that he would delay the tariff increase on Chinese imports scheduled for October by two weeks.
There are aggressive sales in the “black gold” market. Currently, futures for the WTI crude oil are testing the $55.35 mark per barrel.
Market Indicators
Yesterday, the bullish sentiment prevailed in the US stock markets: #SPY (+0.71%), #DIA (+0.85%), #QQQ (+0.94%).
The 10-year US government bonds yield has moved away from local highs. At the moment, the indicator is at the level of 1.72-1.73%.
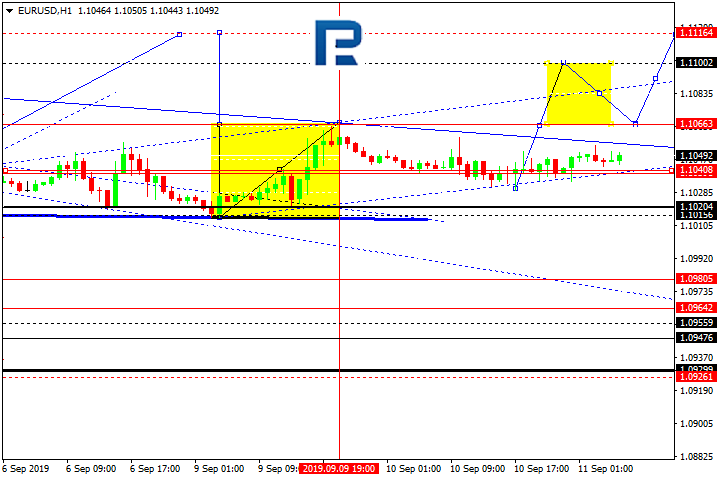
EURUSD is still consolidating around 1.1039. Today, the pair may choose an alternative scenario to form one more ascending structure to break 1.1066 and then continue growing to reach 1.1116. According to the main scenario, the price may start plunging at any moment to reach 1.0950.
GBPUSD, “Great Britain Pound vs US Dollar”
GBPUSD is consolidating around 1.2343. Possibly, today the pair may choose an alternative scenario to start another growth to break 1.2383 and then continue trading upwards to reach 1.2454. According to the main scenario, the price may start plummeting at any moment towards 1.2111.
USDCHF, “US Dollar vs Swiss Franc”
USDCHF is still consolidating around 0.9919. Today, the pair may grow to break 0.9939 and then continue trading upwards with the first target at 0.9950.
USDJPY, “US Dollar vs Japanese Yen”
USDJPY is moving upwards. Possibly, today the pair may reach 107.83 and then form a new descending structure with the target at 107.47.
AUDUSD, “Australian Dollar vs US Dollar”
AUDUSD is consolidating around 0.6858. Today, the pair may form one more ascending structure to break 0.6870 and then continue trading upwards the target at 0.6892.
USDRUB, “US Dollar vs Russian Ruble”
USDRUB is consolidating around 65.42. Possibly, today the pair may reach 65.17 and then resume trading upwards with the first target at 65.65. If later the price breaks this range to the upside, the instrument may form one more ascending structure towards 66.16.
USDCAD, “US Dollar vs Canadian Dollar”
USDCAD is moving downwards. Today, the pair may form a new descending structure to reach 1.3126 and then start another growth to break 1.3186. After that, the instrument may continue trading upwards with the target at 1.3300.
XAUUSD, “Gold vs US Dollar”
Gold has reached the first downside target at 1484.88. Possibly, the pair may form one more ascending structure towards 1506.30 and then start a new correction to reach 1495.50. Later, the market may resume trading upwards with the target at 1526.50.
BRENT
Brent has formed the consolidation range around 62.62. Possibly, today the pair may start another growth with the predicted target at 65.10. Later, the market may correct to return to 62.62 and then resume trading inside the uptrend towards 67.65.
BTCUSD, “Bitcoin vs US Dollar”
BTCUSD is moving downwards. Today, the pair may fall to reach 9866.00 and then form one more ascending structure to return to 10180.00. After that, the instrument may continue trading inside the downtrend with the predicted target at 9500.00.
Attention! Forecasts presented in this section only reflect the author’s private opinion and should not be considered as guidance for trading. RoboForex LP bears no responsibility for trading results based on trading recommendations described in these analytical reviews.
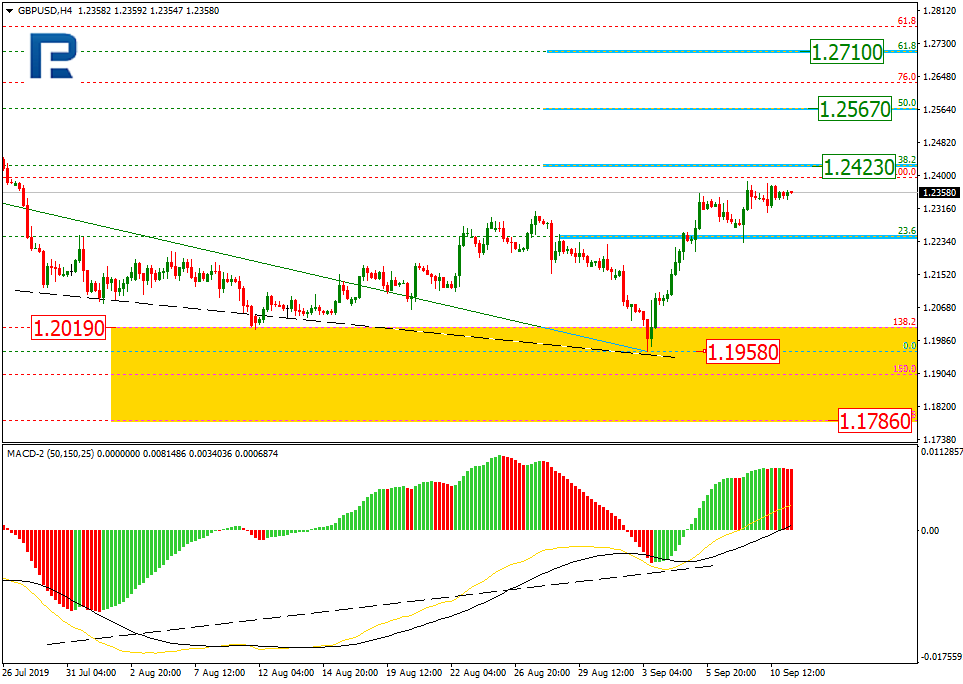
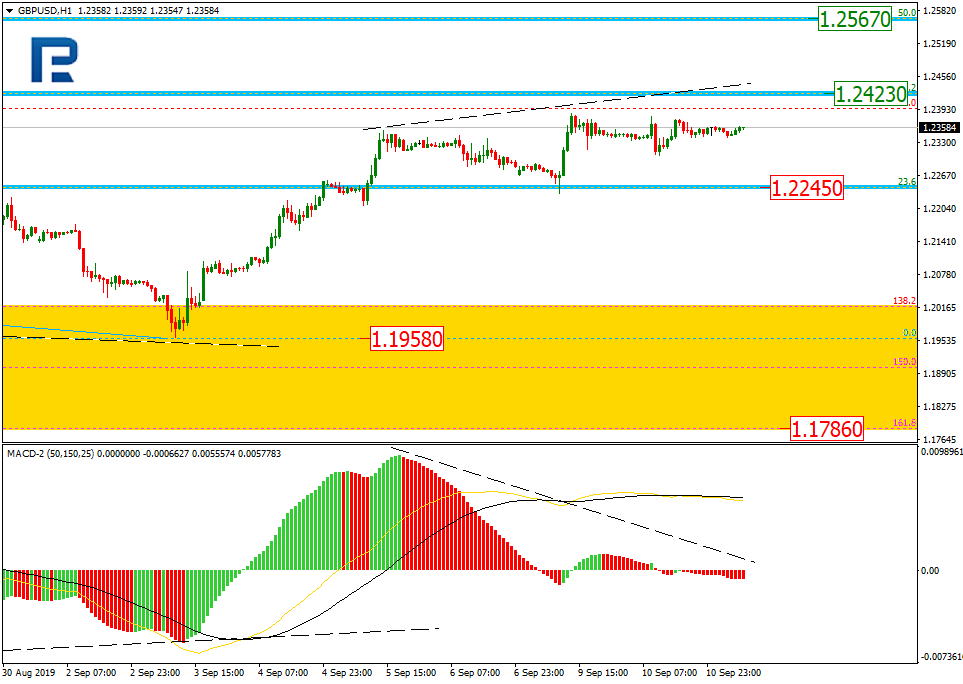
As we can see in the H4 chart, after testing the post-correctional extension area between 138.2% and 161.8% fibo at 1.2019 and 1.1786 respectively, GBPUSD is trading upwards and has already reached 38.2% fibo at 1.2423. The next upside targets may be 50.0% and 61.8% fibo at 1.2567 and 1.2710 respectively. The key support is at 1.1958.
In the H1 chart, the pair is slowing down on its way towards 38.2% fibo at 1.2423 because of the convergence on MACD, which may indicate a new correction soon. The target of this pullback may be 23.6% fibo at 1.2245.
EURJPY, “Euro vs. Japanese Yen”
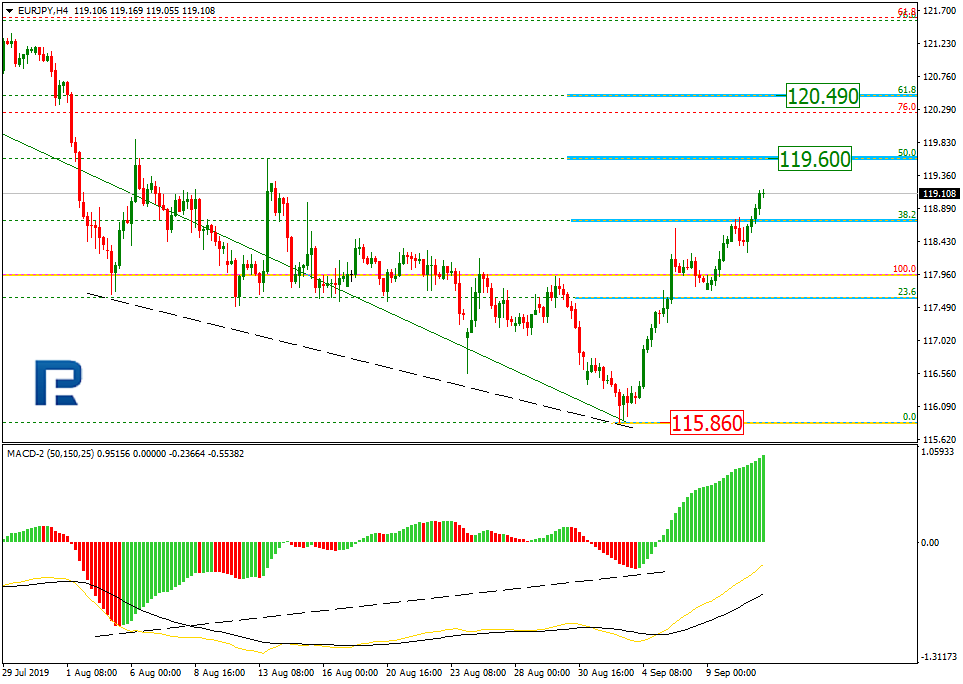
As we can see in the H4 chart, the convergence made EURJPY start a quick correctional uptrend, which is getting close to 50.0% fibo at 119.60. The next upside target may be 61.8% fibo at 120.49. The key support is the low at 115.86.
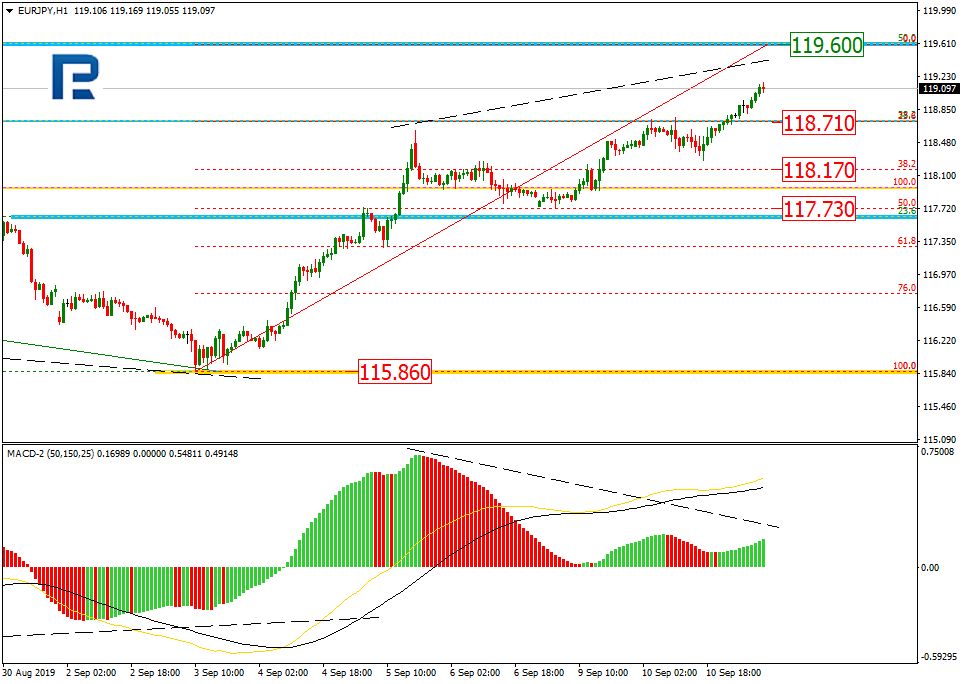
In the H1 chart, there is a divergence within the uptrend on MACD. After reaching 50.0% fibo at 119.60, the instrument is expected to start a new correction towards 23.6%, 38.2%, and 50.0% fibo at 118.71, 118.17, and 117.73 respectively.
Attention! Forecasts presented in this section only reflect the author’s private opinion and should not be considered as guidance for trading. RoboForex LP bears no responsibility for trading results based on trading recommendations described in these analytical reviews.
The EUR/USD currency pair continues to trade in a flat. The technical picture is ambiguous. The key support and resistance levels are: 1.10200 and 1.10600, respectively. Participants in financial markets took a wait and see attitude before the ECB meeting, which will be held on September 12. Experts predict that the regulator will take a number of measures to stimulate the economy. Today we expect important economic releases from the USA. We recommend opening positions from key levels.
At 15:30 (GMT+3:00), the US will publish a manufacturer’s price index.
Indicators do not give accurate signals: 50 MA crossed 100 MA.
The MACD histogram is located near 0 mark.
The Stochastic Oscillator is in the neutral zone, the %K line crossed the %D line. There are no signals at the moment.
Trading recommendations
Support levels: 1.10200, 1.09900, 1.09600
Resistance levels: 1.10600, 1.10850, 1.11150
If the price consolidates above 1.10600, expect further growth toward 1.11000.
Alternatively, the quotes can descend toward 1.09900-1.09700.
The GBP/USD currency pair
Technical indicators of the currency pair:
Prev Open: 1.23431
Open: 1.23447
% chg. over the last day: +0.03
Day’s range: 1.23405 – 1.23676
52 wk range: 1.1995 – 1.3385
The GBP/USD currency pair has stabilized after a long rally since the beginning of this month. The pound is currently consolidating. GBP/USD quotes are testing the local support and resistance levels at 1.23150 and 1.23800, respectively. We do not exclude further growth of the trading instrument. Additional support for sterling is provided by positive data on the labor market. Today we recommend paying attention to the news background from the USA. Positions must be opened from key levels.
The Economic News Feed for 11.09.2019:
Indicators point to the strength of buyers: the price has fixed above 50 MA and 100 MA.
The MACD histogram is in the positive zone, but below the signal line, which gives a weak signal to buy GBP/USD.
The Stochastic Oscillator is in the neutral zone, the %K line is above the %D line, which also indicates bullish sentiment.
Trading recommendations
Support levels: 1.23150, 1.22550, 1.22100
Resistance levels: 1.23800, 1.24400
If the price consolidates above 1.23800, expect further growth toward 1.24200-1.24400.
Alternatively, the quotes can drop toward 1.22600-1.22400.
The USD/CAD currency pair
Technical indicators of the currency pair:
Prev Open: 1.31654
Open: 1.31528
% chg. over the last day: -0.18
Day’s range: 1.31398 – 1.31528
52 wk range: 1.2727 – 1.3664
The USD/CAD currency pair continues to consolidate near two-month lows. Unidirectional trends are not observed. Investors expect additional drivers. At the moment, the local support and resistance levels are: 1.31350 and 1.31650, respectively. In the near future, technical correction of the trading instrument is not ruled out. Today we recommend that you pay attention to economic data from the United States, as well as the dynamics of oil prices. Positions must be opened from key levels.
The Economic News Feed for 11.09.2019 is calm.
The price fixed below 50 MA and 100 MA, which signals the strength of sellers.
The MACD histogram is in the negative zone, which also indicates a bearish sentiment.
The Stochastic Oscillator is in the neutral zone, the %K line crossed the %D line. There are no signals at the moment.
Trading recommendations
Support levels: 1.31350, 1.31000
Resistance levels: 1.31650, 1.31900, 1.32250
If the price consolidates below 1.31350, expect a further drop toward 1.31000-1.30800.
Alternatively, the quotes can recover toward 1.32000.
The USD/JPY currency pair
Technical indicators of the currency pair:
Prev Open: 107.241
Open: 107.538
% chg. over the last day: +0.33
Day’s range: 107.492 – 107.847
52 wk range: 104.97 – 114.56
The USD/JPY currency pair still demonstrates a pronounced upward trend. The yen hit 5-week lows against the US currency. Demand for safe assets remains low. At the moment, USD/JPY quotes are testing a local resistance of 107.850. Mark 107.500 is already a mirror support. A trading instrument has the potential for further growth. We recommend that you pay attention to the dynamics of yield on US government bonds. Positions must be opened from key levels.
The Economic News Feed for 11.09.2019 is calm.
Indicators signal the strength of buyers: the price has fixed above 50 MA and 100 MA.
The MACD histogram is in the positive zone and above the signal line, indicating bullish sentiment.
The Stochastic Oscillator is in the overbought zone, the% K line crossed the% D line. There are no signals at the moment.
Trading recommendations
Support levels: 107.500, 107.150, 106.850
Resistance levels: 107.850, 108.250
If the price consolidates above 107.850, expect further growth toward 108.200-108.400.
Alternatively, the quotes could drop toward 107.300-107.100.
The US dollar did not change much against a basket of major currencies. The USD index (#DX) ended the trading session with a slight growth (+ 0.06%). It became known that China is going to free a number of American goods from the 25% fee. The list includes 16 types of goods. China is also considering a new list of goods that will not be subject to duties. The changes will take effect on September 17, 2019. Investors continue to monitor the development of trade relations between the United States and China.
The attention of experts as a whole is focused on the ECB meeting , which will be held tomorrow. It is expected that the regulator will lower the rate on deposit funds from -0.40% to -0.50%. Investors also expect that some measures will be taken to stimulate the eurozone economy. According to Bloomberg, more than 80% of economists expect the ECB to announce the start of a quantitative easing program at tomorrow’s meeting.
The British pound continued to strengthen against the US currency thanks to the publication of positive economic reports. Thus, the average level of wages including premiums increased in July by 4.0% instead of 3.7%. The number of applications for unemployment benefits rose to 28.2K, although experts predicted an increase to 29.3K.
Prices for oil continued to rise. WTI crude oil futures are currently testing $58.20 per barrel. At 17:30 (GMT+3:00), US crude oil inventories will be published.
Market Indicators
Yesterday, mixed trends were observed on the US stock markets: #SPY (-0.02%), #DIA (+ 0.22%), #QQQ (-0.29%).
Yields on the US government 10-year bonds continue to recover. At the moment, the indicator is at the level of 1.73-1.74%.
The Economic News Feed for 11.09.2019:
– US manufacturer`s price index – 15:30 (GMT + 3: 00).
NEWS &VIEWS Forecasts, Commentary & Analysis on the Economy and Precious Metals Celebrating our 46th year in the gold business
By USAGold.com
Bank of England governor Mark Carney, in something of a shocker, told the recent Jackson Hole central bankers’ conference that the world’s reliance on the US dollar ‘won’t hold’ and needs to be replaced by a new international monetary and financial system based on many more global currencies,” according to a Financial Times report. The greatest impact of Carney’s bombshell, though, came not from his opinion on the look and feel of some futuristic global monetary system. It came instead from his seeming tacit approval of the escalating movement to dethrone the dollar as the world’s reserve currency in the here and now. A good many in that audience were no doubt surprised – even rattled – by Carney’s remarks.
“Something is going on,” said St. Louis Fed President James Bullard in a Financial Times report, “and that’s causing I think a total rethink of central banking and all our cherished notions of what we think we’re doing. We just have to stop thinking that next year things are going to be normal.” To which FT added: “Interest rates are not going back up anytime soon, the role of the dollar is under scrutiny – both as a haven asset and as a medium of exchange – and trade uncertainty has become a permanent feature of policymaking.”
That about sums it up. The dollar at the moment is something of a Humpty Dumpty in the global monetary system – sitting on his wall oblivious and seemingly immune to all that goes on around him. Whether or not there will someday be a Great Fall remains to be seen, but increasingly, as Carney’s speech illustrates, forces are lining up against it.
“[H]istory,” Carney concludes, “teaches that the transition to a new global reserve currency may not proceed smoothly. Consider the rare example of the shift from sterling to the dollar in the early 20th Century – a shift prompted by changes in trade and reinforced by developments in finance. The disruption wrought by the First World War allowed the US to expand its presence in markets previously dominated by European producers. Trade that was priced in sterling switched to being priced in dollars; and demand for dollar-denominated assets followed. In addition, the US became a net creditor, lending to other countries in dollar-denominated bonds.” In other words, it laid the foundation for the so-called American Century that followed.
A similar transition now could impact the dollar and dollar-denominated assets just as it did sterling and sterling-denominated assets at the turn of the 20th century. Though few believe the dollar can be fully replaced with something else at this juncture, many believe that its influence could erode – or that the old could gradually give way to something new and different. In fact, as you are about to read, some see it as a process that has already begun.
De-dollarization boosts central bank gold purchases
Among the broad effects of the nascent de-dollarization movement has been to significantly boost central bank demand. The World Gold Council reports 651 metric tonnes in new gold purchases during 2018 – the highest level since the Bretton Woods Agreement was abandoned in 1971. China, Russia, Poland, and Hungary head the list of central banks adding gold to their central bank reserves in 2018 and 2019.
In a recent interview with the World Gold Council, Dr. Duvvuri Subbarao, former governor of the Reserve Bank of India, explains the connection between “de-dollarization” and central bank gold acquisitions. “In the immediate aftermath of the crisis,” he says, “we had to sell dollars to prevent our currency going into freefall. During Quantitative Easing, we had to buy dollars to protect our financial stability. And when the Federal Reserve began to taper QE, exchange rates slumped again and we had to defend ourselves with our reserves. All these events prompted one obvious question – is there an alternative to the dollar?”
“It is clear,” he goes on, “that gold is a risk diversifier – a hedge against not just financial risk but also political risk. It is also a long-term store of wealth. As such central banks, especially those from emerging markets, can increasingly see the merits of adding gold to their reserves. Over time, therefore, I am confident that gold’s role will increase among central banks.”
Chart courtesy of the World Gold Council
Currency problems stoke Asian physical gold demand
McKinsey & Co, the global consulting firm, warned in late August that a new Asian debt crisis might be in the making. Not surprisingly, gold is priced at all-time highs in a number of Asian currencies including the Japanese yen, India rupee and the Chinese yuan. It is also at all-time highs against the Malaysian ringgit and the Indonesian rupiah. Jayant Bhandari, the founder of Capitalism and Morality, provides some thought-provoking insights on the origins and sustainability of Asian gold demand. “Most of these people don’t really understand what is happening outside their boundaries,” says Bhandari, “so they have no option but to buy gold, silver, and currencies of Western countries. And that is why I think support for precious metals will continue to increase going forward. I don’t know what influence it will have in pricing, but really, if I had to suggest to someone on how to preserve his wealth, my suggestion would primarily be focused on gold and silver.”
If you think you could benefit from a concise review of the latest news, analysis, and opinion on the gold market from a variety of expert sources, then News & Views is the newsletter for you. Since the early 1990s, we have offered it free-of-charge as a monthly service to our regular clientele and as an incentive to prospective clients. By subscribing, you will automatically receive future editions and occasional in-depth Special Reports by e-mail.
A word on USAGOLD – USAGOLD ranks among the most reputable gold companies in the United States. Founded in the 1970s and still family-owned, it is one of the oldest and most respected names in the gold industry. USAGOLD has always attracted a certain type of investor – one looking for a high degree of reliability and market insight coupled with a professional client (rather than customer) approach to precious metals ownership. We are large enough to provide the advantages of scale, but not so large that we do not have time for you. (We invite your visit to the Better Business Bureau website to review our five-star, zero-complaint record. The report includes a large number of verified customer reviews.)
Disclaimer – Opinions expressed on the USAGOLD.com website do not constitute an offer to buy or sell, or the solicitation of an offer to buy or sell any precious metals product, nor should they be viewed in any way as investment advice or advice to buy, sell or hold. USAGOLD, Inc. recommends the purchase of physical precious metals for asset preservation purposes, not speculation. Utilization of these opinions for speculative purposes is neither suggested nor advised. Commentary is strictly for educational purposes, and as such USAGOLD does not warrant or guarantee the accuracy, timeliness or completeness of the information found here.
Michael J. Kosares is the founder of USAGOLD and the author of The ABCs of Gold Investing – How to Protect and Build Your Wealth With Gold. He is also editor and commentator for USAGOLD’s Live Daily Newsletter and editor of the News & Views monthly newsletter.
Even though the economic calendar is thin on Wednesday and volatility in Equities and FX markets subdued with awaiting the ECB rate decision on Thursday, one can clearly feel tensions among market participants – also in, at first glance, “ECB-uncorrelated” currency pairs like the USD/JPY.
After the NFPs Into the last weekly close came in mixed (130k vs 160k expected, but Average Hourly Earnings (MoM) were 0.4% against 0.3%), the USD/JPY bulls held the currency pair next to the crucial region around 106.80/107.
If the attempt to recapture 107.00 is sustainable, a further stint up to 108.50/109.00 is an option, especially if speculation of a favourable trade deal between the US and China for both sides start to manifest over the next days and weeks.
But now our thinking: not only that any new “Twitter escalation” from US president Trump ala “Sure, we aim on a favourable deal – for the US! China will pay!” could dampen the hopes and speculation that the US and China will agree on a deal and likely see a sharper drop from the current levels, identifying the current run above 107 a fake-out.
We should also remember that the very expansive monetary policy of the ECB and negative yield developments in European, especially German, bonds, have been a topic in Trump’s tweets several times over the last few weeks.
That said, a very dovish ECB on Thursday could realistically result in a new tirade from Trump, also bringing up speculation of an outright US currency market intervention or US Secretary of the Treasury Mnuchin saying something like “The US has no longer a strong US dollar policy”.
Both cases would be very bearish for the US-Dollar and push the USD/JPY sharply lower.
Here a drop below 105.80 could trigger here a wave of further selling and quickly activate the region around 105.00 again:
Source: Admiral Markets MT5 with MT5-SE Add-on USD/JPY Daily chart (between June 12, 2018, to September 10, 2019). Accessed: September 10, 2019, at 10:00pm GMT – Please note: Past performance is not a reliable indicator of future results, or future performance.
In 2014, the value of USDJPY increased by 13.7%, in 2015, it increased by 0.5%, in 2016, it fell by 2.8%, in 2017, it fell by 3.6%, in 2018, it fell by 2.7%, meaning that after five years, it was up by 4.1%.
Discover the world’s #1 multi-asset platform
Admiral Markets offers professional traders the ability to trade with a custom, upgraded version of MetaTrader 5, allowing you to experience trading at a significantly higher, more rewarding level. Experience benefits such as the addition of the Market Heat Map, so you can compare various currency pairs to see which ones might be lucrative investments, access real-time trading data, and so much more. Click the banner below to start your FREE download of MT5 Supreme Edition!
Disclaimer: The given data provides additional information regarding all analysis, estimates, prognosis, forecasts or other similar assessments or information (hereinafter “Analysis”) published on the website of Admiral Markets. Before making any investment decisions please pay close attention to the following:
This is a marketing communication. The analysis is published for informative purposes only and are in no way to be construed as investment advice or recommendation. It has not been prepared in accordance with legal requirements designed to promote the independence of investment research, and that it is not subject to any prohibition on dealing ahead of the dissemination of investment research.
Any investment decision is made by each client alone whereas Admiral Markets shall not be responsible for any loss or damage arising from any such decision, whether or not based on the Analysis.
Each of the Analysis is prepared by an independent analyst (Jens Klatt, Professional Trader and Analyst, hereinafter “Author”) based on the Author’s personal estimations.
To ensure that the interests of the clients would be protected and objectivity of the Analysis would not be damaged Admiral Markets has established relevant internal procedures for prevention and management of conflicts of interest.
Whilst every reasonable effort is taken to ensure that all sources of the Analysis are reliable and that all information is presented, as much as possible, in an understandable, timely, precise and complete manner, Admiral Markets does not guarantee the accuracy or completeness of any information contained within the Analysis. The presented figures refer that refer to any past performance is not a reliable indicator of future results.
The contents of the Analysis should not be construed as an express or implied promise, guarantee or implication by Admiral Markets that the client shall profit from the strategies therein or that losses in connection therewith may or shall be limited.
Any kind of previous or modeled performance of financial instruments indicated within the Publication should not be construed as an express or implied promise, guarantee or implication by Admiral Markets for any future performance. The value of the financial instrument may both increase and decrease and the preservation of the asset value is not guaranteed.
The projections included in the Analysis may be subject to additional fees, taxes or other charges, depending on the subject of the Publication. The price list applicable to the services provided by Admiral Markets is publicly available from the website of Admiral Markets.
Leveraged products (including contracts for difference) are speculative in nature and may result in losses or profit. Before you start trading, you should make sure that you understand all the risks.