Author Archive for InvestMacro – Page 168

Ichimoku Cloud Analysis 19.09.2019 (AUDUSD, NZDUSD, USDCAD)

Article By RoboForex.com

AUDUSD, “Australian Dollar vs US Dollar”

AUDUSD is trading at 0.6786; the instrument is moving below Ichimoku Cloud, thus indicating a descending tendency. The markets could indicate that the price may test the cloud’s downside border at 0.6805 and then resume moving downwards to reach 0.6695. Another signal to confirm further descending movement is the price’s rebounding from the rising channel’s downside border. However, the scenario that implies further decline may be canceled if the price breaks the cloud’s upside border and fixes above 0.6845. In this case, the pair may continue growing towards 0.6925.

AUDUSD
Risk Warning: the result of previous trading operations do not guarantee the same results in the future

NZDUSD, “New Zealand Dollar vs US Dollar”

NZDUSD is trading at 0.6309; the instrument is moving below Ichimoku Cloud, thus indicating a descending tendency. The markets could indicate that the price may test the cloud’s downside border at 0.6325 and then resume moving downwards to reach 0.6220. Another signal to confirm further descending movement is the price’s rebounding from the resistance level. However, the scenario that implies further decline may be canceled if the price breaks the cloud’s upside border and fixes above 0.6350. In this case, the pair may continue growing towards 0.6425.

NZDUSD
Risk Warning: the result of previous trading operations do not guarantee the same results in the future

USDCAD, “US Dollar vs Canadian Dollar”

USDCAD is trading at 1.3283; the instrument is moving above Ichimoku Cloud, thus indicating an ascending tendency. The markets could indicate that the price may test the cloud’s downside border at 1.3255 and then resume moving upwards to reach 1.3415. Another signal to confirm further ascending movement is the price’s rebounding from the descending channel’s upside border. However, the scenario that implies further growth may be canceled if the price breaks the cloud’s downside border and fixes below 1.3230. In this case, the pair may continue falling towards 1.3145.

USDCAD

Article By RoboForex.com

Attention!
Forecasts presented in this section only reflect the author’s private opinion and should not be considered as guidance for trading. RoboForex LP bears no responsibility for trading results based on trading recommendations described in these analytical reviews.

Investors Assess the Fed Interest Rate Decision

by JustForex

The US dollar strengthened against a basket of major currencies after the Fed meeting. Yesterday, the regulator lowered its key interest rate by 25 basis points to 1.75%-2.00%, as experts forecasted. The regulator also updated macroeconomic forecasts. In particular, the forecast for US GDP growth for 2019 was improved to 2.2% instead of 2.1%, for 2021 – to 1.9% from 1.8%. The dollar index (#DX) closed the trading session with a slight increase (+0.32%).

The Bank of Japan has decided on a key interest rate during the Asian trading session. Thus, the regulator left the indicator unchanged at the level of -0.10%, as experts expected. At the same time, the management of the Bank of Japan noted a slowdown in the economies of other countries of the world, which reduced the likelihood for Japan to achieve the inflation target of 2%.

Yesterday, First Minister of Scotland, Nicola Sturgeon, said at a press conference in Berlin that in the case of Brexit, Scotland intended to remain part of the EU. The official expressed hope that Britain would not leave the bloc, however, if this happens, their country should have the opportunity to express its position and article of an independent EU country.

The “black gold” prices have been growing. Currently, futures for the WTI crude oil are testing the $58.45 mark per barrel.

Market Indicators

Yesterday, there was a variety of trends in the US stock markets: #SPY (-0.06%), #DIA (-0.15%), #QQQ (-0.04%).

The 10-year US government bonds yield rose slightly. At the moment, the indicator is at the level of 1.78-1.79%.

The Economic News Feed for 19.09.2019:
  • – SNB interest rate decision at 10:30 (GMT+3:00);
  • – Retail sales in the UK at 11:30 (GMT+3:00);
  • – BoE interest rate decision at 14:00 (GMT+3:00);
  • – Philadelphia Fed manufacturing index at 15:30 (GMT+3:00);
  • – Existing home sales in the US at 17:00 (GMT+3:00).

by JustForex

A divided U.S. Fed means that investors need to stay fully diversified

By George Prior

Today’s rate cut and the accompanying statement from the U.S. Federal Reserve mean that investors must stay fully invested and diversified if they’re serious about building and safeguarding their wealth, warns the boss of the world’s largest independent financial advisory organization.

The warning from Nigel Green, founder and CEO of deVere Group comes as the U.S. central bank cut its main interest rates by 25 basis points on Wednesday – but it held back from signalling more cuts could be on their way in December.

Mr Green notes: “The rate cut was widely expected given deflationary pressures driven by the recent weak U.S. manufacturing data, the simmering trade tensions with China and the mounting geopolitical issues in the Middle East.

“The real interest, however, was in the accompanying statement over future rates.

“There’s much uncertainty amongst economists, and within the Fed itself.  It’s an unusual environment.

“Despite immense pressure from President Trump to cut rates further, to provide rocket fuel to the economy ahead of next year’s election, the Fed appears conscious that the labour market is tight and fears wage inflation will kick in.

“Also, with the U.S. economy experiencing around 2 per cent growth, which is fairly decent, the Fed is exercising caution over further precautionary rate cuts at this time.”

He continues: “Stock markets wanted the Fed to err on the side of caution and promise more cuts and, as such, markets may fall accordingly.

“The U.S. dollar had today’s rate cut priced-in, but will rise on the Fed’s silence over future cuts.”

Mr Green goes on to conclude: “With a divided U.S. central bank, investors must stay fully invested and diversified if they’re serious about building and safeguarding their wealth.

“As ever in times of volatility, there are winners and losers, opportunities and risks.

“A good fund manager will help investors best position themselves in this regard.”

About:

deVere Group is one of the world’s largest independent advisors of specialist global financial solutions to international, local mass affluent, and high-net-worth clients.  It has a network of more than 70 offices across the world, over 80,000 clients and $12bn under advisement.


Forex Technical Analysis & Forecast 18.09.2019 (EURUSD, GBPUSD, USDCHF, USDJPY, AUDUSD, USDRUB, USDCAD, GOLD, BRENT, BTCUSD)

Article By RoboForex.com

EURUSD, “Euro vs US Dollar”

EURUSD has completed the ascending structure at 1.1074; right now, it is consolidating. Possibly, the pair may move downwards to reach 1.1050. Later, the market may grow towards 1.1084 and then resume trading downwards with the target at 1.1034.

EURUSD
Risk Warning: the result of previous trading operations do not guarantee the same results in the future

GBPUSD, “Great Britain Pound vs US Dollar”

GBPUSD has finished the ascending structure at 1.2525; right now, it is correcting towards 1.2466. After that, the instrument may start a new growth with the target at 1.2524.

GBPUSD
Risk Warning: the result of previous trading operations do not guarantee the same results in the future

USDCHF, “US Dollar vs Swiss Franc”

USDCHF is consolidating below 0.9938. Today, the pair may fall to break 0.9823 and then continue moving downwards to reach 0.9809. Later, the market may start another growth with the target at 0.9955.

USDCHF
Risk Warning: the result of previous trading operations do not guarantee the same results in the future

USDJPY, “US Dollar vs Japanese Yen”

USDJPY is consolidating around 108.14. Possibly, today the pair may form a new descending structure to reach 107.93 and then resume trading inside the uptrend with the target at 108.44.

USDJPY
Risk Warning: the result of previous trading operations do not guarantee the same results in the future

AUDUSD, “Australian Dollar vs US Dollar”

AUDUSD is forming the third descending impulse with the target at 0.6825. Later, the market may start another growth towards 0.6856 and then resume trading downwards to reach 0.6787.

AUDUSD
Risk Warning: the result of previous trading operations do not guarantee the same results in the future

USDRUB, “US Dollar vs Russian Ruble”

USDRUB is correcting. Possibly, the pair may reach 64.60 and then start a new decline towards the first target at 63.30.

USDRUB
Risk Warning: the result of previous trading operations do not guarantee the same results in the future

USDCAD, “US Dollar vs Canadian Dollar”

USDCAD is consolidating above 1.3250. If later the price breaks this range to the upside at 1.3250, the instrument may form one more ascending structure to reach 1.3290; if to the downside at 1.3233 – start a new decline with the target at 1.3211.

USDCAD
Risk Warning: the result of previous trading operations do not guarantee the same results in the future

XAUUSD, “Gold vs US Dollar”

Gold is consolidating above 1497.70 without any particular direction. Possibly, today the pair may fall towards 1483.88 and then start a new growth to return to 1497.70. Later, the market may resume trading downwards with the target at 1470.68.

GOLD
Risk Warning: the result of previous trading operations do not guarantee the same results in the future

BRENT

Brent has completed the correction at 64.00. Today, the pair may grow towards 67.60 and then form a new descending structure to reach 65.70. After that, the instrument may resume trading inside the uptrend with the target at 71.30.

BRENT
Risk Warning: the result of previous trading operations do not guarantee the same results in the future

BTCUSD, “Bitcoin vs US Dollar”

BTCUSD is still consolidating above 10180.00 without any particular direction. Possibly, today the pair may move downwards to reach 9853.00 and then resume growing to return to 10180.00. After that, the instrument may form a new descending structure with the target at 9800.00.

BITCOIN

Article By RoboForex.com

Attention!
Forecasts presented in this section only reflect the author’s private opinion and should not be considered as guidance for trading. RoboForex LP bears no responsibility for trading results based on trading recommendations described in these analytical reviews.

Fibonacci Retracements Analysis 18.09.2019 (GBPUSD, EURJPY)

Article By RoboForex.com

GBPUSD, “Great Britain Pound vs US Dollar”

As we can see in the daily chart, after trading inside the post-correctional extension area between 138.2% and 161.8% fibo at 1.2019 and 1.1786 respectively for a while, GBPUSD has started a new rising movement due to the convergence, which is now getting closer to 50.0% fibo at 1.2565. The next upside target may be 61.8% fibo at 1.2710. The key support is the low at 1.1958.

GBPUSD_D1
Risk Warning: the result of previous trading operations do not guarantee the same results in the future

In the H4 chart, the pair is slowing down on its way towards 50.0% fibo at 1.2565 because of the convergence on MACD, which may indicate a new correction soon after the price reaches its targets. The targets of this pullback may be 23.6%, 38.2%, and 50.0% fibo at 1.2394, 1.2332, and 1.2262 respectively.

GBPUSD_H4
Risk Warning: the result of previous trading operations do not guarantee the same results in the future

EURJPY, “Euro vs. Japanese Yen”

As we can see in the H4 chart, the convergence made EURJPY start a quick correctional uptrend, which is slowing down at 50.0% fibo. The next upside targets may be 61.8% and 76.0% fibo at 120.50 and 121.56 respectively. The key support is the low at 115.86.

EURJPY_H4
Risk Warning: the result of previous trading operations do not guarantee the same results in the future

In the H1 chart, there was a divergence within the uptrend on MACD, which made the pair start a new pullback towards 23.6% fibo. However, as long as the price is moving below the high at 120.01, there is a possibility of a new descending correction towards 38.2% and 50.0% fibo at 118.43 and 117.45 respectively.

EURJPY_H1

Article By RoboForex.com

Attention!
Forecasts presented in this section only reflect the author’s private opinion and should not be considered as guidance for trading. RoboForex LP bears no responsibility for trading results based on trading recommendations described in these analytical reviews.

The Analytical Overview of the Main Currency Pairs on 2019.09.18

by JustForex

The EUR/USD currency pair

Technical indicators of the currency pair:
  • Prev Open: 1.09997
  • Open: 1.10718
  • % chg. over the last day: +0.66
  • Day’s range: 1.10515 – 1.10756
  • 52 wk range: 1.0931 – 1.1817

Since the beginning of this week, trading on the EUR/USD currency pair has been very active. At the same time, there is no defined trend. Currently, EUR/USD quotes are consolidating. The local support and resistance levels are 1.10500 and 1.10750, respectively. Participants in financial markets took a wait and see attitude before the Fed meeting. The regulator is expected to reduce the key interest rate range by 25 basis points to 1.75% -2.00%. We recommend that you pay attention to the comments and rhetoric of representatives of the Central Bank. The Fed may indicate a further pace of monetary policy adjustment. Positions must be opened from key levels.

The Economic News Feed for 18.09.2019:

  • – The consumer price index in the eurozone is 12:00 (GMT + 3: 00);
  • – statistics on the real estate market in the USA – 15:30 (GMT + 3: 00);
  • – decision on the Fed interest rate – 21:00 (GMT + 3: 00).
EUR/USD

Indicators do not give accurate signals: 50 MA crossed 100 MA.

The MACD histogram is in the positive zone, but below the signal line, which gives a weak signal to buy EUR/USD.

Stochastic Oscillator is in the oversold zone, the %K line crossed the %D line. There are no signals at the moment.

Trading recommendations
  • Support levels: 1.10500, 1.10200, 1.09900
  • Resistance levels: 1.10750, 1.11100, 1.11300

If the price consolidates above the level of 1.10750, consider buying EUR/USD as the price rises to 1.11100-1.11400.

Alternatively, the quotes can decrease toward 1.1200-1.09900.

The GBP/USD currency pair

Technical indicators of the currency pair:
  • Prev Open: 1.24248
  • Open: 1.24957
  • % chg. over the last day: +0.58
  • Day’s range: 1.24616 – 1.25064
  • 52 wk range: 1.1995 – 1.3385

An ambiguous technical picture has developed on the GBP/USD currency pair. The trading instrument is currently consolidating. Pound is testing key extremes. The local support and resistance levels are: 1.24450 and 1.25000, respectively. Investors expect the Fed to decide on a key interest rate. We also recommend keeping track of up-to-date information regarding the Brexit process. In the near future, technical correction of GBP / USD quotes after a protracted rally is not ruled out. Positions must be opened from key levels.

At 11:30 (GMT+3:00) UK will publish an inflation report.

GBP/USD

The price has fixed above 100 MA, which signals the strength of buyers.

The MACD histogram is in the positive zone, but below the signal line, which gives a weak signal to buy GBP/USD.

The Stochastic Oscillator is in the neutral zone, the %K line is above the %D line, which indicates bullish sentiment.

Trading recommendations
  • Support levels: 1.24450, 1.24000, 1.23650
  • Resistance levels: 1.25000, 1.25250

If the price consolidates above the round level of 1.25000, consider buying GBP/USD as the price moves toward 1.25500-1.25700.

Alternatively, it could decrease to 1.24000-1.23700.

The USD/CAD currency pair

Technical indicators of the currency pair:
  • Prev Open: 1.32392
  • Open: 1.32432
  • % chg. over the last day: +0.04
  • Day’s range: 1.32407 – 1.32674
  • 52 wk range: 1.2727 – 1.3664

CAD continues to trade in a flat. There is no defined trend. At the moment, key support and resistance levels can be identified at 1.32350 and 1.32700, respectively. Investors are waiting for the Fed meeting and important economic releases from Canada and the United States. We also recommend monitoring the situation in the oil market. Positions must be opened from these marks.

At 15:30 (GMT+3:00) Canada will publish an inflation report.

USD/CAD

Indicators point to the strength of buyers: the price has fixed above 50 MA and 100 MA.

The MACD histogram has started to rise again, indicating a bullish sentiment.

The Stochastic Oscillator is near the overbought zone, the %K line crossed the %D line. There are no signals at the moment.

Trading recommendations
  • Support levels: 1.32350, 1.32100, 1.31800
  • Resistance levels: 1.32700, 1.33000

If the price consolidates above 1.32700, expect further growth toward 1.33000-1.33200.

Alternatively, the quotes could drop toward 1.32000.

The USD/JPY currency pair

Technical indicators of the currency pair:
  • Prev Open: 108.148
  • Open: 108.115
  • % chg. over the last day: -0.02
  • Day’s range: 108.086 – 108.273
  • 52 wk range: 104.97 – 114.56

The USD/JPY currency pair is still in sideways movement. The technical picture is ambiguous. Participants in financial markets expect additional drivers. At the moment, the local support and resistance levels are: 107.900 and 108.300, respectively. In the near future, the correction of USD/JPY quotes after a long growth is not ruled out. We recommend that you pay attention to the dynamics of yield on US government bonds. Positions must be opened from key levels.

During the Asian trading session, Japan published an optimistic report on the trading balance.

USD/JPY

Indicators do not give accurate signals: 50 MA crossed 100 MA.

The MACD histogram is in the positive zone, which signals a bullish mood.

The Stochastic Oscillator is in the neutral zone, the %K line is below the %D line, which gives a signal to sell USD/JPY.

Trading recommendations
  • Support levels: 107.900, 107.500, 107.150
  • Resistance levels: 108.300, 108.500

If the price consolidates below 107.900, expect a correction toward 107.500-107.200.

Alternatively, the quotes can grow toward 108.600-108.800.

by JustForex

Fed facing a dilemma at today’s rate decision – where will the USD/JPY be headed?

By Admiral Markets

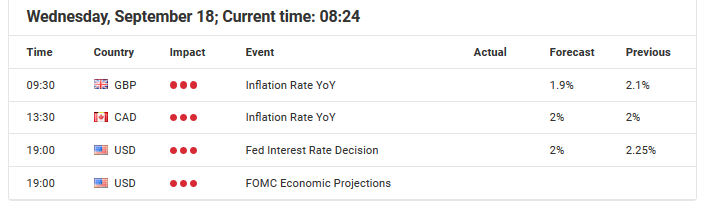
Source: Economic Events September 18, 2019 – Admiral Markets’ Forex Calendar

Today, all eyes will be on the Fed rate decision. This is particularly true, as the BoJ rate decision also occurs from Wednesday to Thursday.

In regards to the Fed, the Fed Watch Tool shows that market participants expect a rate cut by 25 basis points with around 80% probability, what means that the main focus of market participants will be concerned with what will be delivered in the Fed statement.

Will the Fed dot plot suggest FOMC members to see further rate cuts in the upcoming 12 – 18 months? Where will the economic projections be, especially with the ongoing tensions in the trade dispute between the US and China.

And after the latest developments in Saudi Arabia, where an attack on Saudi oil facilities responsible for 5% of global supply and resulted in the biggest intra-day percentage gain in oil since the Gulf War in 1991, a near-term pick-up in inflation seems very likely.

The Fed could be assumed to not just reflect the state of the US, but also global economic growth (due to an ongoing trade war between the US and China), rising inflation, on the other hand, leaves the US central bank in a dilemma.

So, it is difficult to say which direction the USD/JPY will be headed after the Fed, but we would assume that a more dovish stance in the Fed’s overall rate outlook could trigger USD/JPY weakness.

We will probably have to wait until the BoJ delivers their statement, but our assumption is that one of the main drivers for the USD/JPY to gain further momentum after recapturing 106.80/107.00 over the last week was not only the (at least felt) de-escalation of the US-Chinese trade dispute.

But also rumours made rounds that the BoJ could consider cutting rates into deeper negative territory. Such a step is among the key options of the BoJ, although the central bank may need to accompany that with measures to mitigate the pain any such move could inflict on financial institutions.

That said, if such a step is not brought up in any way, JPY could regain the recent losses, and also result in a drop in the USD/JPY down to and back below 107.00.

Below 108.50/109.00 we consider the picture on a daily time-frame to be bearish with a drop below 105.80 triggering a wave of further selling and quickly activate the region around 105.00 again:

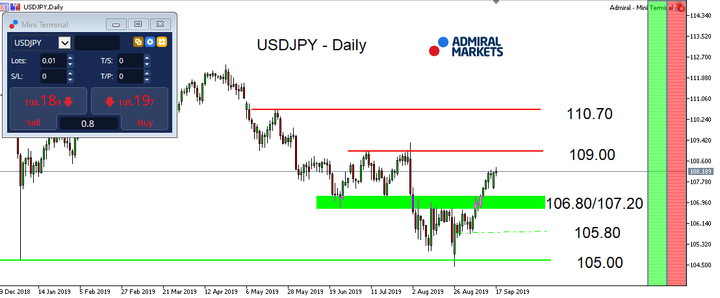
Source: Admiral Markets MT5 with MT5-SE Add-on USD/JPY Daily chart (between June 18, 2018, to September 17, 2019). Accessed: September 17, 2019 at 10:00 PM GMT – Please note: Past performance is not a reliable indicator of future results, or future performance.

In 2014, the value of USD/JPY increased by 13.7%, in 2015, it increased by 0.5%, in 2016, it fell by 2.8%, in 2017, it fell by 3.6%, in 2018, it fell by 2.7%, meaning that after five years, it was up by 4.1%.

Discover the world’s #1 multi-asset platform

Admiral Markets offers professional traders the ability to trade with a custom, upgraded version of MetaTrader 5, allowing you to experience trading at a significantly higher, more rewarding level. Experience benefits such as the addition of the Market Heat Map, so you can compare various currency pairs to see which ones might be lucrative investments, access real-time trading data, and so much more. Click the banner below to start your FREE download of MT5 Supreme Edition!

Download MetaTrader 5 and begin trading today!

Disclaimer: The given data provides additional information regarding all analysis, estimates, prognosis, forecasts or other similar assessments or information (hereinafter “Analysis”) published on the website of Admiral Markets. Before making any investment decisions please pay close attention to the following:

  1. This is a marketing communication. The analysis is published for informative purposes only and are in no way to be construed as investment advice or recommendation. It has not been prepared in accordance with legal requirements designed to promote the independence of investment research, and that it is not subject to any prohibition on dealing ahead of the dissemination of investment research.
  2. Any investment decision is made by each client alone whereas Admiral Markets shall not be responsible for any loss or damage arising from any such decision, whether or not based on the Analysis.
  3. Each of the Analysis is prepared by an independent analyst (Jens Klatt, Professional Trader and Analyst, hereinafter “Author”) based on the Author’s personal estimations.
  4. To ensure that the interests of the clients would be protected and objectivity of the Analysis would not be damaged Admiral Markets has established relevant internal procedures for prevention and management of conflicts of interest.
  5. Whilst every reasonable effort is taken to ensure that all sources of the Analysis are reliable and that all information is presented, as much as possible, in an understandable, timely, precise and complete manner, Admiral Markets does not guarantee the accuracy or completeness of any information contained within the Analysis. The presented figures refer that refer to any past performance is not a reliable indicator of future results.
  6. The contents of the Analysis should not be construed as an express or implied promise, guarantee or implication by Admiral Markets that the client shall profit from the strategies therein or that losses in connection therewith may or shall be limited.
  7. Any kind of previous or modeled performance of financial instruments indicated within the Publication should not be construed as an express or implied promise, guarantee or implication by Admiral Markets for any future performance. The value of the financial instrument may both increase and decrease and the preservation of the asset value is not guaranteed.
  8. The projections included in the Analysis may be subject to additional fees, taxes or other charges, depending on the subject of the Publication. The price list applicable to the services provided by Admiral Markets is publicly available from the website of Admiral Markets.
  9. Leveraged products (including contracts for difference) are speculative in nature and may result in losses or profit. Before you start trading, you should make sure that you understand all the risks.

By Admiral Markets

Investors Expect the Fed Meeting

by JustForex

Currency majors demonstrate a variety of trends. The dollar index (#DX) has become stable near monthly lows before the Fed meeting. The Central Bank is expected to reduce its key interest rate range by 25 basis points to 1.75%-2.00%. We recommend paying attention to updated economic forecasts and comments by the Fed representatives. The regulator may indicate a further rate of monetary policy adjustment. It should be recalled that earlier Donald Trump repeatedly criticized the Fed for a “strong” dollar and called for the beginning of a long and aggressive cycle of lowering interest rates.

During the Asian trading session, optimistic data on the trade balance of Japan have been published. Financial market participants continue to monitor the trade negotiations between Washington and Beijing, the Brexit process, as well as the situation in the “black gold” market. Today, investors will assess important economic reports from the UK, the Eurozone and the US.

Oil quotes have been declining after a sharp rally since the beginning of this week. At the moment, futures for the WTI crude oil are testing the $58.80 mark per barrel.

Market Indicators

Yesterday, the main US stock indices closed in the positive zone: #SPY (+0.25%), #DIA (+0.14%), #QQQ (+0.48%).

The 10-year US government bonds yield has been declining. At the moment, the indicator is at the level of 1.77-1.78%.

The Economic News Feed for 18.09.2019:
  • – Data on inflation in the UK at 11:30 (GMT+3:00);
  • – Consumer price index in the Eurozone at 12:00 (GMT+3:00);
  • – Statistics on the real estate market in the US at 15:30 (GMT+3:00);
  • – Data on inflation in Canada at 15:30 (GMT+3:00);
  • – Fed interest rate decision at 21:00 (GMT+3:00).

by JustForex

Ichimoku Cloud Analysis 17.09.2019 (AUDUSD, NZDUSD, USDCAD)

Article By RoboForex.com

AUDUSD, “Australian Dollar vs US Dollar”

AUDUSD is trading at 0.6832; the instrument is moving inside Ichimoku Cloud, thus indicating a sideways tendency. The markets could indicate that the price may test the cloud’s downside border at 0.6780 and then resume moving upwards to reach 0.6935. Another signal to confirm further ascending movement is the price’s rebounding from the rising channel’s downside border. However, the scenario that implies further growth may be canceled if the price breaks the cloud’s downside border and fixes below 0.6765. In this case, the pair may continue falling towards 0.6685. After breaking the cloud’s upside border and fixing above 0.6875, the price may continue moving upwards.

AUDUSD
Risk Warning: the result of previous trading operations do not guarantee the same results in the future

NZDUSD, “New Zealand Dollar vs US Dollar”

NZDUSD is trading at 0.6331; the instrument is moving below Ichimoku Cloud, thus indicating a descending tendency. The markets could indicate that the price may test the cloud’s downside border at 0.6355 and then resume moving downwards to reach 0.6255. Another signal to confirm further descending movement is the price’s rebounding from the descending channel’s upside border. However, the scenario that implies further decline may be canceled if the price breaks the cloud’s upside border and fixes above 0.6405. In this case, the pair may continue growing towards 0.6485. After breaking the rising channel’s downside border and fixing below 0.6295, the price may continue moving downwards.

NZDUSD
Risk Warning: the result of previous trading operations do not guarantee the same results in the future

USDCAD, “US Dollar vs Canadian Dollar”

USDCAD is trading at 1.3248; the instrument is moving inside Ichimoku Cloud, thus indicating a sideways tendency. The markets could indicate that the price may test the cloud’s upside border at 1.3255 and then resume moving downwards to reach 1.3090. Another signal to confirm further descending movement is the price’s rebounding from the descending channel’s upside border. However, the scenario that implies further decline may be canceled if the price breaks the cloud’s upside border and fixes above 1.3275. In this case, the pair may continue growing towards 1.3345. After breaking the cloud’s downside border and fixing below 1.3160, the price may continue moving downwards.

USDCAD
Risk Warning: the result of previous trading operations do not guarantee the same results in the future

Article By RoboForex.com

Attention!
Forecasts presented in this section only reflect the author’s private opinion and should not be considered as guidance for trading. RoboForex LP bears no responsibility for trading results based on trading recommendations described in these analytical reviews.

Japanese Candlesticks Analysis 17.09.2019 (USDCAD, AUDUSD)

Article By RoboForex.com

USDCAD, “US Dollar vs Canadian Dollar”

As we can see in the H4 chart, after rebounding from the rising channel’s downside border, USDCAD has formed several reversal patterns. Right now, the pair is trying to reverse after forming Harami pattern. At the moment, it may be assumed that the price may complete a slight correction and resume growing towards 1.3333. However, we shouldn’t ignore a possibility that the instrument may return to the support line and update the low.

USDCAD
Risk Warning: the result of previous trading operations do not guarantee the same results in the future

AUDUSD, “Australian Dollar vs US Dollar”

As we can see in the H4 chart, AUDUSD has formed several reversal patterns, including Shooting Star, close to the resistance level. Right now, the pair is trying to reverse. Judging by the previous movements, we may assume that the price may finish a slight pullback and then continue trading downwards to reach 0.6792. However, we shouldn’t ignore a possibility that the instrument may resume growing towards 0.6900.

AUDUSD

Article By RoboForex.com

Attention!
Forecasts presented in this section only reflect the author’s private opinion and should not be considered as guidance for trading. RoboForex LP bears no responsibility for trading results based on trading recommendations described in these analytical reviews.