Author Archive for InvestMacro – Page 167

EUR/USD Is Holding Balance

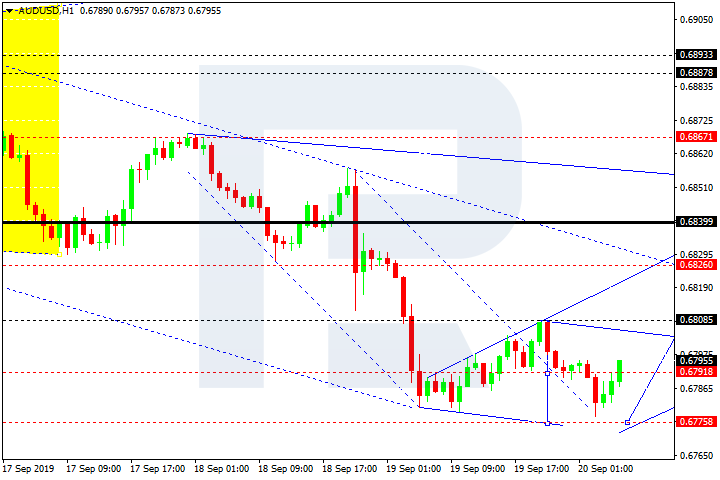
By Dmitriy Gurkovskiy, Chief Analyst at RoboForex

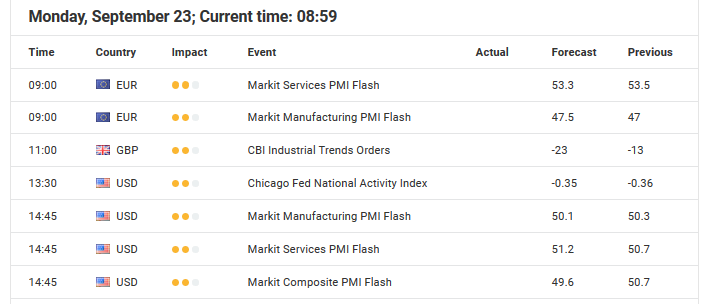
EUR/USD is looking quite stable; it is rising a little bit early in the fourth September week. All significant drivers have been published, so what investors have to do right now is to analyze them correctly and draw the right conclusions.

So, the information that is already known: the US Federal Reserve cut the key rate down to 1.75%-2.00%, but did it very carefully without any unnecessary comments for investors. The regulator placed specific emphasis on the fact that it wasn’t going to bow to the White House and would continue implementing the current monetary policy instead.

For the American Dollar, the signals that the Fed isn’t going to be aggressive in cutting its rates are surely positive.

Another thing that supports the USD this morning is the resumption of trade talks between the USA and China. Last Thursday, the parties already met and tried to resume the dialog, but barely had any progress in talks, which is widely expected by financial markets.

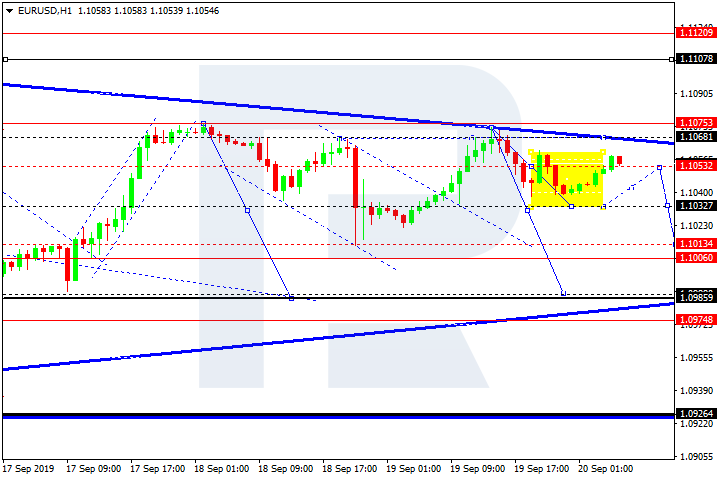
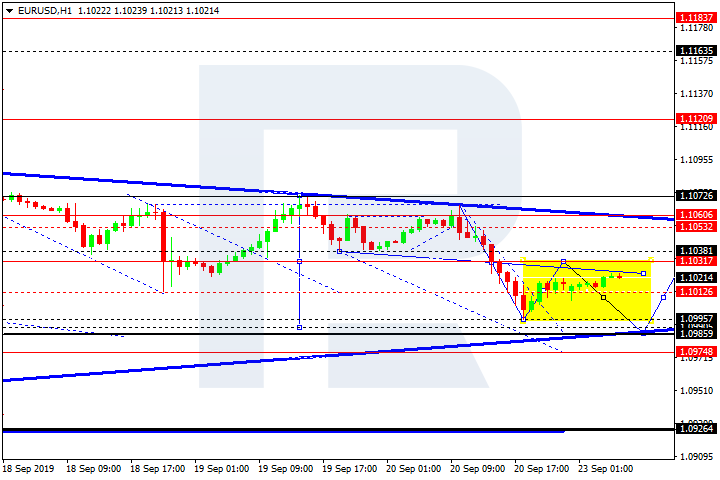
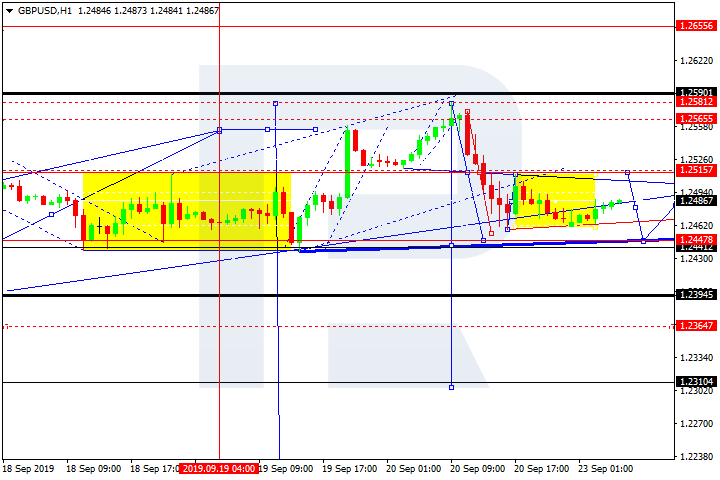
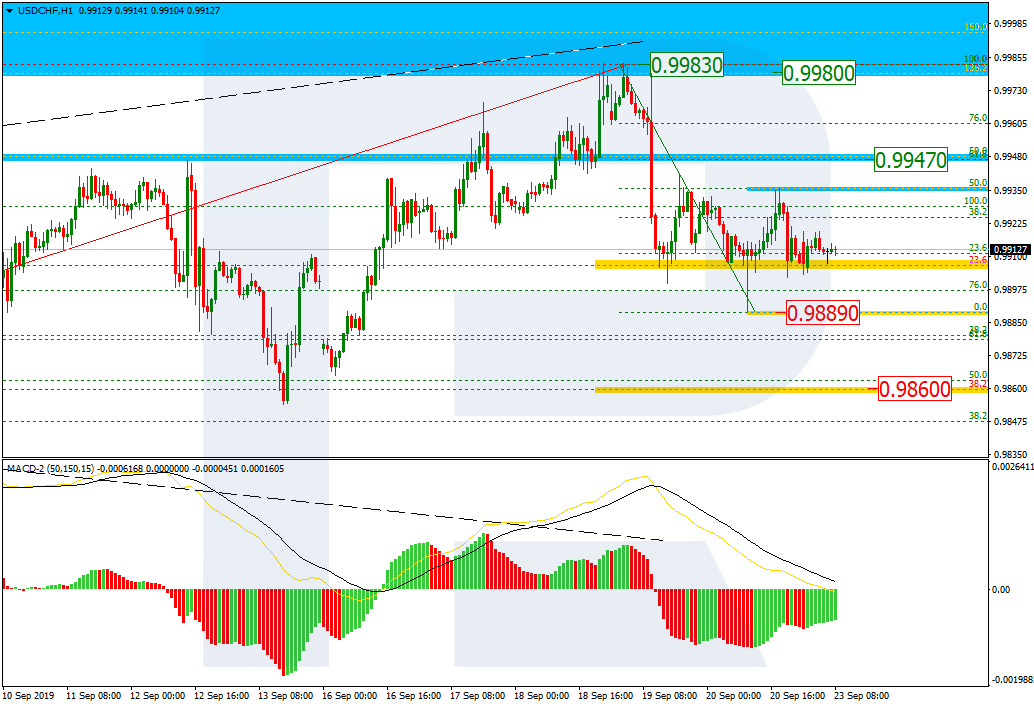
As we can see in the H4 chart, EURUSD has failed to fix above none of these levels: 1.1080, 1.1040, and 1.1020. Right now, the pair continues trading downwards. Possibly, the price may reach 1.0986 and then grow towards 1.1000. After that, the instrument may form a new descending structure towards 1.0965 and then start another growth to reach 1.1040, thus continuing its consolidation inside a wide range and forming Triangle pattern around 1.1040. If the market breaks this pattern to the downside, the downtrend may continue. From the technical point of view, this scenario is confirmed by MACD Oscillator: its signal line has broken 0 downwards and right now is steadily moving to the downside, thus confirming further downtrend.

In the H1 chart, EUR/USD is consolidating around 1.1030. Possibly, the pair may form one more descending structure to reach 1.0985 and then resume growing towards 1.1040. Later, the market may continue trading inside the downtrend with the target at 1.0965. From the technical point of view, this scenario is confirmed by Stochastic Oscillator: its signal line is moving directly downwards. After breaking 50 to the downside, the indicator may boost the downtrend.

Disclaimer

Any predictions contained herein are based on the authors’ particular opinion. This analysis shall not be treated as trading advice. RoboForex shall not be held liable for the results of the trades arising from relying upon trading recommendations and reviews contained herein.


Forex Technical Analysis & Forecast 23.09.2019 (EURUSD, GBPUSD, USDCHF, USDJPY, AUDUSD, USDRUB, USDCAD, GOLD, BRENT, BTCUSD)

Article By RoboForex.com

EURUSD, “Euro vs US Dollar”

After breaking 1.1038, EURUSD has formed another descending wave. Possibly, today the pair may form a new correction upwards and test 1.0138 from below. After that, the instrument may continue trading inside the downtrend with the target at 1.0990.

EURUSD
Risk Warning: the result of previous trading operations do not guarantee the same results in the future

GBPUSD, “Great Britain Pound vs US Dollar”

GBPUSD is forming the first descending impulse with the target at 1.2444. Later, the market may start another correction towards 1.2515 and then form a new descending structure to break 1.2444. The predicted target is at 1.2360.

GBPUSD
Risk Warning: the result of previous trading operations do not guarantee the same results in the future

USDCHF, “US Dollar vs Swiss Franc”

USDCHF is forming the first ascending impulse with the target at 0.9950. After that, the instrument may correct towards 0.9920 and then start another growth to reach 0.9988.

USDCHF
Risk Warning: the result of previous trading operations do not guarantee the same results in the future

USDJPY, “US Dollar vs Japanese Yen”

After breaking 107.83, USDJPY has formed another descending wave at 107.52. Today, the pair may form one more ascending structure towards 107.80 and then resume trading downwards to reach 107.45.

USDJPY
Risk Warning: the result of previous trading operations do not guarantee the same results in the future

AUDUSD, “Australian Dollar vs US Dollar”

AUDUSD has broken 0.6783 downwards. Possibly, today the pair may test this level from below and then start a new decline towards 0.6748. Later, the market may correct with the target at 0.6840.

AUDUSD
Risk Warning: the result of previous trading operations do not guarantee the same results in the future

USDRUB, “US Dollar vs Russian Ruble”

USDRUB has completed another descending structure at 63.72. Today, the pair may start a new correction towards 64.14 and then resume falling with the target at 63.28.

USDRUB
Risk Warning: the result of previous trading operations do not guarantee the same results in the future

USDCAD, “US Dollar vs Canadian Dollar”

USDCAD is consolidating around 1.3268. Possibly, today the pair may fall to break 1.3252 and then continue the correction towards 1.3236. However, the price may choose an alternative scenario to break 1.3280 and then grow to reach 1.3305. The main scenario implies that the instrument may continue the correction with the target at 1.3213.

USDCAD
Risk Warning: the result of previous trading operations do not guarantee the same results in the future

XAUUSD, “Gold vs US Dollar”

Gold has broken 1516.80; right now, it is still moving upwards. Today, the pair may fall to break 1510.00 and then continue trading downwards with the target at 1472.00.

GOLD
Risk Warning: the result of previous trading operations do not guarantee the same results in the future

BRENT

Brent is consolidating above 64.32. According to the main scenario, the price is expected to move upwards to break 67.67. Later, the market may continue growing with the target at 71.30.

BRENT
Risk Warning: the result of previous trading operations do not guarantee the same results in the future

BTCUSD, “Bitcoin vs US Dollar”

BTCUSD has finished another descending impulse at 9850.00; right now, it is consolidating above this level. Possibly, the pair may form a new correction towards 10122.00 and then resume trading downwards with the first target at 9500.00.

BITCOIN

Article By RoboForex.com

Attention!
Forecasts presented in this section only reflect the author’s private opinion and should not be considered as guidance for trading. RoboForex LP bears no responsibility for trading results based on trading recommendations described in these analytical reviews.

Fibonacci Retracements Analysis 23.09.2019 (GOLD, USDCHF)

Article By RoboForex.com

XAUUSD, “Gold vs US Dollar”

As we can see in the H4 chart, after updating the local low, XAUUSD is back to trading inside the previous correctional range. During the correction, the pair has got very close to 50.0% fibo, but may yet continue moving to reach 61.8% and 76.0% fibo at 1528.90 and 1539.25 respectively. However, if the price breaks the low at 1483.49, the instrument may continue the mid-term descending tendency towards 50.0% and 61.8% fibo at 1478.85 and 1460.25 respectively.

GOLD_H4
Risk Warning: the result of previous trading operations do not guarantee the same results in the future

In the H1 chart, after testing 50.0% fibo at 1520.20, the pair may start a new short-term pullback. The targets may be 23.6% and 38.2% fibo at 1511.00 and 1505.75 respectively.

GOLD_H1
Risk Warning: the result of previous trading operations do not guarantee the same results in the future

USDCHF, “US Dollar vs Swiss Franc”

As we can see in the H4 chart, the divergence made the pair reverse after it tested the post-correctional extension area between 138.2% and 161.8% fibo at 0.9980 and 1.0010 respectively. By now, USDCHF has already reached 23.6% fibo and may continue falling towards 38.2%, 50.0%, and 61.8% fibo at 0.9860, 0.9821, and 0.9783 respectively.

USDCHF_H4
Risk Warning: the result of previous trading operations do not guarantee the same results in the future

In the H1 chart, after reaching mid-term 23.6% fibo, USDCHF is correcting and has already reached 50.0% fibo. If the price breaks the local low at 0.9889, the instrument may continue falling.

USDCHF_H1

Article By RoboForex.com

Attention!
Forecasts presented in this section only reflect the author’s private opinion and should not be considered as guidance for trading. RoboForex LP bears no responsibility for trading results based on trading recommendations described in these analytical reviews.

The Analytical Overview of the Main Currency Pairs on 2019.09.23

by JustForex

The EUR/USD currency pair

Technical indicators of the currency pair:
  • Prev Open: 1.10406
  • Open: 1.10068
  • % chg. over the last day: -0.21
  • Day’s range: 1.10068 – 1.10254
  • 52 wk range: 1.0931 – 1.1817

The EUR/USD currency pair continues to trade in a protracted flat. The technical picture is still mixed. The trading instrument is currently consolidating. The local support and resistance levels are 1.09950 and 1.10300, respectively. Today, financial markets participants will evaluate a number of indicators of business activity in the eurozone. These statistics can have a significant impact on the dynamics of the single currency in the short term. We also recommend that you keep track of up-to-date information regarding trade negotiations between the US and China. Positions must be opened from key levels.

The Economic News Feed for 23.09.2019:

  • – statistics on business activity in Germany and the eurozone – 10:30 (GMT+3:00) and 11:00 (GMT+3:00), respectively;
  • – data on business activity in the USA – 16:45 (GMT+3:00).
EUR/USD

Indicators of accurate signals do not give: 50 MA crossed 100 MA.

The MACD histogram is in the negative zone, but above the signal line, which gives a weak signal to sell EUR / USD.

The Stochastic Oscillator is in the neutral zone, the %K line crossed the %D line. There are no signals at the moment.

Trading recommendations
  • Support levels: 1.09950, 1.09650, 1.09450
  • Resistance levels: 1.10300, 1.10650, 1.10850

If the price consolidates above 1.10300, consider buying EUR/USD. The profits should be fixed at 1.10600-1.10800.

Alternatively, the quotes could decrease toward 1.09700-1.09500.

The GBP/USD currency pair

Technical indicators of the currency pair:
  • Prev Open: 1.25217
  • Open: 1.24642
  • % chg. over the last day: -0.38
  • Day’s range: 1.24430 – 1.24907
  • 52 wk range: 1.1995 – 1.3385

Last week, the pound reached three-month highs against the US dollar thanks to hopes that a hard Brexit could be avoided. European Commission President Jean-Claude Juncker said that the signing of the agreement between London and Brussels is still valid. At the moment, the GBP/USD currency pair has retreated from local highs. The trading instrument is consolidating in the range 1.24450-1.25000. In the near future, technical correction is not ruled out. We recommend opening positions from key levels.

The Economic News Feed for 23.09.2019 is calm.

GBP/USD

Indicators do not provide accurate signals, the price crossed 50 MA and 100 MA.

The MACD histogram is in the negative zone and continues to decline, which indicates the correction of the GBP/USD currency pair.

The Stochastic Oscillator is in the neutral zone, the %K line is below the %D line, which also gives a signal to sell GBP/USD.

Trading recommendations
  • Support levels: 1.24450, 1.24000, 1.23650
  • Resistance levels: 1.25000, 1.25550, 1.25800

If the price consolidates below 1.24450, expect a correction toward 1.24000.

Alternatively, the quotes could grow toward 1.25400-1.25600.

The USD/CAD currency pair

Technical indicators of the currency pair:
  • Prev Open: 1.32627
  • Open: 1.32593
  • % chg. over the last day: -0.02
  • Day’s range: 1.32597 – 1.32776
  • 52 wk range: 1.2727 – 1.3664

The technical picture on the USD/CAD currency pair is still ambiguous. CAD is trading in a long flat. At the moment, the following local support and resistance levels can be distinguished: 1.32550 and 1.32900, respectively. Participants in financial markets expect additional drivers. We recommend to pay attention to the dynamics of prices of oil. Positions must be opened from key levels.

At 15:30 (GMT+3:00), Canada will publish a report on wholesale sales.

  • – Economic Event (CAD) – 00:00 (GMT+3:00);
  • – Economic Event (CAD) – 00:00 (GMT+3:00);
  • – Economic Event (CAD) – 00:00 (GMT+3:00);
USD/CAD

Indicators do not give accurate signals,the price crossed 50 MA and 100 MA.

The MACD histogram is near 0.

The Stochastic Oscillator is in the neutral zone, the %K line is below the %D line, which gives a signal to sell USD/CAD.

Trading recommendations
  • Support levels: 1.32550, 1.32350, 1.32100
  • Resistance levels: 1.32900, 1.33150

If the price consolidates below 1.32550, expect the quotes to fall toward 1.32300-1.32100.

Alternatively, the quotes could grow toward 1.33200-1.33400.

The USD/JPY currency pair

Technical indicators of the currency pair:
  • Prev Open: 108.013
  • Open: 107.713
  • % chg. over the last day: -0.43
  • Day’s range: 107.607 – 107.753
  • 52 wk range: 104.97 – 114.56

The USD/JPY currency pair went down. The trading tool has updated local lows. At the moment, the safe haven currency is consolidating. Quotes found support at 107.550. 107.850 is a mirror resistance. The USD/JPY currency pair has the potential for further correction after a protracted rally. We recommend that you pay attention to the dynamics of yield on US government bonds. Positions must be opened from key levels.

Today, Japanese financial markets are closed due to the holiday.

  • – Economic Event (JPY) – 00:00 (GMT+3:00);
  • – Economic Event (JPY) – 00:00 (GMT+3:00);
  • – Economic Event (JPY) – 00:00 (GMT+3:00);
USD/JPY

Indicators point to the strength of sellers: the price has fixed below 50 MA and 100 MA.

The MACD histogram is in the negative zone, but above the signal line, which gives a weak signal to sell USD/JPY.

The Stochastic Oscillator is in the neutral zone, the %K line crossed the %D line. There are no signals at the moment.

Trading recommendations
  • Support levels: 107.550, 107.200
  • Resistance levels: 107.850, 108.100, 108.350

If the price consolidates below 107.550, expect further correction toward 107.300-107.100.

Alternatively, the quotes could grow toward 108.100-108.300.

by JustForex

The US Currency Is in the Positive Zone

by JustForex

The US dollar is strengthening against a basket of major currencies. On Friday, the dollar index (#DX) closed in the positive zone (+0.30%). Investors continue to monitor trade negotiations between Washington and Beijing. At the weekend, September 19-20, preliminary meetings between the US and China deputy ministers took place. Beijing, in turn, called the meetings “constructive.” The parties discussed the trade and economic problems of the countries, as well as organizational issues regarding negotiations between the heads of countries in October.

On Thursday, the Bank of England left the key interest rate unchanged at 0.75% per annum, as experts expected. At the same time, officials paid attention to the risks associated with the complex Brexit process and the uncertainty concerning it. However, the British pound has been growing amid investors’ optimism regarding a chance to avoid the “hard” Brexit. On Thursday, Sky News quoted the words by European Commission President, Jean-Claude Juncker, that an agreement between the EU and the UK to avoid a “hard” Brexit could still be reached.

The “black gold” prices have been growing after fall the day before. Currently, futures for the WTI crude oil are testing the $58.40 mark per barrel.

Market Indicators

On Friday, the bearish sentiment was observed in the US stock markets: #SPY (-0.93%), #DIA (-0.80%), #QQQ (-1.06%).

The 10-year US government bonds yield has been declining. At the moment, the indicator is at the level of 1.69-1.70%.

The Economic News Feed for 23.09.2019:
  • – German manufacturing PMI at 10:30 (GMT+3:00);
  • – Markit composite PMI in the Eurozone at 11:00 (GMT+3:00);
  • – Manufacturing PMI in the US at 16:45 (GMT+3:00).

by JustForex

Signs point to a bullish breakout coming in the DAX30 CFD

By Admiral Markets

Source: Economic Events September 23, 2019 – Admiral Markets’ Forex Calendar

As the economic calendar, particularly in Europe, is quite thin this week, our focus will be on the technical side in the DAX30 CFD.

On an hourly chart, we consider the mode to be neutral and range-bound between 12,300 and 12,500 points. But, given the sequence of higher highs and lows, there’s a clear bullish touch.

Given the recent price action, we consider a significant and sustainable break above 12,500 points to be only a matter of time, levelling the path up to the current yearly highs around 12,650 points in the German index.

We project a technical target to be around 12,700 points, given the 200 point range between 12,300 and 12,500.

Only a break below 12,300 points would darken the bullish outlook, switch the mode to neutral, and activate the region around 12,180 points as a first potential target on the downside.

Source: Admiral Markets MT5 with MT5-SE Add-on DAX30 CFD Hourly chart (between September 3, 2019, to September 20, 2019). Accessed: September 20, 2019, at 10:00pm GMT

Source: Admiral Markets MT5 with MT5-SE Add-on DAX30 CFD Daily chart (between June 7, 2018, to September 20, 2019). Accessed: September 20, 2019, at 10:00pm GMT – Please note: Past performance is not a reliable indicator of future results, or future performance.

In 2014, the value of the DAX30 CFD increased by 2.65%, in 2015, it increased by 9.56%, in 2016, it increased by 6.87%, in 2017 it increased by 12.51%, in 2018, it fell by 18.26%, meaning that after five years, it was up by 10.5%.

Discover the world’s #1 multi-asset platform

Admiral Markets offers professional traders the ability to trade with a custom, upgraded version of MetaTrader 5, allowing you to experience trading at a significantly higher, more rewarding level. Experience benefits such as the addition of the Market Heat Map, so you can compare various currency pairs to see which ones might be lucrative investments, access real-time trading data, and so much more. Click the banner below to start your FREE download of MT5 Supreme Edition!

Download MetaTrader 5 and begin trading today!

Disclaimer: The given data provides additional information regarding all analysis, estimates, prognosis, forecasts or other similar assessments or information (hereinafter “Analysis”) published on the website of Admiral Markets. Before making any investment decisions please pay close attention to the following:

  1. This is a marketing communication. The analysis is published for informative purposes only and are in no way to be construed as investment advice or recommendation. It has not been prepared in accordance with legal requirements designed to promote the independence of investment research, and that it is not subject to any prohibition on dealing ahead of the dissemination of investment research.
  2. Any investment decision is made by each client alone whereas Admiral Markets shall not be responsible for any loss or damage arising from any such decision, whether or not based on the Analysis.
  3. Each of the Analysis is prepared by an independent analyst (Jens Klatt, Professional Trader and Analyst, hereinafter “Author”) based on the Author’s personal estimations.
  4. To ensure that the interests of the clients would be protected and objectivity of the Analysis would not be damaged Admiral Markets has established relevant internal procedures for prevention and management of conflicts of interest.
  5. Whilst every reasonable effort is taken to ensure that all sources of the Analysis are reliable and that all information is presented, as much as possible, in an understandable, timely, precise and complete manner, Admiral Markets does not guarantee the accuracy or completeness of any information contained within the Analysis. The presented figures refer that refer to any past performance is not a reliable indicator of future results.
  6. The contents of the Analysis should not be construed as an express or implied promise, guarantee or implication by Admiral Markets that the client shall profit from the strategies therein or that losses in connection therewith may or shall be limited.
  7. Any kind of previous or modeled performance of financial instruments indicated within the Publication should not be construed as an express or implied promise, guarantee or implication by Admiral Markets for any future performance. The value of the financial instrument may both increase and decrease and the preservation of the asset value is not guaranteed.
  8. The projections included in the Analysis may be subject to additional fees, taxes or other charges, depending on the subject of the Publication. The price list applicable to the services provided by Admiral Markets is publicly available from the website of Admiral Markets.

Leveraged products (including contracts for difference) are speculative in nature and may result in losses or profit. Before you start trading, you should make sure that you understand all the risks.

By Admiral Markets

Forex Technical Analysis & Forecast 20.09.2019 (EURUSD, GBPUSD, USDCHF, USDJPY, AUDUSD, USDRUB, USDCAD, GOLD, BRENT, BTCUSD)

Article By RoboForex.com

EURUSD, “Euro vs US Dollar”

EURUSD is consolidating around 1.1040. Possibly, the pair may choose an alternative scenario and grow towards 1.1080. According to the main scenario, the price is expected to continue trading inside the downtrend with the target at 1.0985.

EURUSD
Risk Warning: the result of previous trading operations do not guarantee the same results in the future

GBPUSD, “Great Britain Pound vs US Dollar”

After completing the ascending wave at 1.2555, GBPUSD has formed the first descending impulse along with the correction. Possibly, today the pair may form the second impulse to break 1.2521. The target is at 1.2480.

GBPUSD
Risk Warning: the result of previous trading operations do not guarantee the same results in the future

USDCHF, “US Dollar vs Swiss Franc”

USDCHF has completed the correction at 0.9900; right now, it is consolidating above this level. Possibly, the pair may expand the range towards 0.9895 and then start another growth to reach 0.9955.

USDCHF
Risk Warning: the result of previous trading operations do not guarantee the same results in the future

USDJPY, “US Dollar vs Japanese Yen”

USDJPY is moving downwards with the target at 107.61. After that, the instrument may form one more ascending structure towards 107.81 and then resume trading downwards to reach 107.44.

USDJPY
Risk Warning: the result of previous trading operations do not guarantee the same results in the future

AUDUSD, “Australian Dollar vs US Dollar”

AUDUSD is still consolidating around 0.6781. Possibly, the pair may expand the range towards 0.6775 and then start a new growth to break 0.6808. Later, the market may continue trading upwards with the target at 0.6840.

AUDUSD
Risk Warning: the result of previous trading operations do not guarantee the same results in the future

USDRUB, “US Dollar vs Russian Ruble”

USDRUB is moving downwards. Possibly, the pair may break 63.82 and then continue falling to reach 63.30. After that, the instrument may start a new correction with the target at 64.15.

USDRUB
Risk Warning: the result of previous trading operations do not guarantee the same results in the future

USDCAD, “US Dollar vs Canadian Dollar”

USDCAD is correcting towards 1.3232 and may later grow to reach 1.3270, thus forming a new consolidation range. If the price breaks this range to the upside at 1.3270, the instrument may continue growing with the target at 1.3300; if to the downside at 1.3232 – form a new descending structure towards 1.3200 and then resume trading upwards to reach the above-mentioned target.

USDCAD
Risk Warning: the result of previous trading operations do not guarantee the same results in the future

XAUUSD, “Gold vs US Dollar”

Gold continues consolidating around 1497.66. Today, the pair may expand the range towards 1500.00 and then form a new descending structure to break 1488.44. After that, the instrument may continue trading downwards with the target at 1472.00.

GOLD
Risk Warning: the result of previous trading operations do not guarantee the same results in the future

BRENT

After finishing the ascending impulse at 65.30, Brent has completed the correction at 64.30. Possibly, today the pair may break this range to the upside. The first target is at 67.67. If the price falls to update the low at 63.44 and breaks it, the instrument may choose and alternative scenario to continue trading downwards with the target at 60.60. According to the main scenario, the instrument is expected to trade inside the uptrend towards 71.30.

BRENT
Risk Warning: the result of previous trading operations do not guarantee the same results in the future

BTCUSD, “Bitcoin vs US Dollar”

BTCUSD has returned to 10180.00. Today, the pair may consolidate around this level. If later the price breaks this range to the downside at 10090.00, the instrument may resume trading downwards with the first target at 9500.00.

BITCOIN

Article By RoboForex.com

Attention!
Forecasts presented in this section only reflect the author’s private opinion and should not be considered as guidance for trading. RoboForex LP bears no responsibility for trading results based on trading recommendations described in these analytical reviews.

Fibonacci Retracements Analysis 20.09.2019 (BITCOIN, ETHEREUM)

Article By RoboForex.com

BTCUSD, “Bitcoin vs US Dollar”

As we can see in the daily chart, the correctional Triangle continues close to 38.2% fibo. If the price breaks the current resistance level and 23.6% fibo at 11355.00, BTCUSD will continue growing towards the high at 13857.20. At the same time, MACD lines are heading downwards, which means that the decline may yet continue towards 50.0%, 61.8%, and 76.0% fibo at 8580.00, 7350.00, and 5860.00 respectively.

Bitcoin
Risk Warning: the result of previous trading operations do not guarantee the same results in the future

In the H4 chart, the pair is moving to the upside after the correction and has already reached 50.0% fibo. In the future, the ascending impulse may continue towards 61.8% and 76.0% fibo at 10441.00 and 10627.50 respectively. The key upside target is the local high at 10943.60. The support is the low at 9633.90.

BTCUSD
Risk Warning: the result of previous trading operations do not guarantee the same results in the future

ETHUSD, “Ethereum vs. US Dollar”

As we can see in the daily chart, the convergence made the pair start a new correctional uptrend, which has already reached 38.2% fibo. In the future, the correction may continue towards 50.0% and 61.8% fibo at 240.70 and 259.00 respectively. After breaking 23.6% fibo at 199.80, the instrument may plummet to reach 163.20.

ETHEREUM
Risk Warning: the result of previous trading operations do not guarantee the same results in the future

The H4 chart shows more detailed structure of the current correction. By now, the pair has already reached 38.2% fibo. Later, the price may continue falling towards 23.6% fibo.

ETHUSD

Article By RoboForex.com

Attention!
Forecasts presented in this section only reflect the author’s private opinion and should not be considered as guidance for trading. RoboForex LP bears no responsibility for trading results based on trading recommendations described in these analytical reviews.

After the Fed: Gold bulls lie in wait, 1,440/50 of interest

By Admiral Markets

Source: Economic Events September 20, 2019 – Admiral Markets’ Forex Calendar

While Gold didn’t take on further bullish momentum after the Fed rate decision on Wednesday, instead stabilised below 1,500 USD, our middle-term bullish outlook stays intact.

With a thin economic calendar into the weekly close, we want to look at the Fed and its decision, and how that could affect the price action in Gold in the days to come.

So, after the Fed cut rates as expected by 25 basis points to 1.75 – 2%, the deeper cut of overnight reverse repos by 0.3% to 1.7% to alleviate funding pressures in short-term lending markets at the beginning of this week, potentially pointing to first signs of a credit crunch, financial stress and a favourable environment for Gold in general. Comments from Fed chairman Powell, stating during his press conference on Wednesday that the Fed may resume organic balance sheet growth earlier than expected (to put it differently: bringing a relaunch of QE on the table, at least between the lines) will rather sooner than later result in attention among Gold bulls.

While Gold didn’t take the bait immediately, we still see the overall advantage in Gold on the upside, technically as long as we trade above 1,380 USD.

In fact, we consider the drop below 1,500 USD not at big deal at all, instead see a potential mid-term long trigger around 1,440/450 USD with an overall potential target around 1,650/700 USD in the weeks to come staying active:

Source: Admiral Markets MT5 with MT5-SE Add-on Gold Daily chart (between June 21, 2018, to September 19, 2019). Accessed: September 19, 2019, at 10:00pm GMT – Please note: Past performance is not a reliable indicator of future results, or future performance.

In 2014, the value of Gold fell by 1.7%, in 2015, it fell by 10.4%, in 2016, it increased by 8.1%, in 2017, it increased by 13.1%, in 2018, it fell by 1.6%, meaning that after five years, it was up by 6.4%.

Discover the world’s #1 multi-asset platform

Admiral Markets offers professional traders the ability to trade with a custom, upgraded version of MetaTrader 5, allowing you to experience trading at a significantly higher, more rewarding level. Experience benefits such as the addition of the Market Heat Map, so you can compare various currency pairs to see which ones might be lucrative investments, access real-time trading data, and so much more. Click the banner below to start your FREE download of MT5 Supreme Edition!

Download MetaTrader 5 and begin trading today!

Disclaimer: The given data provides additional information regarding all analysis, estimates, prognosis, forecasts or other similar assessments or information (hereinafter “Analysis”) published on the website of Admiral Markets. Before making any investment decisions please pay close attention to the following:

  1. This is a marketing communication. The analysis is published for informative purposes only and are in no way to be construed as investment advice or recommendation. It has not been prepared in accordance with legal requirements designed to promote the independence of investment research, and that it is not subject to any prohibition on dealing ahead of the dissemination of investment research.
  2. Any investment decision is made by each client alone whereas Admiral Markets shall not be responsible for any loss or damage arising from any such decision, whether or not based on the Analysis.
  3. Each of the Analysis is prepared by an independent analyst (Jens Klatt, Professional Trader and Analyst, hereinafter “Author”) based on the Author’s personal estimations.
  4. To ensure that the interests of the clients would be protected and objectivity of the Analysis would not be damaged Admiral Markets has established relevant internal procedures for prevention and management of conflicts of interest.
  5. Whilst every reasonable effort is taken to ensure that all sources of the Analysis are reliable and that all information is presented, as much as possible, in an understandable, timely, precise and complete manner, Admiral Markets does not guarantee the accuracy or completeness of any information contained within the Analysis. The presented figures refer that refer to any past performance is not a reliable indicator of future results.
  6. The contents of the Analysis should not be construed as an express or implied promise, guarantee or implication by Admiral Markets that the client shall profit from the strategies therein or that losses in connection therewith may or shall be limited.
  7. Any kind of previous or modeled performance of financial instruments indicated within the Publication should not be construed as an express or implied promise, guarantee or implication by Admiral Markets for any future performance. The value of the financial instrument may both increase and decrease and the preservation of the asset value is not guaranteed.
  8. The projections included in the Analysis may be subject to additional fees, taxes or other charges, depending on the subject of the Publication. The price list applicable to the services provided by Admiral Markets is publicly available from the website of Admiral Markets.

Leveraged products (including contracts for difference) are speculative in nature and may result in losses or profit. Before you start trading, you should make sure that you understand all the risks.

By Admiral Markets

Japanese Candlesticks Analysis 19.09.2019 (GOLD, NZDUSD)

Article By RoboForex.com

XAUUSD, “Gold vs US Dollar”

As we can see in the H4 chart, the ascending tendency continues. XAUUSD has formed another reversal pattern, Hammer, close to the channel’s downside border. Right now, the pair is trying to reverse. If the pair rebounds, it may move towards 1525.00. At the same time, we shouldn’t exclude a possibility that the instrument may continue falling to reach 1475.00 test the ascending channel’s downside border.

GOLD
Risk Warning: the result of previous trading operations do not guarantee the same results in the future

NZDUSD, “New Zealand vs. US Dollar”

As we can see in the H4 chart, NZDUSD has formed Inverted Hammer reversal pattern; right now, it is testing the horizontal support level and starting to reverse. After that, the pair may return to 0.6361. At the same time, one shouldn’t exclude an opposite scenario, according to which the instrument may continue falling towards 0.6268.

NZDUSD

Article By RoboForex.com

Attention!
Forecasts presented in this section only reflect the author’s private opinion and should not be considered as guidance for trading. RoboForex LP bears no responsibility for trading results based on trading recommendations described in these analytical reviews.