by JustForex
The EUR/USD currency pair
- Prev Open: 1.09202
- Open: 1.09406
- % chg. over the last day: +0.16
- Day’s range: 1.09302 – 1.09462
- 52 wk range: 1.0905 – 1.1652
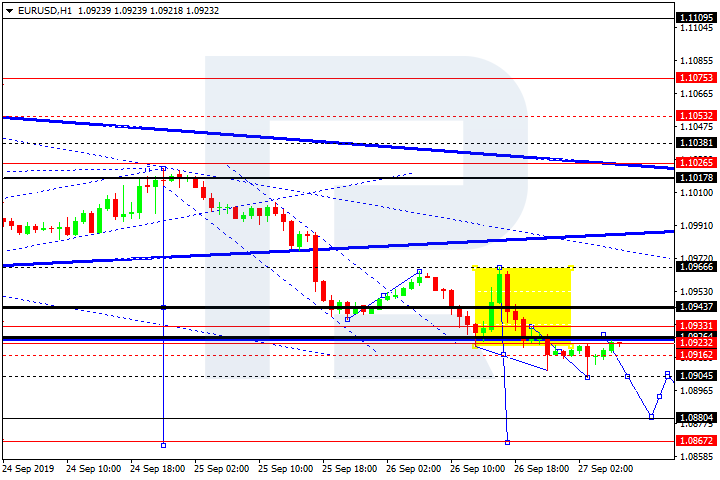
The US dollar continues to hold positions relative to a basket of world currencies. Global political uncertainty and concerns over the expansion of the trade war between Washington and Beijing remain in the spotlight for investors. Currently, EUR/USD quotes are consolidating. In the near future, a technical correction of the EUR/USD currency pair is not ruled out. The key trading range is 1.09100-1.09450. We recommend opening positions from these marks.
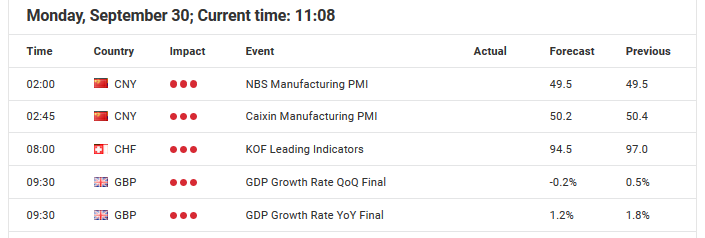
At 10:55 (GMT+3:00) expect a labor report from Germany.

Indicators do not give accurate signals: the price crossed 50 MA.
The MACD histogram is located near the 0 .
The Stochastic Oscillator is in the neutral zone, the %K line is above the %D line, which indicates a possible correction of EUR/USD quotes.
- Support levels: 1.09100, 1.08700
- Resistance levels: 1.09450, 1.09650, 1.09900
If the price consolidates below 1.09100, expect the quotes to fall toward 1.08800-1.08600.
Alternatively, EUR/USD could rise toward 1.09700-1.09900.
The GBP/USD currency pair
- Prev Open: 1.23188
- Open: 1.22865
- % chg. over the last day: -0.28
- Day’s range: 1.22758 – 1.22995
- 52 wk range: 1.1995 – 1.3385
The GBP/USD currency pair continues to consolidate after a sharp decline last week. The technical picture is ambiguous. The pound is still under pressure due to the possible consequences of the hard Brexit. At the moment, the local support and resistance levels are: 1.22750 and 1.23250, respectively. We are expecting important statistics from the UK. We recommend opening positions from key levels.
At 11:30 (GMT+3:00), UK will publish a GDP report.

Indicators signal the strength of sellers: the price has fixed below 50 MA and 100 MA.
The MACD histogram is in the negative zone, but above the signal line, which gives a weak signal to sell GBP/USD.
The Stochastic Oscillator is in the neutral zone, the %K line is above the %D line, which indicates bullish sentiment.
- Support levels: 1.22750, 1.22400
- Resistance levels: 1.23250, 1.23750, 1.24150
If the price consolidates below 1.22750, expect a further fall toward 1.22400-1.22200.
Alternatively, the quotes could grow toward 1.23700-1.23900.
The USD/CAD currency pair
- Prev Open: 1.32649
- Open: 1.32362
- % chg. over the last day: -0.17
- Day’s range: 1.32302 – 1.32470
- 52 wk range: 1.2727 – 1.3664
CAD is still in lateral movement. There is no defined trend. At the moment, the following local support and resistance levels can be distinguished: 1.32300 and 1.32550, respectively. The USD/CAD currency pair has a downside potential. We recommend paying attention to the dynamics of oil quotes. Positions must be opened from key levels.
The Economic News Feed for 30.09.2019 is calm.

Indicators do not give accurate signals.
The MACD histogram is in the negative zone and below the signal line, which indicates the development of a bearish sentiment.
The Stochastic Oscillator is in the neutral zone, the %K line is below the %D line, which also gives a signal to sell USD/CAD.
- Support levels: 1.32300, 1.32100, 1.31800
- Resistance levels: 1.32550, 1.32800, 1.33000
If the price consolidates below 1.32300, expect the quotes to fall toward 1.32000-1.31800.
Alternatively, the quotes could grow toward 1.32700-1.32900.
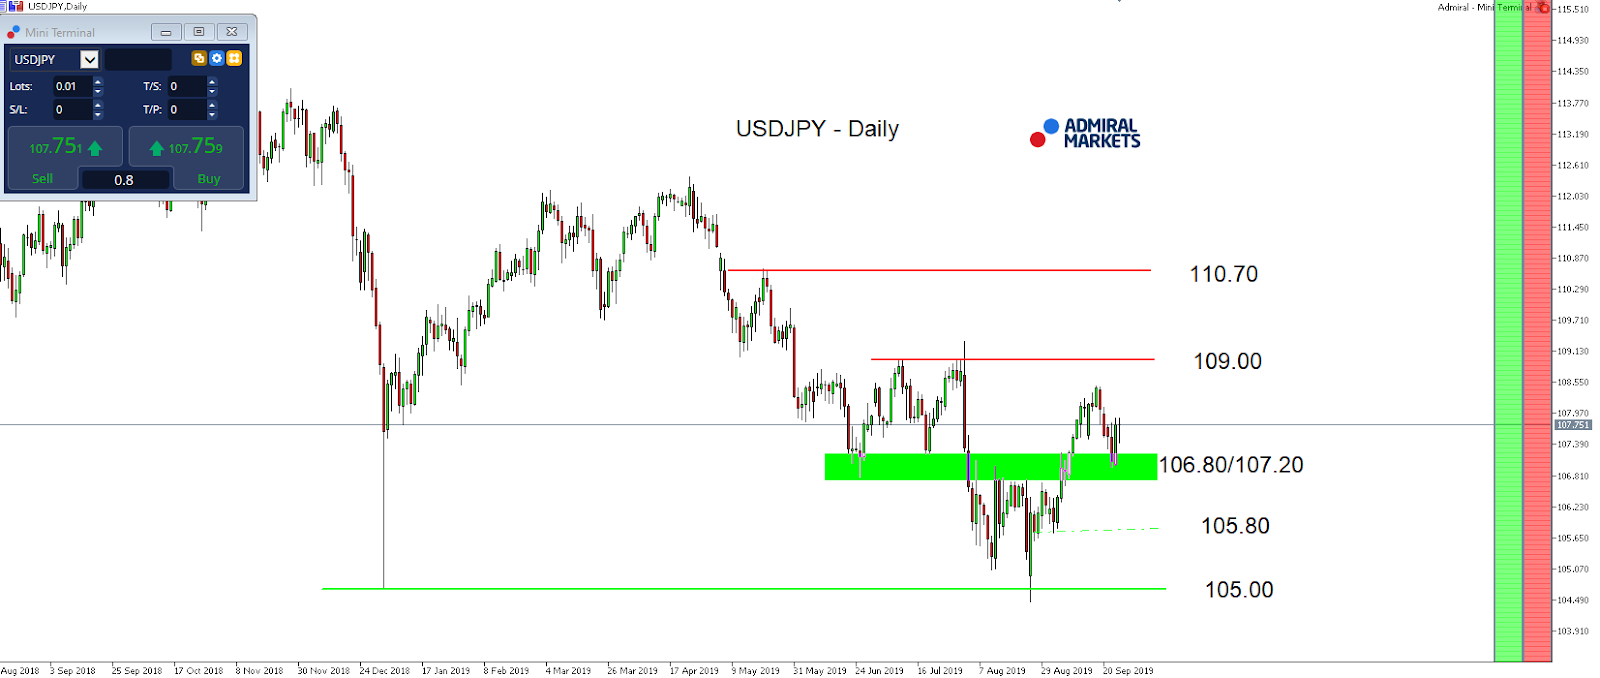
The USD/JPY currency pair
- Prev Open: 107.827
- Open: 107.965
- % chg. over the last day: +0.10
- Day’s range: 107.752 – 108.012
- 52 wk range: 104.97 – 114.56
The technical picture on the USD/JPY currency pair is still ambiguous. The trading instrument is in lateral movement. Demand for safe haven currencies remains at a fairly high level. At the moment, the local support and resistance levels are: 107.650 and 108.000, respectively. Investors expect additional drivers. We recommend that you pay attention to the dynamics of yield on US government bonds. Positions must be opened from key levels.
Mixed economic releases from Japan were published during the Asian trading session.

Indicators do not give accurate signals: the price crossed 50 MA.
The MACD histogram is near 0.
The Stochastic Oscillator is in the neutral zone, the %K line is below the %D line, which indicates a bearish sentiment.
- Support levels: 107.650, 107.350, 107.000
- Resistance levels: 108.000, 108.250, 108.450
If the price consolidates below 107.650, expect the quotes to fall toward 107.350-107.200.
Alternatively, the quotes could grow toward 108.300-108.450.
by JustForex