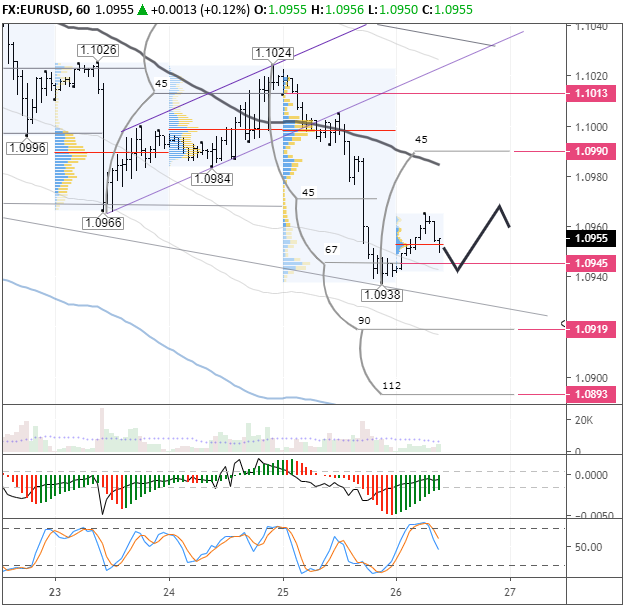
On Thursday the 26th of September, trading on the euro closed down. In the US session, the pair slumped to 1.0909. The 90th degree provided some temporary support. The greenback continues to enjoy increased demand amid continued uncertainty surrounding the UK’s departure from the European Union, as well as from weak European data.
15:30 US: durable goods orders (Aug), personal income (Aug), personal spending (Aug).
17:00 US: Michigan consumer sentiment index (Sep).
20:00 US: Baker Hughes US oil rig count.
Current situation:
Trading on the pair fluctuated throughout the day. The bears took advantage of the rise to 1.0967 to open some short positions. The euro is still looking weak and could continue its downtrend through the end of the year. The single currency has been under pressure since the end of June, and this pressure has only increased week by week. The 1.0880 – 1.0910 range is a key support. If this falls, it will open the way towards 1.0590. On the weekly timeframe, the conditions are ripe for the euro’s collapse.
The US and China are preparing for another round of talks. The Chinese trade minister expressed hope that talks with the US would yield a situation that pleases both sides. Today we’re looking for a double base to form to give the pair a chance to correct to around 1.1010. The 112th degree (1.0883) is providing support. It’s better to go with the trend rather than trying to trade on any rebounds. Even if everything goes according to plan, the bears could come back in force from the LB. We need some compelling factors if we’re going to see a reversal, and there are currently none for the euro.
If you’re looking to make some short-term buys, it would be best to wait for the stochastic to enter the buy zone. It’s also essential to take a look at the EURGBP cross before going long on the euro. If the cross is declining, and there are no signs of a reversal, it would be better to refrain from buying.
If you follow the headline news, read multiple articles a day from different sources on the markets, and are human then you are likely underperforming the market in which you are trying to beat like gold, miners, the SP500 index or whatever it may be.
The information I talk about below and in this video should be a real eye opener for those have not seen technical analysis in action, just how clear the we can see what the stock market, bonds, metals, oil and more will do next. Even at a time like this when the markets are gyrating all over hte place from week to week, we can still gauge our risk and be a winner.
No matter where I go when someone asks me what I do for a living, the person asking has the same “Deer in the headlights” look on their face. I am a technical analyst and trade stocks and commodities for a living with zero external input other than what the price chart of an asset class has painted on the chart.
Most people have never heard of technical analysis for trading or investing, and those that have heard about it think its some type of VooDoo and holds little value. The reality is technical analysis outperforms most of those who trade based on news, earnings, economic data etc…
Why? because all those things are very random data points and unpredictable. If they are important big/smart/insider money has moved into position to take advantage of this before the information becomes public. This is why good news for stocks gets sold into once released for example.
I started trading stocks when I was 16 years old in high school and fall in love with reading charts. Now, 23 years later I have no doubt in my mind technical analysis and trading systems are the absolute best way to trade and invest for growth. Dont get me wrong I spent years digging through company perspectives, reports, press releases and a few years of doing that was almost enough to make me hate trading as it become more like a job and less profitable.
The analysis presented below covers the SP500, Bond, Utilities, Gold, Silver, Oil, and even Bitcoin. This is the analysis I share very day before the opening bell to keep you up to date with current market trends, potentially explosive moves, and set you expectations so you do not become overly emotional and exit a trade early from fear, or excitement.
This Happened Later That Same Day – Washout Low
In the video above I talked about how the SP500 was setting critical support that day, and I did this before the opening bell at 9 am. We just take a look at what the market likes to do intraday with the price to shake traders out of their position and trigger their stop-loss orders just before a market reversal.
I live and die by these three rules for my technical trading
1. IDENTIFY TREND DIRECTION
Trends are more likely to continue then they are to reverse. Draw trend lines on the long-term and short-term charts.
2. FIND SUPPORT & RESISTANCE
Identify critical areas of support and resistance on the price charts. Calculate Fibonacci percent retracements, advancement levels, and other measured moves.
3. TIME CYCLES & SENTIMENT
Use cycle analysis, investor sentiment, volatility, panic selling, greed buying, and price patterns to form accurate price forecasts to use for trading. Opt-in to our free market trend forecast newsletter
Reaching the Charts is Only Half the Equation
Focus Just On The Charts and Ignore All Other Data/Opinions or else you’ll end up with analysis paralysis.
Traders contact me every day confused about which direction to trade. I can tell a couple things very quickly about their issues depending on how they state their problem or question, and its generally a simple fix, or answer that will get them back on track but analysis paralysis is one of the most common issues.
The second half the equation for trading success is a topic most traders turn a blind eye to because it seems confusing, and, or boring. Risk management is the key to long term success and a portfolio value that always goes up and to the right. Believe it or not, its super simple, takes seconds to figure out what position size you should take in any given stock or ETF trade.
In a future post, I am going to talk about how you can take half the financial risk while making 8x more profits. Stay Tuned!
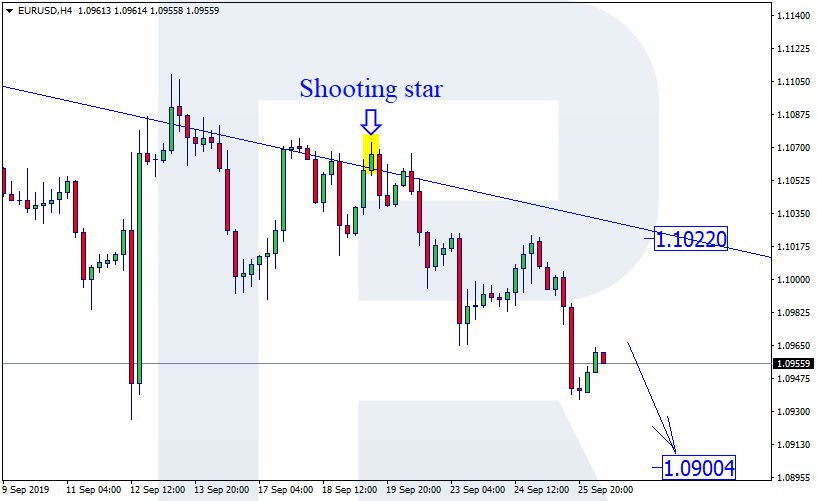
As we can see in the H4 chart, the descending channel continues. Right now, EURUSD is reversing after forming Shooting Star reversal pattern. Later, the price may complete a slight correction and fall to reach 1.0900. However, one shouldn’t exclude a possibility that the price may resume growing towards 1.1022.
USDJPY, “US Dollar vs. Japanese Yen”
As we can see in the H4 chart, the pair is still forming a new rising channel. By now, USDJPY has formed Long-Legged Doji reversal pattern. In the future, the price may reverse and grow to reach 108.55, thus continuing the ascending tendency. However, we shouldn’t ignore a possibility that the instrument may continue its decline to reach 107.00.
Attention! Forecasts presented in this section only reflect the author’s private opinion and should not be considered as guidance for trading. RoboForex LP bears no responsibility for trading results based on trading recommendations described in these analytical reviews.
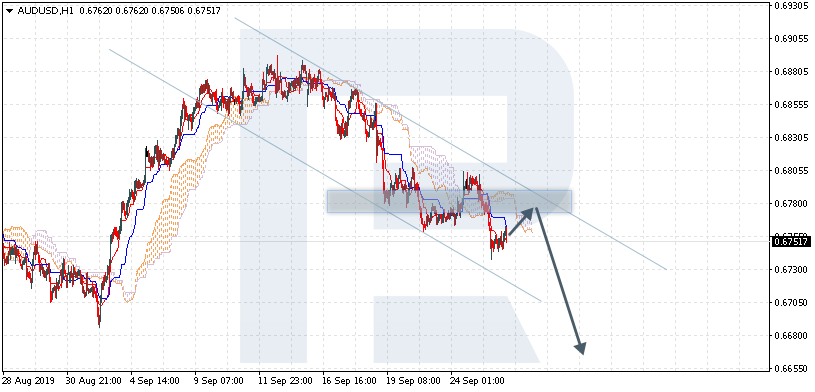
AUDUSD is trading at 0.6751; the instrument is moving below Ichimoku Cloud, thus indicating a descending tendency. The markets could indicate that the price may test the cloud’s upside border at 0.6775 and then resume moving downwards to reach 0.6665. Another signal to confirm further descending movement is the price’s rebounding from the descending channel’s upside border. However, the scenario that implies further decline may be canceled if the price breaks the cloud’s upside border and fixes above 0.6795. In this case, the pair may continue growing towards 0.6875.
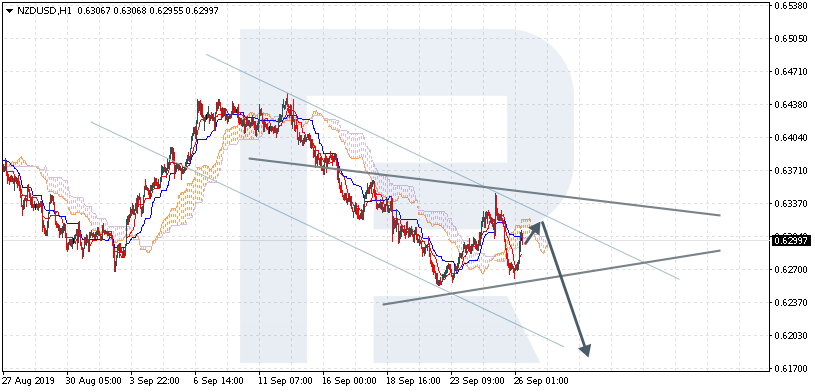
NZDUSD, “New Zealand Dollar vs US Dollar”
NZDUSD is trading at 0.6299; the instrument is moving below Ichimoku Cloud, thus indicating a descending tendency. The markets could indicate that the price may test the cloud’s upside border at 0.6310 and then resume moving downwards to reach 0.6185. Another signal to confirm further descending movement is the price’s rebounding from the descending channel’s upside border. However, the scenario that implies further decline may be canceled if the price breaks the cloud’s upside border and fixes above 0.6340. In this case, the pair may continue growing towards 0.6435. After breaking Triangle’s downside border and fixing below 0.6235, the price may continue moving downwards.
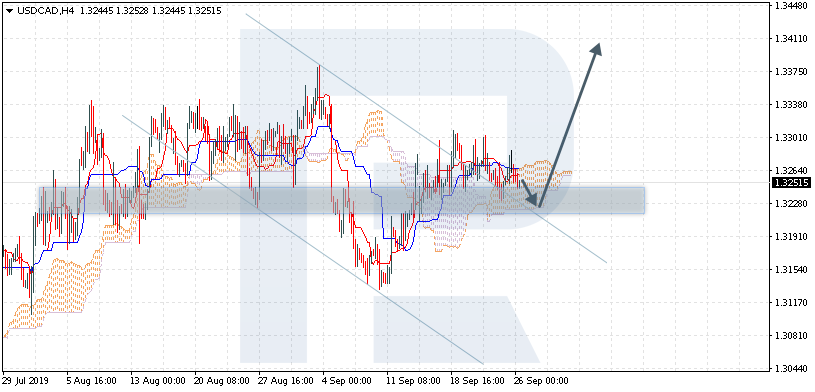
USDCAD, “US Dollar vs Canadian Dollar”
USDCAD is trading at 1.3251; the instrument is moving inside Ichimoku Cloud, thus indicating a sideways tendency. The markets could indicate that the price may test the cloud’s downside border at 1.3230 and then resume moving upwards to reach 1.3410. Another signal to confirm further ascending movement is the price’s rebounding from the descending channel’s upside border. However, the scenario that implies further growth may be canceled if the price breaks the cloud’s downside border and fixes below 1.3195. In this case, the pair may continue falling towards 1.3105.
Attention! Forecasts presented in this section only reflect the author’s private opinion and should not be considered as guidance for trading. RoboForex LP bears no responsibility for trading results based on trading recommendations described in these analytical reviews.
On Wednesday the 25th of September, trading on the euro closed down. The single currency dropped to 1.0938 against the greenback. The US dollar index climbed on the back of a rise in US10Y bond yields. All eyes are on the dollar given uncertainty in the UK over Brexit and Prime Minister Johnson, as well as the ECB easing their monetary policy. Trump has announced that a deal with China could be reached sooner than expected.
Yesterday panned out as expected, with the euro sliding to the 45th degree. In the hours following yesterday’s drop, expect to see some consolidation followed by a further drop to the 90th degree. Keep the 112th degree (1.0893) in your sights.
There’s not much news coming out today. The US GDP report can be ignored. This will be the third reading, which doesn’t have much of an impact on markets given that we’re now coming to the end of the 3rd quarter. Currency movements will by and large be shaped by Trump tweets and developments on Brexit from the UK.
The EUR/USD currency pair again went down. Yesterday, the drop in quotes exceeded 75 points. The trading tool has updated key lows. Greenback was supported by optimistic data on the real estate market in the USA. Heads of the Federal Reserve Bank of Dallas and Chicago said that current interest rates are at an optimal level. Financial market participants continue to monitor political instability in the White House. At the moment, the EUR/USD currency pair is consolidating in the range of 1.09400-1.09650. We recommend to open positions from these marks. Today, investors will evaluate a number of important economic reports from the United States.
The Economic News Feed for 26.09.2019:
– GDP report (US) – 15:30 (GMT+3:00);
– Initial Jobless Claims (US) – 15:30 (GMT+3:00);
– Real Estate Incomplete Sales (US) – 17:00 (GMT+3:00);
Indicators indicate the strength of sellers: the price has fixed below 50 MA and 100 MA.
The MACD histogram is in the negative zone, but above the signal line, which gives a weak signal to sell EUR/USD.
The Stochastic Oscillator is in the neutral zone, the %K line is below the %D line, which signals a bearish mood.
Trading recommendations
Support levels: 1.09400, 1.09000
Resistance levels: 1.09650, 1.09950, 1.10250
If the price consolidates below 1.09400, expect a further drop toward 1.09000.
Alternatively, the quotes could grow toward 1.099900-1.10100.
The GBP/USD currency pair
Technical indicators of the currency pair:
Prev Open: 1.24909
Open: 1.23455
% chg. over the last day: -1.05
Day’s range: 1.23351 – 1.23805
52 wk range: 1.1995 – 1.3385
The GBP/USD currency pair is showing aggressive sales. During yesterday’s trading, the drop in quotations exceeded 140 points. The trading instrument has set new local lows. Sterling remains under pressure due to political instability in the UK. The government intends in the near future to reconsider the issue of holding early elections. Currently, GBP/USD quotes are consolidating in the range 1.23250-1.23800. The pound has the potential to further decline relative to the US currency. Today we recommend paying attention to the news background from the USA. Positions must be opened from key levels.
Pay attention to the speech made by the head of the Bank of England.
Indicators signal the strength of sellers: the price has fixed below 50 MA and 100 MA.
The MACD histogram is in the negative zone, but above the signal line, which gives a weak signal to sell GBP/USD.
The Stochastic Oscillator is near the oversold zone, the %K line is below the %D line, which also indicates a bearish sentiment.
Trading recommendations
Support levels: 1.23250, 1.22700
Resistance levels: 1.23800, 1.24200, 1.24650
If the price consolidates below 1.23250, expect a further drop toward 1.22800-1.22600.
Alternatively, the quotes could grow toward 1.22800-1.22600.
The USD/CAD currency pair
Technical indicators of the currency pair:
Prev Open: 1.32405
Open: 1.32657
% chg. over the last day: +0.11
Day’s range: 1.32457 – 1.32686
52 wk range: 1.2727 – 1.3664
CAD continues to trade in a long flat. There is no defined trend. Participants in financial markets expect additional drivers. Currently, USD/CAD quotes are testing the following local support and resistance levels: 1.32450 and 1.32700, respectively. The USD/CAD currency pair has a downside potential. Today we recommend paying attention to economic releases from the USA, as well as to the dynamics of oil quotes. Positions must be opened from key levels.
The Economic News Feed for 26.09.2019 is calm.
Indicators do not give accurate signals: the price crossed 50 MA and 100 MA.
The MACD histogram has moved into the negative zone, which signals a development of bearish sentiment.
The Stochastic Oscillator is in the neutral zone, the %K line began to cross the %D line. There are no signals at the moment.
Trading recommendations
Support levels: 1.32450, 1.32300, 1.32100
Resistance levels: 1.32700, 1.32900, 1.33100
If the price consolidates below 1.32450, USD/CAD is expected to fall toward 1.32000.
Alternatively, the quotes could grow toward 1.32900-1.33100.
The USD/JPY currency pair
Technical indicators of the currency pair:
Prev Open: 107.046
Open: 107.738
% chg. over the last day: +0.60
Day’s range: 107.576 – 107.775
52 wk range: 104.97 – 114.56
Yesterday, purchases prevailed on the USD/JPY currency pair. The trading tool has updated local highs. Demand for safe haven currencies has weakened due to prospects for a settlement of the trade conflict between Washington and Beijing. At the moment, USD / JPY quotes are consolidating. The key range is 107.550-107.850. The focus is on economic reports from the United States. We recommend opening levels from key support and resistance levels.
The Economic News Feed for 26.09.2019 is calm.
Indicators do not give accurate signals: the price has fixed between 50 MA and 100 MA.
The MACD histogram is in the positive zone, but below the signal line, which gives a weak signal to buy USD/JPY.
The Stochastic Oscillator is in the neutral zone, the %K line crossed the %D line. There are no signals at the moment.
Trading recommendations
Support levels: 107.550, 107.250, 107.000
Resistance levels: 107.850, 108.100, 108.350
If the price consolidates above the resistance level of 107.850, expect further growth toward 108.100-108.350
Alternatively, the quotes could decrease toward 107.300-107.100.
During yesterday’s trading, the US dollar strengthened significantly against a basket of major currencies. Yesterday, the dollar index (#DX) closed the trading session in the positive zone (+0.75%). The demand for greenback grew after statements by the US president about the possibility of concluding a trade deal with China. Yesterday, Donald Trump said that the deal could be concluded even earlier than everyone suspected.
News that Japan and the United States signed an agreement, which is the first stage of a trade deal between the two countries, put additional optimism. The agreement between US President, Donald Trump, and Japanese Prime Minister, Shinzo Abe, aims to regulate the trade in agricultural and industrial goods.
Also, optimistic economic data supported the US currency. So, yesterday, a report on new home sales was published, according to which the figure counted to 713K in August instead of 660K. At the same time, investors are worried about the likely start of Donald Trump’s impeachment, as well as early elections in the UK.
The “black gold” prices are consolidating. Currently, futures for the WTI crude oil are testing the $56.75 mark per barrel.
Market Indicators
Yesterday, there was the bullish sentiment in the US stock markets: #SPY (+0.59%), #DIA (+0.60%), #QQQ (+1.12%).
The 10-year US government bonds yield rose slightly. At the moment, the indicator is at the level of 1.70-1.71%.
The Economic News Feed for 26.09.2019:
– Data on GDP in the US at 15:30 (GMT+3:00);
– Initial jobless claims in the US at 15:30 (GMT+3:00);
– Pending home sales in the US at 17:00 (GMT+3:00).
We also recommend paying attention to the speeches by the President of the ECB Draghi and the FOMC representatives.
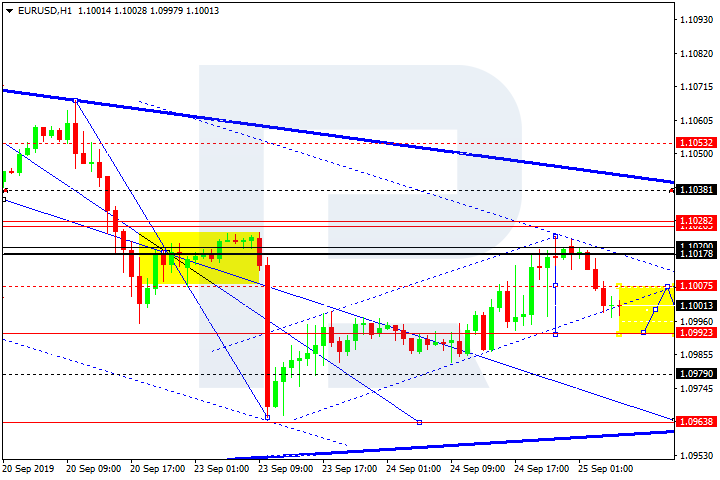
EURUSD has completed the correction at 1.1020; right now, it is moving downwards. Possibly, the pair may reach 1.0982 and then form one more ascending structure towards 1.1002. After that, the instrument may resume trading inside the downtrend with the target at 1.0960.
GBPUSD, “Great Britain Pound vs US Dollar”
GBPUSD has finished the correction at 1.2500; right now, it is moving downwards to reach 1.2400. Later, the market may start another growth towards 1.2460 and then form a new descending structure with the target at 1.2310.
USDCHF, “US Dollar vs Swiss Franc”
USDCHF is moving upwards with the target at 0.9880. After that, the instrument may fall towards 0.9860 and then start a new growth with the first target at 0.9920.
USDJPY, “US Dollar vs Japanese Yen”
USDJPY is forming the ascending impulse towards 107.45. Later, the market may start a new correction to reach 107.20 and then resume trading upwards with the target at 107.77.
AUDUSD, “Australian Dollar vs US Dollar”
AUDUSD has completed the correction at 0.6800. Possibly, the pair may form one more ascending structure towards 0.6815. Later, the market may start a new decline with the target at 0.6740.
USDRUB, “US Dollar vs Russian Ruble”
USDRUB is consolidating in the center of the range around 63.83. Today, the pair may fall to reach 63.30 and then start a new rising correction towards 65.00.
USDCAD, “US Dollar vs Canadian Dollar”
USDCAD is trading to rebound from 1.3230 upwards. Possibly, today the pair may grow to reach 1.3260 and then resume falling towards 1.3227. Later, the market may form one more ascending structure with the target at 1.3300.
XAUUSD, “Gold vs US Dollar”
Gold continues moving upwards. Possibly, the pair may reach 1540.00 and then form a new descending structure with the first target at 1512.00.
BRENT
Brent has broken 63.15 downwards. Possibly, today the pair may choose an alternative scenario, which implies that it may grow to test this level from below and then resume moving downwards to reach 60.70. However, the main scenario suggests that the market may continue growing with the target at 68.88.
BTCUSD, “Bitcoin vs US Dollar”
After reaching the predicted downside target at 8800.00 without any corrections and extending the wave towards 8100.00, BTCUSD has completed the ascending impulse; right now, it is correcting to reach 8400.00. After that, the instrument may start a new growth to reach 9400.00 and then resume trading downwards with the target at 7900.00. Later, the market may start another correction towards 11100.00.
Attention! Forecasts presented in this section only reflect the author’s private opinion and should not be considered as guidance for trading. RoboForex LP bears no responsibility for trading results based on trading recommendations described in these analytical reviews.
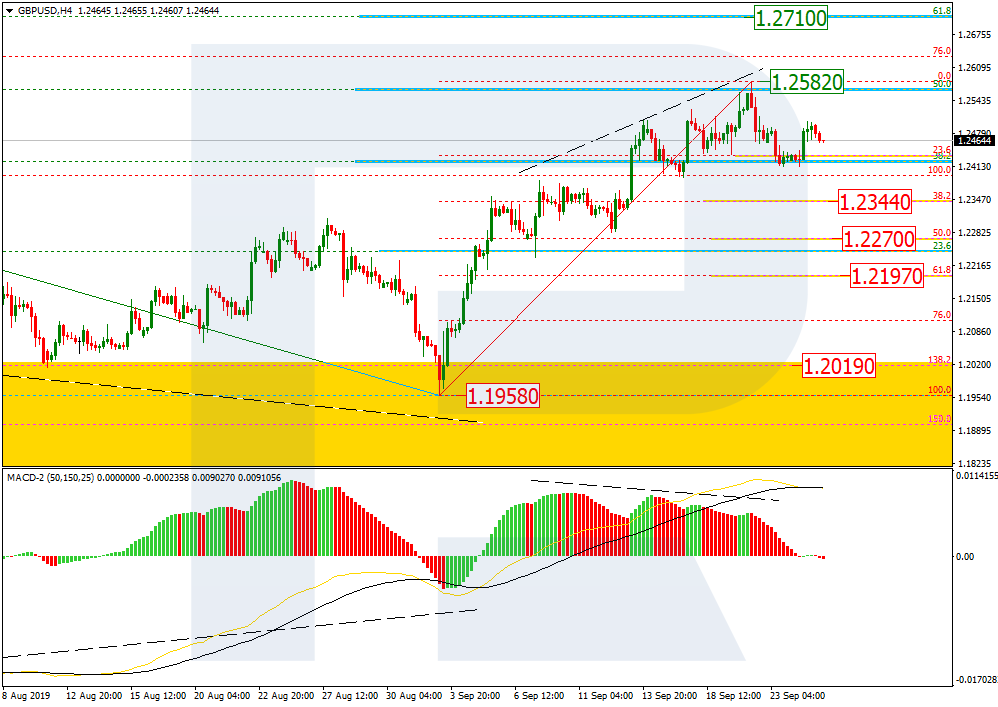
As we can see in the H4 chart, there was a divergence on MACD, which made the pair start a new descending tendency after reaching 50.0% fibo. GBPUSD is slowly falling to reach 23.6% fibo, but a local ascending impulse hints at a new growth towards the high at 1.2518 and then mid-term 61.8% fibo at 1.2710. However, the key scenario implies further decline towards 38.2%, 50.0%, and 61.8% fibo at 1.2344, 1.2270, and 1.2197 respectively.
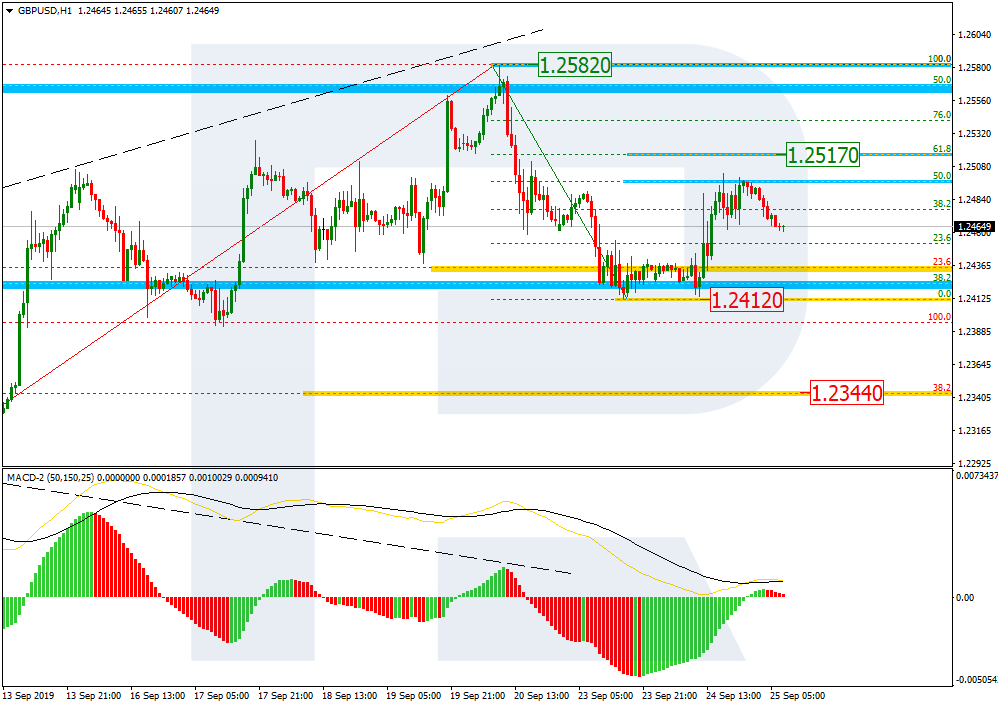
In the H1 chart, the pair is forming a new short-term correction after finishing another descending impulse. By now, the pullback has already reached 50.0% fibo and may yet continue towards 61.8% fibo at 1.2517. If the price breaks the local low at 1.2412, the mid-term decline may continue.
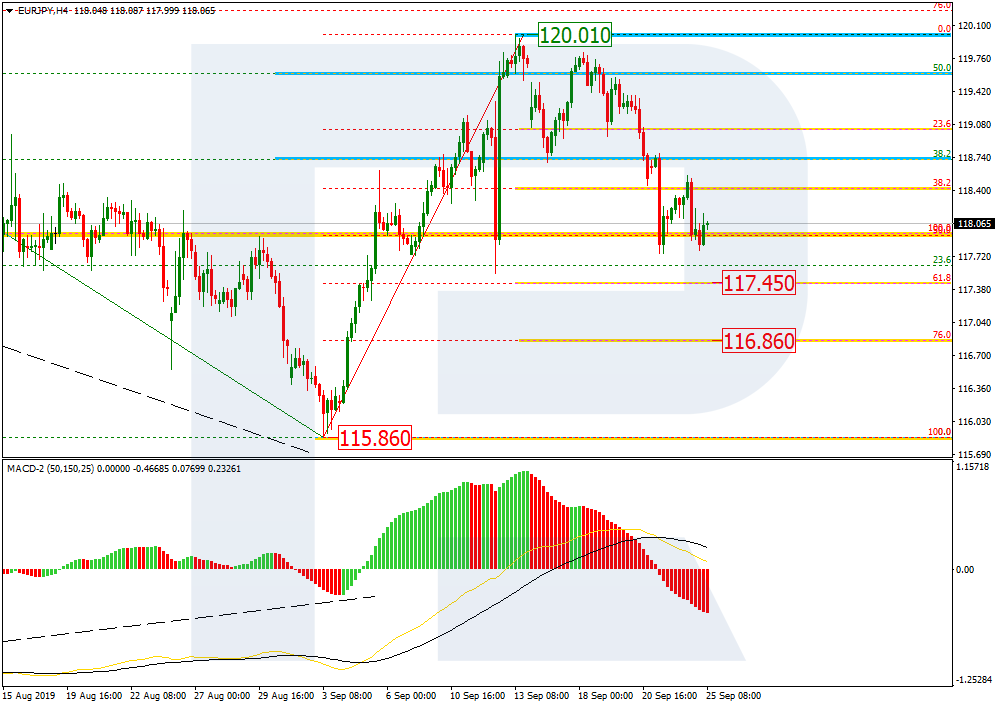
EURJPY, “Euro vs. Japanese Yen”
As we can see in the H4 chart, after completing the correctional uptrend at 50.0% fibo, EURJPY is quickly trading downwards. By now, it has already reached 50.0% fibo. After finishing a short-term correction, the price may continue falling towards 61.8% and 76.0% fibo at 117.45 and 116.86 respectively. The key support is the low at 115.86.
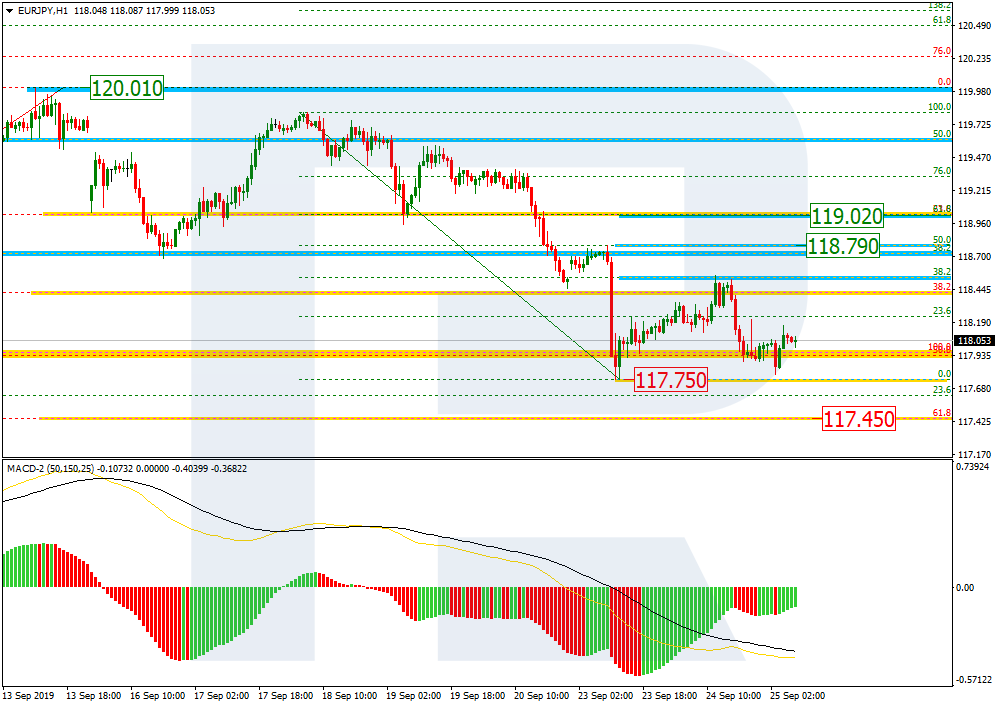
In the H1 chart, the price is correcting upwards and has already reached 38.2% fibo. The next correctional wave may be heading towards 50.0% and 61.8% fibo at 118.79 and 119.02 respectively. The support is the low at 117.75.
Attention! Forecasts presented in this section only reflect the author’s private opinion and should not be considered as guidance for trading. RoboForex LP bears no responsibility for trading results based on trading recommendations described in these analytical reviews.
The EUR/USD currency pair has stabilized. Unidirectional trends are not observed. Greenback demand weakened after the release of weak data on consumer confidence in the United States. At the moment, EUR/USD quotes are testing local support and resistance levels 1.09900 and 1.10250. Financial markets participants expect additional drivers. We recommend that you keep track of up-to-date information regarding trade negotiations between Washington and Beijing. Positions must be opened from key levels. Also, keep an eye on the FOMC representatives.
At 17:00 (GMT+3:00) the US will publish a report on the primary real estate sales.
Indicators do not give accurate signals: the price crossed 50 MA and 100 MA.
The MACD histogram is located near the 0 mark.
The Stochastic Oscillator is in the oversold zone, the %K line crossed the %D line. There are no signals at the moment.
Trading recommendations
Support levels: 1.09900, 1.09650, 1.09300
Resistance levels: 1.10250, 1.10600, 1.10850
f the price consolidates below 1.09900, expect the quotes to fall toward 1.09600-1.09400.
Alternatively, the quotes can grow toward 1.10500-1.10700.
The GBP/USD currency pair
Technical indicators of the currency pair:
Prev Open: 1.24328
Open: 1.24909
% chg. over the last day: +0.44
Day’s range: 1.24610 – 1.24977
52 wk range: 1.1995 – 1.3385
Yesterday, bullish mood prevailed on the GBP/USD currency pair. Demand for the pound rose after reports that the UK Supreme Court ruled that Boris Johnson’s decision to suspend parliament was illegal. This allows parliamentarians more time to avoid the hard Brexit scenario. At the moment, the key support and resistance levels are 1.24550 and 1.25000, respectively. We recommend opening positions from key levels.
The Economic News Feed for 25.09.2019 is calm.
Indicators do not give accurate signals: the price crossed 50 MA and 100 MA.
The MACD histogram is in the positive zone, but below the signal line, which gives a weak signal to buy GBP/USD.
The Stochastic Oscillator is in the oversold zone, the %K line crossed the %D line. There are no signals at the moment.
Trading recommendations
Support levels: 1.24550, 1.24150, 1.23900
Resistance levels: 1.25000, 1.25550, 1.25800
If the price consolidates below 1.24550, GBP/USD is expected to fall toward 1.24000.
Alternatively, the quotes could grow toward 1.25300-1.25500.
The USD/CAD currency pair
Technical indicators of the currency pair:
Prev Open: 1.32567
Open: 1.32405
% chg. over the last day: -0.18
Day’s range: 1.32352 – 1.32653
52 wk range: 1.2727 – 1.3664
The technical picture on the USD/CAD currency pair is still ambiguous. Looney continues to bargain in flat. At the moment, the following key support and resistance levels can be distinguished: 1.32350 and 1.32650, respectively. USD / CAD quotes have the potential to decline. Today, participants in financial markets will evaluate statistics on the real estate market in the United States. We also recommend paying attention to the dynamics of oil quotes. Positions must be opened from key levels.
The Economic News Feed for 25.09.2019 is calm.
Indicators do not give accurate signals: the price crossed 50 MA and 100 MA.
The MACD histogram is located near 0. There are no signals at the moment.
The Stochastic Oscillator is in the overbought zone, the %K line crossed the %D line. There are no signals at the moment.
Trading recommendations
Support levels: 1.32350, 1.32100, 1.31800
Resistance levels: 1.32650, 1.32850, 1.33100
If the price consolidates below 1.32350, USD/CAD is expected to fall. The quotes will move toward 1.32000-1.31800.
Alternatively, the quotes can grow toward 1.33000.
The USD/JPY currency pair
Technical indicators of the currency pair:
Prev Open: 107.540
Open: 107.046
% chg. over the last day: -0.37
Day’s range: 106.982 – 107.424
52 wk range: 104.97 – 114.56
USD/JPY remains in a bearish mood. The trading instrument set the new local minimums. The quotes found support and the new level of 107.000. 107.400 acts as a mirror resistance. The safe haven currency can grow against USD. Keep tracking relevant info about the US/China negotiations. Open positions from the key levels.
The Economic News Feed for 25.09.2019:
– Economic Event (JPY) – 00:00 (GMT+3:00);
– Economic Event (JPY) – 00:00 (GMT+3:00);
– Economic Event (JPY) – 00:00 (GMT+3:00);
The indicators point toward the power of the sellers: the price fixed below 50 MA and 100 MA.
The MACD histogram is in the negative zone but above the signal line which gives a weak signal to sell USD/JPY.
The Stochastic Oscillator is near the overbought zone, the %K line has crossed the %D line. There are no signals at the moment.
Trading recommendations
Support levels: 107.000, 106.700
Resistance levels: 107.400, 107.700, 107.850
If the price fixes below 107.000, expect further descend towards 106.700-106.500.
Alternatively, the quotes can grow toward 107.700-107.850.
 Current situation: