Author Archive for InvestMacro – Page 163

Will ADP disappoint similar to the ISM and push Gold back above 1,500?

By Admiral Markets

Source: Economic Events October 2, 2019 – Admiral Markets’ Forex Calendar

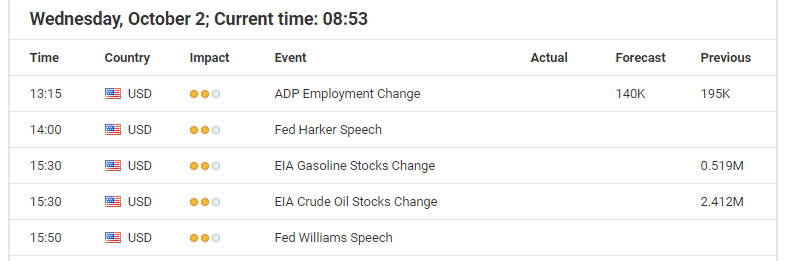
Today, our focus will be on Gold and the potential market-moving news event “ADP Employment Change”.

With the precious metal breaking below 1,480 into the start of the week, a significant short-term region of support, it pushed back above after the ISM Manufacturing index fell to 47.8% for September, marking the lowest level since June 2009 and ISM employment dropping to 46.3 points.

This is all in all not a very good sign in regards to today’s ADP data set, since the previous prints can all in all be considered ‘mixed’ in our opinion with private businesses hired 195k workers in August 2019 (more than the expected 149k), but July’s numbers were downwardly revised to 142k a weak print is definitely an option.

That said, a reading significantly below the expected 140k would potentially trigger US dollar weakness and thus Gold would help to make it back towards 1,500 USD, further increasing chances of a 50 basis point rate cut by the Fed into the end.

On the other hand, a surprisingly better than expected reading could result in a continuation of the bearish momentum isn’t something we consider to be a big deal, since we see a potential mid-term long trigger around 1,440/450 USD with the overall mid-term price target on the upside around 1,650/700 USD staying active:

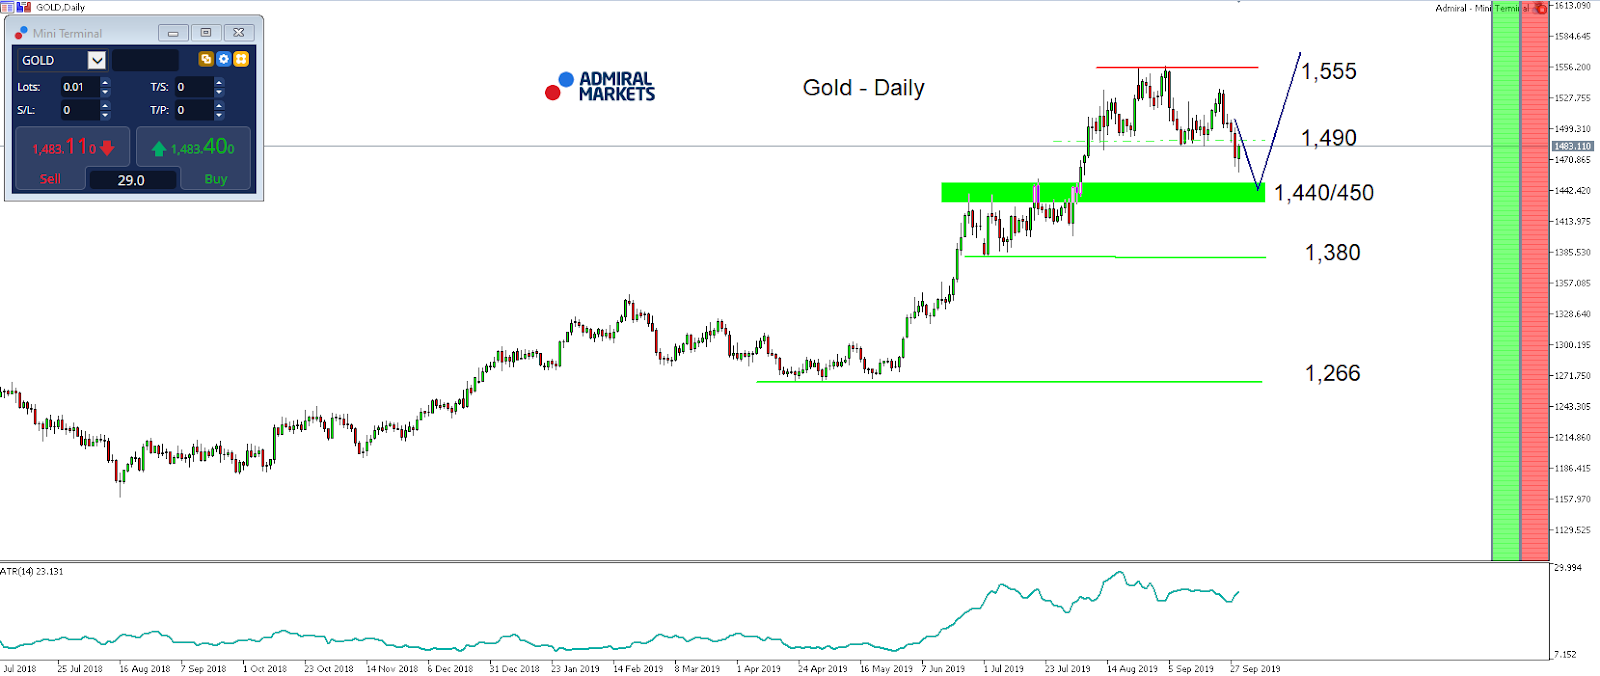
Source: Admiral Markets MT5 with MT5-SE Add-on Gold Daily chart (between July 3, 2018, to October 1, 2019). Accessed: October 1, 2019, at 10:00pm GMT – Please note: Past performance is not a reliable indicator of future results, or future performance.

In 2014, the value of Gold fell by 1.7%, in 2015, it fell by 10.4%, in 2016, it increased by 8.1%, in 2017, it increased by 13.1%, in 2018, it fell by 1.6%, meaning that after five years, it was up by 6.4%.

Discover the world’s #1 multi-asset platform

Admiral Markets offers professional traders the ability to trade with a custom, upgraded version of MetaTrader 5, allowing you to experience trading at a significantly higher, more rewarding level. Experience benefits such as the addition of the Market Heat Map, so you can compare various currency pairs to see which ones might be lucrative investments, access real-time trading data, and so much more. Click the banner below to start your FREE download of MT5 Supreme Edition!

Download MetaTrader 5 and begin trading today!

Disclaimer: The given data provides additional information regarding all analysis, estimates, prognosis, forecasts or other similar assessments or information (hereinafter “Analysis”) published on the website of Admiral Markets. Before making any investment decisions please pay close attention to the following:

  1. This is a marketing communication. The analysis is published for informative purposes only and are in no way to be construed as investment advice or recommendation. It has not been prepared in accordance with legal requirements designed to promote the independence of investment research, and that it is not subject to any prohibition on dealing ahead of the dissemination of investment research.
  2. Any investment decision is made by each client alone whereas Admiral Markets shall not be responsible for any loss or damage arising from any such decision, whether or not based on the Analysis.
  3. Each of the Analysis is prepared by an independent analyst (Jens Klatt, Professional Trader and Analyst, hereinafter “Author”) based on the Author’s personal estimations.
  4. To ensure that the interests of the clients would be protected and objectivity of the Analysis would not be damaged Admiral Markets has established relevant internal procedures for prevention and management of conflicts of interest.
  5. Whilst every reasonable effort is taken to ensure that all sources of the Analysis are reliable and that all information is presented, as much as possible, in an understandable, timely, precise and complete manner, Admiral Markets does not guarantee the accuracy or completeness of any information contained within the Analysis. The presented figures refer that refer to any past performance is not a reliable indicator of future results.
  6. The contents of the Analysis should not be construed as an express or implied promise, guarantee or implication by Admiral Markets that the client shall profit from the strategies therein or that losses in connection therewith may or shall be limited.
  7. Any kind of previous or modeled performance of financial instruments indicated within the Publication should not be construed as an express or implied promise, guarantee or implication by Admiral Markets for any future performance. The value of the financial instrument may both increase and decrease and the preservation of the asset value is not guaranteed.
  8. The projections included in the Analysis may be subject to additional fees, taxes or other charges, depending on the subject of the Publication. The price list applicable to the services provided by Admiral Markets is publicly available from the website of Admiral Markets.
  9. Leveraged products (including contracts for difference) are speculative in nature and may result in losses or profit. Before you start trading, you should make sure that you understand all the risks.

By Admiral Markets

Ichimoku Cloud Analysis 01.10.2019 (AUDUSD, NZDUSD, USDCAD)

Article By RoboForex.com

AUDUSD, “Australian Dollar vs US Dollar”

AUDUSD is trading at 0.6706; the instrument is moving below Ichimoku Cloud, thus indicating a descending tendency. The markets could indicate that the price may test Tenkan-Sen and Kijun-Sen at 0.6745 and then resume moving downwards to reach 0.6615. Another signal to confirm further descending movement is the price’s rebounding from the descending channel’s upside border. However, the scenario that implies further decline may be canceled if the price breaks the cloud’s upside border and fixes above 0.6805. In this case, the pair may continue growing towards 0.6885.

AUDUSD
Risk Warning: the result of previous trading operations do not guarantee the same results in the future

NZDUSD, “New Zealand Dollar vs US Dollar”

NZDUSD is trading at 0.6233; the instrument is moving below Ichimoku Cloud, thus indicating a descending tendency. The markets could indicate that the price may test Tenkan-Sen and Kijun-Sen at 0.6265 and then resume moving downwards to reach 0.6160. Another signal to confirm further descending movement is the price’s rebounding from the descending channel’s upside border. However, the scenario that implies further decline may be canceled if the price breaks the cloud’s upside border and fixes above 0.6330. In this case, the pair may continue growing towards 0.6425.

NZDUSD
Risk Warning: the result of previous trading operations do not guarantee the same results in the future

USDCAD, “US Dollar vs Canadian Dollar”

USDCAD is trading at 1.3251; the instrument is moving inside Ichimoku Cloud, thus indicating a sideways tendency. The markets could indicate that the price may test the cloud’s downside border at 1.3245 and then resume moving upwards to reach 1.3355. Another signal to confirm further ascending movement is the price’s rebounding from the rising channel’s downside border. However, the scenario that implies further growth may be canceled if the price breaks the cloud’s downside border and fixes below 1.3210. In this case, the pair may continue falling towards 1.3115. After breaking Wedge’s upside border and fixing above 1.3275, the price may continue moving upwards.

USDCAD

Article By RoboForex.com

Attention!
Forecasts presented in this section only reflect the author’s private opinion and should not be considered as guidance for trading. RoboForex LP bears no responsibility for trading results based on trading recommendations described in these analytical reviews.

Japanese Candlesticks Analysis 01.10.2019 (EURUSD, USDJPY)

Article By RoboForex.com

EURUSD, “Euro vs. US Dollar”

As we can see in the H4 chart, the descending channel continues. Right now, EURUSD is still reversing after forming Shooting Star reversal pattern. Later, the price may complete a slight correction and fall to reach 1.0852. However, one shouldn’t exclude a possibility that the price may resume growing towards 1.1022.

EURUSD
Risk Warning: the result of previous trading operations do not guarantee the same results in the future

USDJPY, “US Dollar vs. Japanese Yen”

As we can see in the H4 chart, the pair continues trading upwards. Right now, USDJPY is reversing after forming Long-Legged Doji reversal pattern. In the future, after a slight pullback, the price may continue growing to reach 108.55. However, we shouldn’t ignore a possibility that the instrument may continue its decline to reach 107.00.

USDJPY

Article By RoboForex.com

Attention!
Forecasts presented in this section only reflect the author’s private opinion and should not be considered as guidance for trading. RoboForex LP bears no responsibility for trading results based on trading recommendations described in these analytical reviews.

The Analytical Overview of the Main Currency Pairs on 2019.10.01

by JustForex

The EUR/USD currency pair

Technical indicators of the currency pair:
  • Prev Open: 1.09406
  • Open: 1.08982
  • % chg. over the last day: -0.39
  • Day’s range: 1.08832 – 1.09009
  • 52 wk range: 1.0884 – 1.1623

The single currency continues to lose ground against the US dollar. EUR/USD quotes have reached a minimum since May 2017. At the moment, the trading instrument is testing the local support level of 1.08800. Mark 1.09100 is already a mirror resistance. Today, investors will evaluate important statistical data from Germany, the EU and the United States. We do not exclude a further decline in the EUR/USD currency pair. We recommend opening positions from key levels.

The Economic News Feed for 01.10.2019:

  • – Business activity index in the manufacturing sector (GER) – 10:55 (GMT+3:00);
  • – Business activity index in the manufacturing sector (EU) – 11:00 (GMT+3:00);
  • – Inflation report (EU) – 12:00 (GMT+3:00);
  • – Business activity index in the manufacturing sector (US) – 17:00 (GMT+3:00).

We also recommend that you pay attention to the statements of the FOMC representatives and the head of the ECB.

EUR/USD

Indicators signal the strength of sellers: the price has fixed below 50 MA and 100 MA.

The MACD histogram is in the negative zone and continues to decline, which indicates a bearish sentiment.

Stochastic Oscillator is near the oversold zone, the %K line crossed the %D line. There are no signals at the moment.

Trading recommendations
  • Support levels: 1.08800, 1.08500
  • Resistance levels: 1.09100, 1.09450, 1.09650

If the price consolidates below 1.08800, consider selling as the price moves toward 1.08500-1.08300.

Alternatively, the quotes can correct toward 1.09400-1.09600.

The GBP/USD currency pair

Technical indicators of the currency pair:
  • Prev Open: 1.08500-1.08300
  • Open: 1.22891
  • % chg. over the last day: +0.02
  • Day’s range: 1.22722 – 1.22949
  • 52 wk range: 1.1995 – 1.3385

The GBP/USD currency pair is in lateral movement. There are no defined trends. The trading tool tests local support and resistance levels at 1.22750 and 1.23250. Market participants are waiting for new information regarding the Brexit process. GBP can decline further against the US dollar. Positions must be opened from key levels.

At 11:30 (GMT+3:00) UK will publish a business activity index in the manufacturing sector.

GBP/USD

Indicators signal the strength of sellers: the price has fixed below 50 MA and 100 MA.

The MACD histogram is in the negative zone, which gives a signal to sell GBP/USD.

The Stochastic Oscillator is in the neutral zone, the %K line crossed the %D line. There are no signals at the moment.

Trading recommendations
  • Support levels: 1.22750, 1.22400
  • Resistance levels: 1.23250, 1.23750, 1.24150

If the price consolidates below 1.22750, expect a further descend toward 1.22400-1.22200.

Alternatively, the quotes could grow toward 1.23600-1.23800.

The USD/CAD currency pair

Technical indicators of the currency pair:
  • Prev Open: 1.32362
  • Open: 1.32424
  • % chg. over the last day: +0.05
  • Day’s range: 1.32339 – 1.32568
  • 52 wk range: 1.2727 – 1.3664

The USD/CAD currency pair continues to trade in a protracted flat. The technical picture is ambiguous. Currently, the local support and resistance levels are: 1.32300 and 1.32600, respectively. Today, investors will evaluate important economic releases from Canada and the United States, which can have a significant impact on Looney. We also recommend paying attention to the dynamics of oil quotes. Positions must be opened from key levels.

At 15:30 (GMT+3:00) we expect statistics on Canada’s GDP.

USD/CAD

Indicators do not give accurate signals: the price crossed 50 MA and 100 MA.

The MACD histogram has started to rise, indicating the development of bullish sentiment.

The Stochastic Oscillator is in the overbought zone, the %K line is above the %D line, which gives a weak signal to buy USD / CAD.

Trading recommendations
  • Support levels: 1.32300, 1.32100, 1.31800
  • Resistance levels: 1.32600, 1.32800, 1.33000

If the price consolidates below 1.32300, USD/CAD quotes are expected to fall to 1.32000-1.31800.

Alternatively, the quotes could grow toward 1.32800-1.33000.

The USD/JPY currency pair

Technical indicators of the currency pair:
  • Prev Open: 107.965
  • Open: 108.080
  • % chg. over the last day: +0.11
  • Day’s range: 108.045 – 108.296
  • 52 wk range: 104.97 – 114.56

Purchases prevail on the USD/JPY currency pair. The trading tool has reached key extremes. At the moment, USD/JPY quotes are testing the offer zone 108.300-108.450. A round level of 108,000 is the immediate support. Investors are expecting important economic reports from the United States. We recommend that you keep track of up-to-date information regarding trade negotiations between Washington and Beijing. Positions must be opened from key levels.

During the Asian trading session, Tankan published optimistic statistics on the Japanese economy.

USD/JPY

Indicators signal the strength of buyers: the price has fixed above 50 MA and 100 MA.

The MACD histogram is in the positive zone and above the signal line, which gives a strong signal to buy USD/JPY.

The Stochastic Oscillator is in the neutral zone, the %K line is below the %D line, which indicates a bearish sentiment.

Trading recommendations
  • Support levels: 108.000, 107.750, 107.500
  • Resistance levels: 108.300, 108.450, 108.800

If the price consolidates above 108.300, expect further growth of the USD/JPY currency pair to 108.600-108.800.

Alternatively, the quotes could drop toward 107.800-107.600.

by JustForex

EURUSD: Eurozone inflation data could increase pressure on the euro

By Alpari.com

On Monday the 30th of September, trading on the EURUSD pair closed down. The euro slipped after the publication of German inflation data as well as remarks from ECB head Mario Draghi, who made note of the fact that speculators have started reacting to his comments at other events, rather than only at ECB press conferences.

September’s CPI turned out worse than expected and lower than the previous reading. Reduced inflation is a sign of an economic slowdown. Mario Draghi hinted that the ECB still has a few tricks up its sleeve that it can use to ease its monetary policy.

The single currency was put under additional pressure by the decline on the commodity currencies resulting from a 4% drop in oil prices.

Day’s news (GMT+3):

  • 10:30 Switzerland: SVME – PMI (Sep).
  • 10:50 France: Markit manufacturing PMI (Sep).
  • 10:55 Germany: Markit manufacturing PMI (Sep).
  • 11:00 Eurozone: Markit manufacturing PMI (Sep).
  • 11:30 UK: Markit manufacturing PMI (Sep).
  • 12:00 Eurozone: CPI (Sep).
  • 15:30 Canada: GDP (Jul).
  • 16:45 US: Markit manufacturing PMI (Sep).
  • 17:00 US: ISM manufacturing PMI (Sep), construction spending (Aug).

EURUSD H1Current situation:

Expectations of a rise on Monday were denied. This possibility was ruled out with the pair’s return to the balance line. With the breakout of 1.0920, the target of 1.0983 became untenable. In the space of 2 hours, the pair slid to 1.0885.

In the Asian session, the euro is trading at 1.0882. The bears are breaking through the downwards channel. Since the trend on the hourly timeframe is bearish, this drop could gather pace. The euro crosses are currently enjoying increased demand. They’re currently propping the euro up against the dollar, but the technical picture doesn’t look good for the bulls. The market is lacking any drivers for growth, or for increasing the number of buyers. We either need to see some big players show up, or for some bulls to come in to defend 1.0880 (67 degrees) and overpower the bears.

We expect to see a drop to the 90th degree at 1.0854. Just above this level is a line drawn through the 1.0966 (23/09) and 1.0905 (27/09) lows.

The pair has dropped to the 67th degree, a level from which we often see a correction. The bears came into play after the release of German inflation data. Eurozone inflation data is coming out today at 12:00 (GMT+3). We should expect some volatility here and then again at 17:00.

By Alpari.com

Dollar Index Has Updated Two-Year Highs

by JustForex

The greenback continues to strengthen against a basket of world currencies. The dollar index (#DX) has updated two-year highs. Demand for the US currency is still at a high level before the publication of important economic releases. Most experts expect improvements in key indicators in the US economy. Trade negotiations between Washington and Beijing, as well as the situation concerning Brexit, remain in the focus of attention.

The Aussie collapsed after a meeting of the Reserve Bank of Australia. The regulator, as expected, lowered its key interest rate by 25 basis points to 0.75%. The Central Bank has expressed concern about employment growth. Today, mixed statistics on the Eurozone economy were published. In September, the index of economic activity in the manufacturing sector counted to 45.7, which was higher than the market expectations of 45.6. At the same time, the consumer price index slowed down from 1.0% (YoY) to 0.9% (YoY).

The “black gold” prices have been growing after the collapse the day before. Currently, futures for the WTI crude oil are testing the $54.65 mark per barrel.

Market Indicators

Yesterday, there was the bullish sentiment in the US stock markets: #SPY (+0.46%), #DIA (+0.44%), #QQQ (+0.95%).

The 10-year US government bonds yield shows positive dynamics. At the moment, the indicator is at the level of 1.73-1.74%.

The Economic News Feed for 01.10.2019:
  • – ISM manufacturing PMI at 17:00 (GMT+3:00).


We also recommend paying attention to the statements by the FOMC representatives and the head of the ECB.

by JustForex

Technical Traders: New SP500 Trend Indicator, Website, and more!

By TheTechnicalTraders.com

We have now gone live with our new member’s area and it going to be amazing
with all the new trading tools, indicators, and analysis we will be adding to it.

Watch this short video and get ready to be a full-fledged technical trader
and trade stress–free and with confidences.

Access Now And Know When To Buy & Sell
CLICK HERE


Forex Technical Analysis & Forecast 30.09.2019 (EURUSD, GBPUSD, USDCHF, USDJPY, AUDUSD, USDRUB, USDCAD, GOLD, BRENT, BTCUSD)

Article By RoboForex.com

EURUSD, “Euro vs US Dollar”

After breaking 1.0926 upwards, EURUSD has completed the ascending correction at 1.0955. According to the main scenario, today the price is expected to continue falling towards 1.0916. Later, the market may start another growth to reach 1.0930 and then resume trading downwards with the target at 1.0905. if the pair reaches 1.0950 and breaks it, the instrument may continue the correction towards 1.0966 (an alternative scenario).

EURUSD
Risk Warning: the result of previous trading operations do not guarantee the same results in the future

GBPUSD, “Great Britain Pound vs US Dollar”

After rebounding from 1.2320 downwards, GBPUSD is falling to reach 1.2261. After that, the instrument may start a new correction towards 1.2320 and then resume trading downwards with the target at 1.2242.

GBPUSD
Risk Warning: the result of previous trading operations do not guarantee the same results in the future

USDCHF, “US Dollar vs Swiss Franc”

USDCHF is consolidating around 0.9955; right now, it is forming one more ascending structure to reach this level. Possibly, the pair may start a new decline towards 0.9898 to continue the correction (an alternative scenario). According to the main scenario, the price is expected to continue trading inside the uptrend with the target at 0.9966.

USDCHF
Risk Warning: the result of previous trading operations do not guarantee the same results in the future

USDJPY, “US Dollar vs Japanese Yen”

USDJPY has returned to 107.82. Possibly, today the pair may grow to break 108.02 and then continue trading upwards to reach 108.23. After that, the instrument may start a new correction with the target at 107.80.

USDJPY
Risk Warning: the result of previous trading operations do not guarantee the same results in the future

AUDUSD, “Australian Dollar vs US Dollar”

AUDUSD is consolidating above 0.6747. Possibly, the pair may break this level to the downside and then continue falling to reach 0.6737 at least. Later, the market may form one more ascending structure with the target at 0.6777.

AUDUSD
Risk Warning: the result of previous trading operations do not guarantee the same results in the future

USDRUB, “US Dollar vs Russian Ruble”

USDRUB continues consolidating above 64.05. Possibly, the pair may grow to reach 64.55 and then start another decline to break 63.88. Later, the market may continue trading inside the downtrend with the target at 63.30.

USDRUB
Risk Warning: the result of previous trading operations do not guarantee the same results in the future

USDCAD, “US Dollar vs Canadian Dollar”

After completing the descending wave at 1.32220, USDCAD has formed another ascending impulse towards 1.3260; right now, it is correcting towards 1.3228. After that, the instrument may grow to break 1.3249 and then continue trading upwards with the first target at 1.3267.

USDCAD
Risk Warning: the result of previous trading operations do not guarantee the same results in the future

XAUUSD, “Gold vs US Dollar”

Gold is falling with the target at 1484.55. After that, the instrument may start a new growth with the target at 1493.77 and then continue trading downwards to reach 1472.00.

GOLD
Risk Warning: the result of previous trading operations do not guarantee the same results in the future

BRENT

Brent has completed the ascending impulse at 62.66 along with the correction towards 61.30; right now, it is moving towards 64.55. Later, the market may form a new descending structure to reach 62.60 and then continue trading upwards with the first target at 67.77.

BRENT
Risk Warning: the result of previous trading operations do not guarantee the same results in the future

BTCUSD, “Bitcoin vs US Dollar”

BTCUSD continues falling towards 7790.00. Today, the pair may reach this level and then start a new growth to reach 8046.00. After that, the instrument may fall to reach 7510.00 or even continue the downtrend towards 7373.00.

BITCOIN

Article By RoboForex.com

Attention!
Forecasts presented in this section only reflect the author’s private opinion and should not be considered as guidance for trading. RoboForex LP bears no responsibility for trading results based on trading recommendations described in these analytical reviews.

Pound Stays at its Three Weeks Lows

By Dmitriy Gurkovskiy, Chief Analyst at RoboForex

The British Pound is still very sensitive to any news somehow relating to the Brexit.

The European Union insists on more detailed and legally correct negotiations of the Irish border issue and says that it should be done very quickly. The EU is “firmly united”, as the major European negotiator Michel Barnier said last Friday, and has to protect its own interests.

At the same time, the Secretary of State for Exiting the European Union Stephen Barclay believes that there are a lot of things to negotiate ahead. In his opinion, the deal is possible in case both parties have goodwill to clinch it, but policymakers still have too many issues to discuss.

The United Kingdom is set to exit the European Union in a month, on October 31st, but no documents have been ready so far. The longer the story, the more critical and bleaker the British political turmoil and economic outlook.

In the H4 chart, GBPUSD is moving downwards; this movement may be considered as the third wave inside the downtrend. Today, the pair may reach 1.2260 and then start one more ascending structure towards 1.2320. Later, the market may fall to reach 1.2242 and then start a new correction with the target at 1.2360. From the technical point of view, this scenario is confirmed by MACD Oscillator: its signal line is moving below 0. However, the line may move upwards, thus confirming the correction. After the correction, the downtrend may resume.

As we can see in the H1 chart, GBPUSD is falling with the target at 1.2261. After reaching it, the pair may correct towards 1.2318. Later, the market may resume trading downwards to reach 1.2241 and then start another correction towards 1.2370. From the technical point of view, this scenario is confirmed by Stochastic Oscillator: its signal line is moving above 50 and getting closer to the “overbought area”. In the future, the indicator is expected to rebound from 80 and resume falling to reach 20.

Disclaimer

Any predictions contained herein are based on the authors’ particular opinion. This analysis shall not be treated as trading advice. RoboForex shall not be held liable for the results of the trades arising from relying upon trading recommendations and reviews contained herein.

Fibonacci Retracements Analysis 30.09.2019 (GOLD, USDCHF)

Article By RoboForex.com

XAUUSD, “Gold vs US Dollar”

As we can see in the H4 chart, after finishing the correctional uptrend at 61.8% fibo, XAUUSD is forming another descending wave. If the price breaks the low at 1483.49, the mid-term descending tendency may continue to reach 50.0%, 61.8%, and 76.0% fibo at 1478.85, 1460.25, and 1438.10 respectively. The key resistance is at 1557.00.

GOLD_H4
Risk Warning: the result of previous trading operations do not guarantee the same results in the future

In the H1 chart, there was a convergence on MACD when the price reached the low, which may indicate a local pullback. After the pair breaks the local low, the short-term target will be the post-correctional extension area between 138.2% and 161.8% fibo at 1463.60 and 1451.50 respectively.

GOLD_H1
Risk Warning: the result of previous trading operations do not guarantee the same results in the future

USDCHF, “US Dollar vs Swiss Franc”

As we can see in the H4 chart, the pair is about to complete the correctional uptrend and may start a new descending wave towards 50.0%, 61.8%б and 76.0% fibo at 0.9821, 0.9783, and 0.9737 respectively. However, if the instrument breaks the high at 0.9983, it may continue growing to reach the post-correctional extension area between 138.2% and 161.8% fibo at 0.9980 and 1.0010 respectively.

USDCHF_H4
Risk Warning: the result of previous trading operations do not guarantee the same results in the future

In the H1 chart, the divergence made the pair complete the ascending wave and start a new decline, which has already reached 50.0% fibo at 0.9897. In the future, the price may continue falling towards 61.8% and 76.0% fibo at 0.9884 and 0.9869 respectively, and the low at 0.9844. The resistance is at 0.9949.

USDCHF_H1

Article By RoboForex.com

Attention!
Forecasts presented in this section only reflect the author’s private opinion and should not be considered as guidance for trading. RoboForex LP bears no responsibility for trading results based on trading recommendations described in these analytical reviews.