Article By RoboForex.com
EURUSD, “Euro vs US Dollar”
EURUSD has finished another descending wave at 1.0945; right now, it is consolidating above this level. Possibly, the pair may start another correction to the upside and reach 1.0967. Later, the market may form a new descending structure to break 1.0940 and then continue trading inside the downtrend with the target at 1.0920.

GBPUSD, “Great Britain Pound vs US Dollar”
GBPUSD has reached the predicted target at 1.2197; right now, it is consolidating above this level. Possibly, the pair may correct towards 1.2260. After that, the instrument may continue trading downwards with the target at 1.2176.

USDCHF, “US Dollar vs Swiss Franc”
After completing the ascending impulse at 0.9950, USDCHF has formed the correction towards 0.9922, thus forming a consolidation range between these two levels. If later the price breaks this range to the upside, the instrument may resume trading upwards with the target at 0.9985 and then start another correction to return to 0.9955.

USDJPY, “US Dollar vs Japanese Yen”
USDJPY is consolidating around 107.12. Possibly, the pair may form a new descending structure 106.76 and then resume trading upwards to break 107.68. Later, the market may continue trading inside the uptrend with the target at 108.50.

AUDUSD, “Australian Dollar vs US Dollar”
AUDUSD is still consolidating around 0.6751. Today, the pair may form one more ascending structure to reach 0.6780 and then resume trading downwards with the target at 0.6720.

USDRUB, “US Dollar vs Russian Ruble”
USDRUB is still consolidating around 65.05. Possibly, today the pair may start another decline to break 64.50 and then continue trading inside the downtrend with the predicted target at 63.63.

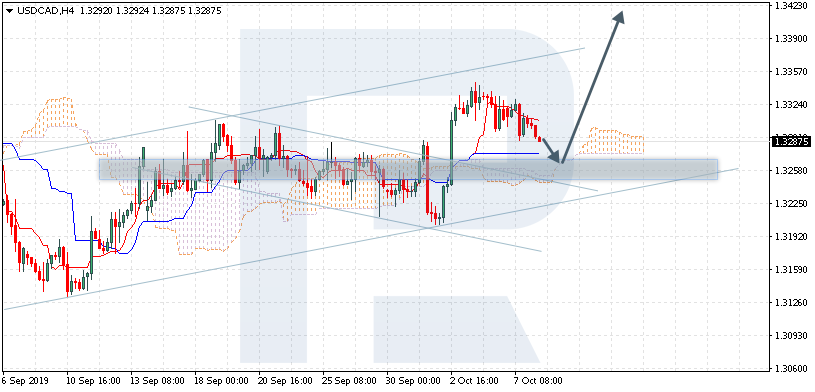
USDCAD, “US Dollar vs Canadian Dollar”
USDCAD is consolidating around 1.3312. Possibly, today the pair may grow towards 1.3333. If later the price breaks this range to the upside, the instrument may resume trading upwards with the target at 1.3355; if to the downside at 1.3307 – start a new correction towards 1.3277 and then resume trading inside the uptrend with the target at 1.3434.

XAUUSD, “Gold vs US Dollar”
Gold is consolidating around 1498.40. Possibly, the pair may form one more ascending structure to reach 1510.00. However, according to the main scenario the price is expected to fall to break 1494.44 and then continue trading downwards with the target at 1478.85.

BRENT
Brent is consolidating above 57.77. If later the price breaks this range to the upside at 58.70, the instrument may start a new growth to reach 60.33; if to the downside at 57.60 – continue the correction towards 56.85 and then resume trading upwards with the target at 63.63.

BTCUSD, “Bitcoin vs US Dollar”
BTCUSD has formed the consolidation range around 8150.00. Possibly, the pair may form a new descending structure to reach 7988.00 and then resume trading upwards with the target at 8540.00.

Article By RoboForex.com
Attention!
Forecasts presented in this section only reflect the author’s private opinion and should not be considered as guidance for trading. RoboForex LP bears no responsibility for trading results based on trading recommendations described in these analytical reviews.