Author Archive for InvestMacro – Page 158

The Analytical Overview of the Main Currency Pairs on 2019.10.11

by JustForex

The EUR/USD currency pair

Technical indicators of the currency pair:
  • Prev Open: 1.09713
  • Open: 1.10053
  • % chg. over the last day: +0.36
  • Day’s range: 1.10043 – 1.10195
  • 52 wk range: 1.0884 – 1.1623

EUR/USD currency pair went up after a long consolidation. The trading tool has updated key extremes. EUR/USD quotes found resistance at around 1.10300. Round level 1.10000 is already a “mirror” support. Demand for risky assets grew amid hopes for an interim trade agreement between Washington and Beijing. We recommend that you keep track of current information on this issue. A trading instrument has the potential for further growth. Positions must be opened from key levels.

The Economic News Feed for 11.10.2019:

  • – Import and Export Price Indices (US) – 15:30 (GMT+3:00);
EUR/USD

Indicators signal the strength of buyers: the price has fixed above 50 MA and 100 MA.

The MACD histogram is in the positive zone, but below the signal line, which gives a weak signal to buy EUR/USD.

The Stochastic Oscillator has reachedthe overbought zone, the %K line crossed the %D line. There are no signals at the moment.

Trading recommendations
  • Support levels: 1.10000, 1.09700, 1.09450
  • Resistance levels: 1.10300, 1.10500

If the price consolidates above the resistance level of 1.10300, expect further growth toward 1.10500-1.10800.

Alternatively, the quotes could decrease toward 1.09800-1.09500.

The GBP/USD currency pair

Technical indicators of the currency pair:
  • Prev Open: 1.22094
  • Open: 1.24315
  • % chg. over the last day: +1.84
  • Day’s range: 1.24239 – 1.24668
  • 52 wk range: 1.1959 – 1.3385

Yesterday, we observed aggressive purchases on the GBP/USD currency pair. The demand for GBP has grown significantly. The quotes grew by more than230 points. The trading tool has updated key highs. On Thursday, Irish Prime Minister Leo Varadkar announced that a Brexit agreement could be concluded by the end of October that would allow the United Kingdom to leave the European Union in an orderly manner. At the moment, GBP/USD quotes are consolidating in the range 1.24100-1.24650. GBP can recover further. You should open positions from the key levels.

The Economic News Feed for 11.10.2019 is calm. Keep an eye out for the Brexit news.

GBP/USD

The price fixed above 50 MA and 100 MA, which signals the strength of buyers.

The MACD histogram is in the positive zone, but below the signal line, which gives a weak signal to buy GBP/USD.

The Stochastic Oscillator is in the neutral zone, the %K line crossed the %D line. There are no signals at the moment.

Trading recommendations
  • Support levels: 1.24100, 1.23500, 1.23200
  • Resistance levels: 1.24650, 1.25000

If the price consolidates above 1.24650, expect further growth toward 1.25000-1.25300.

Alternatively, the quotes could decrease toward 1.23700-1.23500.

The USD/CAD currency pair

Technical indicators of the currency pair:
  • Prev Open: 1.33303
  • Open: 1.32898
  • % chg. over the last day: -0.33
  • Day’s range: 1.32737 – 1.33000
  • 52 wk range: 1.2727 – 1.3664

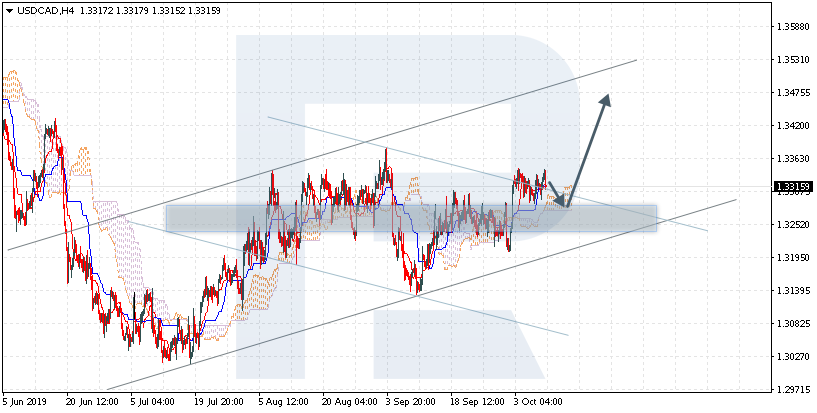
The USD/CAD currency pair is dominated by bearish sentiment. The trading instrument has set new local lows. At the moment, USD/CAD quotes are testing the support level of 1.32700. Round level 1.33000 is already a “mirror” resistance. The Canadian dollar has the potential for further growth against the US dollar. Additional support for Looney is provided by the positive dynamics of oil quotes. Today, investors will evaluate the report on the labor market in Canada. We recommend opening positions from key levels.

The Economic News Feed for 11.10.2019:

  • – Economic Event (CAD) – 00:00 (GMT+3:00);
  • – Economic Event (CAD) – 00:00 (GMT+3:00);
  • – Economic Event (CAD) – 00:00 (GMT+3:00);
USD/CAD

Indicators pooint to the strength of sellers: the price has fixed below 100 MA.

The MACD histogram is in the negative zone and continues to decline, which signals a bearish sentiment.

The Stochastic Oscillator is in the neutral zone, the% K line is below the% D line, which also gives a signal to sell USD/CAD.

Trading recommendations
  • Support levels: 1.32700, 1.32500, 1.32350
  • Resistance levels: 1.33000, 1.33200, 1.33450

If the price consolidates below 1.32700, expect a further drop toward 1.32500-1.32300.

Alternatively, the quotes could grow toward 1.33200-1.33400.

The USD/JPY currency pair

Technical indicators of the currency pair:
  • Prev Open: 107.457
  • Open: 107.962
  • % chg. over the last day: +0.38
  • Day’s range: 107.850 – 108.130
  • 52 wk range: 104.97 – 114.56

On the USD/JPY currency pair, purchases prevail. The trading tool has updated local highs. Demand for the safe haven currencies has weakened amid the prospects for a trade ceasefire between the US and China, as well as the settlement of the Brexit process. At the moment, USD/JPY quotes are consolidating. The local support and resistance levels are: 107.750 and 108.100, respectively. A trading instrument has the potential for further growth. We recommend opening positions from key levels.

The Economic News Feed for 11.10.2019 is calm.

USD/JPY

The price fixed above 50 MA and 100 MA, which signals the strength of buyers.

The MACD histogram is in the positive zone, indicating bullish sentiment.

The Stochastic Oscillator is in the neutral zone, the %K line crossed the %D line. There are no signals at the moment.

Trading recommendations
  • Support levels: 107.750, 107.450, 107.100
  • Resistance levels: 108.100, 108.450

If the price consolidates above 108.100, expect further growth toward 108.400-108.600.

Alternatively, the quotes could decrease toward 107.450-107.200.

by JustForex

USD/JPY at the mercy of the US-Chinese trade dispute

By Admiral Markets

Source: Economic Events October 11, 2019 – Admiral Markets’ Forex Calendar

With the US Trade Talks to finish today, we want to take a look at the USD/JPY.

After tensions in the trade dispute between the US and China heated up again in the first half of this week, after news broke that the White House continues to consider capital control like limiting Chinese stocks in the US Government Fund or similar, the USD/JPY attacked the region around 106.80/107.00, but didn’t break lower, but instead stabilised over the last days.

Nevertheless, when looking at the daily chart, we feel vindicated in an overall bearish outlook for the currency pair, at least as long as the USDJPY trades below 108.50/109.00.

And even if we get to hear any positive signs of at least a partial trade deal with the US and China negotiating topics like intellectual property or Government subsidies in the upcoming months respectively in 2020, a rather sooner than later attempt to break below 106.80/107.00 in the days to come remains a serious option.

A big driver here could be from the comments made by Fed chairman last Tuesday at a speech in Denver, where Powell said that the FED will resume Asset Purchases to prevent a cash crunch and bringing QE4 officially on the table (even though (surprisingly) emphasizing that it is not a QE).

With that in mind, we consider another attempt to break back below 106.80/107.00 with a significant higher probability than USDJPY trying to break back above 108.50/109.00.

This is still and especially true if any signs of risk aversion start to materialise where a next wave of selling could result in USDJPY being pushed below 105.80 and trigger further selling, quickly activating the region around 105.00 again:

Source: Admiral Markets MT5 with MT5-SE Add-on USD/JPY Daily chart (between August 24, 2018, to October 10, 2019). Accessed: October 10, 2019, at 10:00pm GMTPlease note: Past performance is not a reliable indicator of future results, or future performance.

In 2014, the value of the USD/JPY increased by 13.7%, in 2015, it increased by 0.5%, in 2016, it fell by 2.8%, in 2017, it fell by 3.6%, in 2018, it fell by 2.7%, meaning that after five years, it was up by 4.1%.

Discover the world’s #1 multi-asset platform

Admiral Markets offers professional traders the ability to trade with a custom, upgraded version of MetaTrader 5, allowing you to experience trading at a significantly higher, more rewarding level. Experience benefits such as the addition of the Market Heat Map, so you can compare various currency pairs to see which ones might be lucrative investments, access real-time trading data, and so much more. Click the banner below to start your FREE download of MT5 Supreme Edition!

Download MetaTrader 5 and begin trading today!

Disclaimer: The given data provides additional information regarding all analysis, estimates, prognosis, forecasts or other similar assessments or information (hereinafter “Analysis”) published on the website of Admiral Markets. Before making any investment decisions please pay close attention to the following:

  1. This is a marketing communication. The analysis is published for informative purposes only and are in no way to be construed as investment advice or recommendation. It has not been prepared in accordance with legal requirements designed to promote the independence of investment research, and that it is not subject to any prohibition on dealing ahead of the dissemination of investment research.
  2. Any investment decision is made by each client alone whereas Admiral Markets shall not be responsible for any loss or damage arising from any such decision, whether or not based on the Analysis.
  3. Each of the Analysis is prepared by an independent analyst (Jens Klatt, Professional Trader and Analyst, hereinafter “Author”) based on the Author’s personal estimations.
  4. To ensure that the interests of the clients would be protected and objectivity of the Analysis would not be damaged Admiral Markets has established relevant internal procedures for prevention and management of conflicts of interest.
  5. Whilst every reasonable effort is taken to ensure that all sources of the Analysis are reliable and that all information is presented, as much as possible, in an understandable, timely, precise and complete manner, Admiral Markets does not guarantee the accuracy or completeness of any information contained within the Analysis. The presented figures refer that refer to any past performance is not a reliable indicator of future results.
  6. The contents of the Analysis should not be construed as an express or implied promise, guarantee or implication by Admiral Markets that the client shall profit from the strategies therein or that losses in connection therewith may or shall be limited.
  7. Any kind of previous or modeled performance of financial instruments indicated within the Publication should not be construed as an express or implied promise, guarantee or implication by Admiral Markets for any future performance. The value of the financial instrument may both increase and decrease and the preservation of the asset value is not guaranteed.
  8. The projections included in the Analysis may be subject to additional fees, taxes or other charges, depending on the subject of the Publication. The price list applicable to the services provided by Admiral Markets is publicly available from the website of Admiral Markets.
  9. Leveraged products (including contracts for difference) are speculative in nature and may result in losses or profit. Before you start trading, you should make sure that you understand all the risks.

By Admiral Markets

EURUSD: increased risk of returning to 1.0990

By Alpari.com

On Thursday the 10th of October, trading on the EURUSD pair closed up. The rate rose to 1.1034 during the European session. Demand from the dollar fell amid optimism among investors that a deal would be reached between the US and China. Markets are expecting an interim deal to be struck.

China’s Vice Premier Lui He said on Thursday that China is ready to make a deal with the US on matters that both sides care about in order to prevent the situation from escalating any further.

In the US session, the EURUSD pair came under pressure on account of the collapse on the EURGBP cross. The pair corrected from 1.1034 to 1.1002. Meanwhile, the pound surged by 250 pips, marking a 2% rise following renewed hope on the issue of Brexit. Irish Taoiseach Varadkar said that a Brexit deal is possible by the end of October that would see the UK undergo an orderly exit from the EU.

Day’s news (GMT+3):

  • 15:30 Canada: unemployment rate (Sep), net change in employment (Sep).
  • 15:30 US: import price index (Sep).
  • 17:00 US: Michigan consumer sentiment index (Oct).
  • 20:00 US: Baker Hughes US oil rig count.

EURUSD H1Current situation:

Today marks the end of the talks between the US and China. Macroeconomic data is therefore of secondary importance. Everyone except for traders using technical analysis is invested in the results of these talks. Nobody knows how they will end, but today we expect the bulls to cash in on their long positions. Buy on expectations, sell on the facts.

We expect the pair to visit 1.1028 followed by a decline to 1.0988. We’ve highlighted an imbalance zone between 1.0990 and 1.1005 according to yesterday’s volume profile. 1.1005 is the VAL (Value Area Low). It’s likely that if this level doesn’t hold up, the pair will quickly slip to 1.0990.

By Alpari.com

Metals & VIX Are Set To Launch Dramatically Higher

By TheTechnicalTraders.com

The recent rotation in the US stock market and US major indexes have set up a very interesting pattern in the Metals and VIX charts.  Our researchers believe precious metals, Gold and Silver, are setting up a new momentum base/bottom and are beginning an early stage bullish price rally that may surprise many traders.  If you have not been following our research, please take a minute to read these past research posts :

September 24, 2019: IS SILVER ABOUT TO BECOME THE SUPER-HERO OF PRECIOUS METALS?

September 19, 2019: PRECIOUS METALS SETTING UP ANOTHER MOMENTUM BASE/BOTTOM

Our researchers believe the bottom in Metals has already set up on October 1, 2019.  This setup aligns with our earlier analysis that a new bullish price leg is setting up that will propel Gold to levels above $1600 before the end of November – possibly resulting in a rally that attempts to breach the $1700 price level.

Daily Gold Chart

Of course, for Gold to rally in this manner, some type of extended fear must enter the global markets.  We believe this fear could become known to traders within 3 to 10+ days based on our understanding of the schedules and calendars available within the news cycle.  The US/China trade talks appear to be breaking down again.  News that one of India’s largest banks is in the process of collapsing hit last weekend. And news that the US political parties are about to ramp up nearly all levels of activity ahead of the 2020 US Presidential election cycle is sure to throw the markets a few curve-balls.

As skilled technical traders, there are times when we must understand how the news cycles and external events can have dramatic impact on prices and trends in the financial markets.  These are times when we must protect our assets by deploying very skilled trades, proper position sizing and become even more skilled at understanding the global stock market dynamics.

Daily Silver Chart

Silver, or as we have termed it “The Super-HERO of Metals”, will likely move much higher, even faster than Gold.  If our research is correct, the next upside price leg in Metals will see Silver rally to levels well above $20, then stall briefly, then begin a move to levels above $26 (or higher).  The Gold to Silver ratio will likely fall to levels near 65 throughout this move.  That would mean that Silver would appreciate about 11% to 15% faster than Gold will appreciate over the next 60 to 90+ days.

VIX – Daily Volatility Index Chart

And finally, the VIX.  At this point, our research team believes a broader downside price rotation has already begun to set up in the US stock market (with Technology and “unicorn” sectors at severe risk) which may prompt a move in prices to retest the December 2018 lows.  This is why we believe the VIX is very likely to begin an upside price move over the next 30 to 60+ days and attempt to break above the 26 to 27 level as the US stock market reacts to increased fear and uncertainty.  This is, obviously, also why we believe Gold and Silver will begin to move dramatically higher very quickly.

September 17, 2019: VIX TO BEGIN A NEW UPTREND AND WHAT IT MEANS

Concluding Thoughts:

Our researchers are attempting to follow all the news and price activity we can handle over the past 4+ weeks or longer.  At this point, it seems all the global markets are unstable in terms of price trends, extended volatility, and uncertainty.  We believe our expectations within the metals markets, us stock market and the VIX predictions are relatively saved expectations given the research we’ve completed.

It would be wise for skilled traders to prepare for a moderate to deep price correction at this point.  Price has failed to move higher above historic all-time high price levels and has begun to move lower.  Unless some extremely positive news, event or outcome is reached within the next 90+ days, it is very likely that price will continue to rotate within established ranges attempting to identify true support levels.  This ride could become very volatile – very quickly.

As a technical analysis and trader since 1997, I have been through a few bull/bear market cycles. I believe I have a good pulse on the market and timing key turning points for both short-term swing trading and long-term investment capital. The opportunities are massive/life-changing if handled properly.

Be sure to ride my coattails as I navigate these financial markets and build wealth while others lose nearly everything they own during the next financial crisis.

I can tell you that huge moves are about to start unfolding not only in metals, or stocks but globally and some of these supercycles are going to last years. My simple technical trading strategy using ETFs will allow you to follow the markets closely and trade with it so you never get caught on the wrong side of the market with big losses.

Chris Vermeulen
TheTechnicalTraders.com

NOTICE: Our free research does not constitute a trade recommendation or solicitation for our readers to take any action regarding this research.  It is provided for educational purposes only.  Our research team produces these research articles to share information with our followers/readers in an effort to try to keep you well informed.  Visit our web site to learn how to take advantage of our members-only research and trading signals.


Stock markets and pound relief over last-ditch bid for Brexit deal

By George Prior

Global stock markets and the British pound are set to experience a short-term boost following last-ditch talks in the Brexit negotiations on Thursday between the UK Prime Minister and his Irish counterpart.

This is the optimistic forecast from the CEO of deVere Group, the world’s largest independent financial advisory organisation.

Nigel Green’s comments follow a meeting between Boris Johnson and Leo Varadkar in which they agreed that there was a “pathway to a possible deal” as they discussed the issues of customs and consent.

The UK government believed that they had gone some way to meet EU demands in their new proposals, by offering to keep Northern Ireland in the single market. They were disappointed that there appeared to be no reciprocity coming from the EU side.

Any sign of Dublin meeting that offer with a similar concession could be the start of serious negotiations towards a deal with the EU.

The deVere CEO says: “Global stock markets would almost inevitably experience a significant shock to the downside in the event of a no-deal Brexit.

“The UK would experience the worst fallout, but U.S., European and Asian equity markets would also take a considerable hit.

“In addition, while some of the impact of a no-deal Brexit has been priced-in, the value of the British pound – which is already down 17% than before the 2016 referendum – would also likely be weighed down further.”

He continues: “This is why, following the positive tone coming from Johnson and Varadkar on the main point of contention in an orderly exit from the EU – the Irish backstop –we can expect global stock markets and the British pound to experience a short-term boost.”

Mr Green goes on to add: “There is a growing sense that there’s a light in what has been a very dark tunnel. It is now imperative that the leaders of the EU and the UK use this glimmer of hope and move forward to end the paralysis.

“They must use this new momentum and act decisively and in the spirit of compromise to get a deal secured by which the UK can leave the EU in an orderly way.”

He affirms: “A deal, which leads to a well-managed departure, is likely to have a rebound effect on global equity markets could rebound, whilst the pound and euro would strengthen against the dollar.

The deVere CEO concludes: “No-deal Brexit is one of the major geopolitical headwinds affecting financial markets, but the encouraging talks between Boris Johnson and Leo Varadkar will provide some relief.”

“The situation remains highly volatile and investors should remain invested and ensure their portfolios are properly diversified to take advantage of the opportunities and upsides and mitigate risks.”

Following the discussions, Mr Varadkar will consult with the Taskforce 50, and the UK Brexit Secretary Stephen Barclay will meet Michel Barnier, the EU’s chief negotiator, on Friday morning.

About:

deVere Group is one of the world’s largest independent advisors of specialist global financial solutions to international, local mass affluent, and high-net-worth clients.  It has a network of more than 70 offices across the world, over 80,000 clients and $12bn under advisement

Ichimoku Cloud Analysis 10.10.2019 (AUDUSD, NZDUSD, USDCAD)

Article By RoboForex.com

AUDUSD, “Australian Dollar vs US Dollar”

AUDUSD is trading at 0.6745; the instrument is moving above Ichimoku Cloud, thus indicating an ascending tendency. The markets could indicate that the price may test the cloud’s downside border at 0.6735 and then resume moving upwards to reach 0.6815. Another signal to confirm further ascending movement is the price’s rebounding from the support level. However, the scenario that implies further growth may be canceled if the price breaks the cloud’s downside border and fixes below 0.6700. In this case, the pair may continue falling towards 0.6605.

AUDUSD
Risk Warning: the result of previous trading operations do not guarantee the same results in the future

NZDUSD, “New Zealand Dollar vs US Dollar”

NZDUSD is trading at 0.6313; the instrument is moving above Ichimoku Cloud, thus indicating an ascending tendency. The markets could indicate that the price may test the cloud’s upside border at 0.6285 and then resume moving upwards to reach 0.6410. Another signal to confirm further ascending movement is the price’s rebounding from the support level and forming Head & Shoulders reversal pattern. However, the scenario that implies further growth may be canceled if the price breaks the cloud’s downside border and fixes below 0.6255. In this case, the pair may continue falling towards 0.6175. After breaking the neckline and fixing above 0.6345, the price may continue moving upwards.

NZDUSD
Risk Warning: the result of previous trading operations do not guarantee the same results in the future

USDCAD, “US Dollar vs Canadian Dollar”

USDCAD is trading at 1.3315; the instrument is moving above Ichimoku Cloud, thus indicating an ascending tendency. The markets could indicate that the price may test the cloud’s downside border at 1.3295 and then resume moving upwards to reach 1.3475. Another signal to confirm further ascending movement is the price’s rebounding from the support level. However, the scenario that implies further growth may be canceled if the price breaks the cloud’s downside border and fixes below 1.3235. In this case, the pair may continue falling towards 1.3165.

USDCAD

Article By RoboForex.com

Attention!
Forecasts presented in this section only reflect the author’s private opinion and should not be considered as guidance for trading. RoboForex LP bears no responsibility for trading results based on trading recommendations described in these analytical reviews.

Japanese Candlesticks Analysis 10.10.2019 (GOLD, NZDUSD)

Article By RoboForex.com

XAUUSD, “Gold vs US Dollar”

As we can see in the H4 chart, the ascending tendency continues. After forming Shooting Star reversal pattern close to the resistance level, XAUUSD is moving sideways and testing the rising channel’s downside border. If the pair continues growing, it may return to 1531.00 to continue forming the ascending tendency. At the same time, we shouldn’t exclude an opposite scenario, which implies that the instrument may resume falling to reach 1485.00.

GOLD
Risk Warning: the result of previous trading operations do not guarantee the same results in the future

NZDUSD, “New Zealand vs. US Dollar”

As we can see in the H4 chart, the descending tendency continues. After breaking the resistance level, NZDUSD has formed several reversal patterns, including Hanging Man. Right now, the pair is reversing and may start a slight correction, which may later be followed by a further decline towards 0.6210. At the same time, one shouldn’t exclude an opposite scenario, according to which the instrument may continue growing towards 0.6380.

NZDUSD

Article By RoboForex.com

Attention!
Forecasts presented in this section only reflect the author’s private opinion and should not be considered as guidance for trading. RoboForex LP bears no responsibility for trading results based on trading recommendations described in these analytical reviews.

Trade Conflict Between the US and China Is in the Spotlight. Investors Assess the FOMC Meeting Minutes

by JustForex

The US dollar is consolidating against a basket of major currencies. The dollar index (#DX) closed yesterday’s trading session with a slight decrease (-0.01%). Investors are still focused on negotiations between the US and China. It became known that countries can conclude an interim agreement. Also, the Executive Office of the US President, Donald Trump, plans to issue licenses that allow some US companies to cooperate with Huawei Technologies. It optimistically affected the sentiment of financial market participants. This step is regarded as the willingness of the United States to make concessions.

Financial market participants assess the FOMC meeting minutes. The Fed noted an increase in the recession probability amid uncertainty in trade policy and growing external risks. Fed Chairman, Jerome Powell, does not rule out another cut in interest rates this year. Weak economic data from the US was also published yesterday. So, JOLTS job openings decreased and counted to 7,051M instead of 7,191M. Today, we expect statistics on inflation in the US.

The “black gold” prices are falling due to pessimism about the global economy. Currently, WTI crude oil futures are testing the $52.55 mark per barrel.

Market Indicators

Yesterday, there was the bearish sentiment in the US stock markets: #SPY (-0.95%), #DIA (-0.71%), #QQQ (-0.98%).

The 10-year US government bonds yield has been growing. At the moment, the indicator is at the level of 1.58-1.59%.

The Economic News Feed for 10.10.2019:
  • – GDP data in the UK at 11:30 (GMT+3:00);
  • – The volume of industrial production in the UK at 11:30 (GMT+3:00);
  • – US inflation report at 15:30 (GMT+3:00).

by JustForex

The Analytical Overview of the Main Currency Pairs on 2019.10.10

by JustForex

The EUR/USD currency pair

Technical indicators of the currency pair:
  • Prev Open: 1.09563
  • Open: 1.09713
  • % chg. over the last day: +0.26
  • Day’s range: 1.09704 – 1.09932
  • 52 wk range: 1.0884 – 1.1623

The EUR/USD currency pair continues to trade in a protracted flat. Unidirectional trends are not observed. Financial market participants evaluate FOMC Minutes. The Fed noted an increase in the likelihood of a recession amid uncertainty in trade policy and growing external risks. Fed Chairman Jerome Powell does not rule out another cut in interest rates this year. At the moment, the local support and resistance levels are: 1.09700 and 1.10000, respectively. A trading instrument has a potential for growth. Today, investors will evaluate data on inflation in the United States. We recommend opening positions from key levels.

The Economic News Feed for 10.10.2019:

  • – Inflation report (US) – 15:30 (GMT + 3: 00);
  • – Initial Jobless Claims (US) – 15:00 (GMT+3:00);
EUR/USD

Indicators do not give accurate signals: 50 MA crossed 100 MA.

The MACD histogram is located in the positive zone and above the signal line, which gives a strong signal to buy EUR/USD.

The Stochastic Oscillator is in the neutral zone, the% K line crossed the% D line. There are no signals at the moment.

Trading recommendations
  • Support levels: 1.09700, 1.09450, 1.09100
  • Resistance levels: 1.10000, 1.10250

If the price consolidates above the round level of 1.10000, expect further growth toward 1.10300-1.10500.

Alternatively, EUR/USD could decrease toward 1.09500-1.09300.

The GBP/USD currency pair

Technical indicators of the currency pair:
  • Prev Open: 1.22183
  • Open: 1.22094
  • % chg. over the last day: -0.06
  • Day’s range: 1.22025 – 1.22310
  • 52 wk range: 1.1995 – 1.3385

The last session had rather active trading on the GBP/USD currency pair. At the same time, a unidirectional trend is not observed. The trading tool tests local support and resistance levels: 1.22000 and 1.22400, respectively. Sterling is still under pressure due to uncertainty over the Brexit issue. Today, participants in financial markets will evaluate important economic releases from the UK. Positions must be opened from key levels.

The Economic News Feed for 10.10.2019:

  • – GDP Report (UK) – 11:30 (GMT+3:00);
  • – Production volume in manufacturing industry (UK) – 11:30 (GMT+3:00);

Keep an eye on the statements by the Head of the Bank of England

GBP/USD

Indicators do not give accurate signals, the price crossed 50 MA.

The MACD histogram is close to 0.

The Stochastic Oscillator is close to the overbought zone, the %K line crossed the %D line.

Trading recommendations
  • Support levels: 1.22000, 1.21500
  • Resistance levels: 1.22400, 1.22850, 1.23300

If the price consolidates below 1.22000, expect a further drop toward 1.21600-1.21400.

Alternatively, the quotes could grow toward 1.22700-1.22900.

The USD/CAD currency pair

Technical indicators of the currency pair:
  • Prev Open: 1.33216
  • Open: 1.33303
  • % chg. over the last day: +0.06
  • Day’s range: 1.33117 – 1.33456
  • 52 wk range: 1.2727 – 1.3664

CAD is still in lateral movement. The technical picture is ambiguous. At the moment, the local support and resistance levels are 1.33100 and 1.33450, respectively. Participants in financial markets expect the release of important statistics on the US economy. We also recommend that you pay attention to the dynamics of prices for oil. USD/CAD quotes have the potential to decline. Positions must be opened from key levels.

The Economic News Feed for 10.10.2019 is calm.

USD/CAD

Indicators do not give accurate signals, the price crossed 50 MA and 100 MA.

The MACD histogram is close to 0.

The Stochastic Oscillator is in the oversold zone, the %K line has crossed the %D line. There are no signals at the moment.

Trading recommendations
  • Support levels: 1.33100, 1.32900, 1.32700
  • Resistance levels: 1.33450, 1.33700

If the price consolidates below 1.33100, expect the quotes to fall toward 1.32800-1.32600.

Alternatively, the quotes could grow toward 1.33700-1.33900.

The USD/JPY currency pair

Technical indicators of the currency pair:
  • Prev Open: 107.070
  • Open: 107.457
  • % chg. over the last day: +0.14
  • Day’s range: 107.035 – 107.772
  • 52 wk range: 104.97 – 114.56

The technical picture on the USD/JPY currency pair is still ambiguous. The trading instrument is in lateral movement. At the moment, the local support and resistance levels are: 107.250 and 107.700, respectively. Uncertainty in trade negotiations between the US and China, as well as the Brexit process, support demand for the safe haven currencies. USD/JPY quotes have the potential to decline. Today we recommend paying attention to economic reports from the USA. Positions must be opened from key levels.

The Economic News Feed for 10.10.2019 is calm.

USD/JPY

The price fixed above 50 MA and 100 MA, which signals the strength of buyers.

The MACD histogram is in the positive zone, indicating bullish sentiment.

The Stochastic Oscillator is in the neutral zone, the %K line is below the %D line, which gives a signal to sell USD/JPY.

Trading recommendations
  • Support levels: 107.250, 106.900, 106.600
  • Resistance levels: 107.700, 107.900, 108.300

If the price consolidates below 107.250, expect the quotes to fall toward 106.900-106.600.

Alternatively, the quotes can grow toward 108.000-108.200.

by JustForex

Whatever Happened to Philippines Debt Slavery?

By Dan Steinbock

In early 2017, a Forbes contributor claimed President Duterte will bankrupt the Philippines economy in five years. Half of the period is gone. Will the country default in 2022?

In May 2017, Forbes released a column, which claimed that “New Philippine Debt of $167 Billion Could Balloon To $452 Billion: China Will Benefit.” It was written by Anders Corr, who was portrayed as an independent geopolitical risk analyst. He predicted that the Philippines would be in debt slavery at the end of the Duterte era.

Now that half of that prediction period has passed, let’s see whether Corr was right.

The projections

According to Corr, the Philippine government debt of $123 billion would soar to $290 billion because China would impose high interest rates on the debt: “Over 10 years, that could balloon Philippines’ debt-to-GDP ratio as high as 296%, the highest in the world.”

Based on flawed data and mistaken assumptions, the prediction sounded idiotic. Yet, Forbess brand reputation and Corr’s background felt credible to international media. Most of his clients are linked with Pentagon, its allies and defense contractors. He has been an associate for Booz Allen Hamilton in Hawaii (as was Edward Snowden when he worked for CIA) and served half a decade in US military intelligence. He has conducted “research” for US Army in Afghanistan, at US Pacific Command and US Special Operations Command Pacific. And he seems to specialize in efforts to destabilize critical areas in Asia.

In his projection, Corr assumed absence of transparency on the interest rate, heavy conditionality and repayment terms of $167 billion of new debt for the Philippines. Due to accrued interest (which he grossly over-estimated), “Dutertenomics, fueled by expensive loans from China, will put the Philippines into virtual debt bondage if allowed to proceed.” (In reality, the government’s borrowing sought to rely mainly on domestic sources, to alleviate foreign exchange risks).

Corr offered no evidence to substantiate the assertions. Yet, the commentary was quickly recycled across the Western media. The tacit assumption seems to have been that since Forbes represents world-class quality, so do its contributors (even those that have been subsequently fired, such as Corr).

So what’s the truth about the alleged “debt bondage”?

The realities

Let’s compare Corr’s forecasts with projections. Between 2017 and 2022, most Philippine authorities estimated the debt would mildly decline. My estimate was slightly more conservative because I expected trade wars to begin to bite by 2018-20. In contrast, the implication of Corr’s claim was that Philippine debt-to-GDP ratio would soar to some 150% in year-end 2019 and to 296% by 2022 (Figure).

Figure Philippines Government Debt, 2016-22E (% of GDP)

In retrospect, Philippine authorities may have been 0.5-1% too optimistic, while I may have been too pessimistic by 0.5-1%. What is certain, however, is that Corr has already proven wrong by almost 110 percentage points (!).

Corr’s 2017 “predictions” have nothing to do with economic realities. It is also quite likely that, in another three years when Duterte will leave his job, both Philippine authorities and I will prove right by an error range of 1% to 2%, whereas Corr will prove wrong by some 250 percentage points (!).

When investment analysts commit such failures in markets, they are fired, banned or imprisoned. That’s not the case with Corr. Despite disastrous projections, he has been used as an “expert” by major international media, such as Bloomberg, Fox, CNBC, New York Times, Nikkei Review, Al Jazeera, and UPI.

More recently, Corr predicted worldwide “financial carnage” if China intervenes in Hong Kong (Institutional Investor, Sep 23, 2019); claimed that millions of Uighurs linger in “Chinese concentration camps” (Washington Free Beacon, Jul 15, 2019); blasted the “Trump-Xi’s G20 trade truce” (Observer, Jul 1, 2019); and predicted that the division of the Philippine island Palawan into three provinces was a part of “China’s territorial expansion move” (Rappler Apr 13, 2019).

In the Philippines, even the Defense Forces Forum shared Corr’s “news” (Facebook, April 29, 2018) that the country had been invaded by 45,000 Chinese covert military operatives (he mistook online gaming operations, which China wants Philippines to eliminate, with covert military cells).

Economic hit men

Corr’s political links are most intimate with neoconservative and intervention-minded US senators, such as Marco Rubio, and vulture capitalists, including Paul Singer (who funds the above-mentioned Washington Free Beacon) that have recently supported destabilization in Hong Kong, Philippines and elsewhere in Asia.

He also cooperates with the radical conservative Japan Forward, which once recommended apartheid-policies to manage immigrants in Japan, the French Catholic daily La Croix International and the Union of Catholic Asian (UCA) News, which has since 1979 operated in the same Asian countries as Voice of America and the National Endowment for Democracy (NED). These catholic outlets work closely with the anti-Duterte leaders of Philippines Catholic church and the Liberal Party which suffered a meltdown in the 2016 election.

Since Corr’s predictions have no predictive power, the definition of an “economic hitman” may be more applicable in his case.

The real question is, why are such economic hitmen still used as “independent analysts” by some of the world’s most powerful international media?

About the Author:

Dan Steinbock is the founder of Difference Group and internationally recognized expert of the multipolar world economy. He has served at the India, China and America Institute (US), Shanghai Institute for International Studies (China) and the EU Center (Singapore). For more, see http://www.differencegroup.net/    

The commentary was originally released by The Manila Times on October 7, 2019.