Author Archive for InvestMacro – Page 157

Deal! Bullish fireworks in the DAX30 CFD, new yearly highs soon?

By Admiral Markets

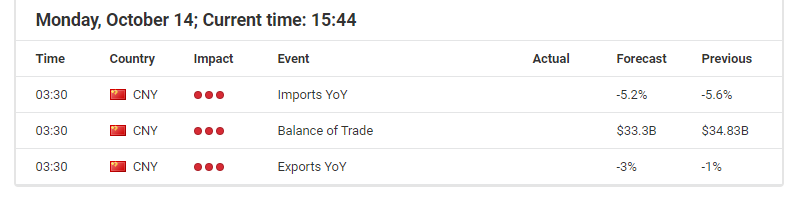
Source: Economic Events October 14, 2019 – Admiral Markets’ Forex Calendar

Friday’s developments in the US-Chinese trade talks resulted in the presentation of a partial trade deal between the US and China. This caused some heavy price action fireworks by happy DAX30 CFD bulls into the weekly close.

The German index recaptured 12,150 points and found, in addition to the lessening of US-Chinese tensions, another bullish driver with a Brexit deal finally on the horizon between the EU and UK, too.

As a result, the DAX30 CFD gained more than 2%, and went for a test of the region around 12,500 points.

The start of this week has a key level to watch: a break higher activates the region around the current yearly highs around 12,650 points.

Still, we remain a little cautious and try to not become overly optimistic in regards to a direct walk through on the upside since the mode looks very extended and a consolidation, even though at an elevated level slightly below 12,500 points, seems likely.

After the extended mode is reduced then over time, a test of 12,650 points in the days to come has a high probability.

A sharper pullback (even though unlikely) would find a first target and solid support around the Friday-breakout level around 12,150 points:

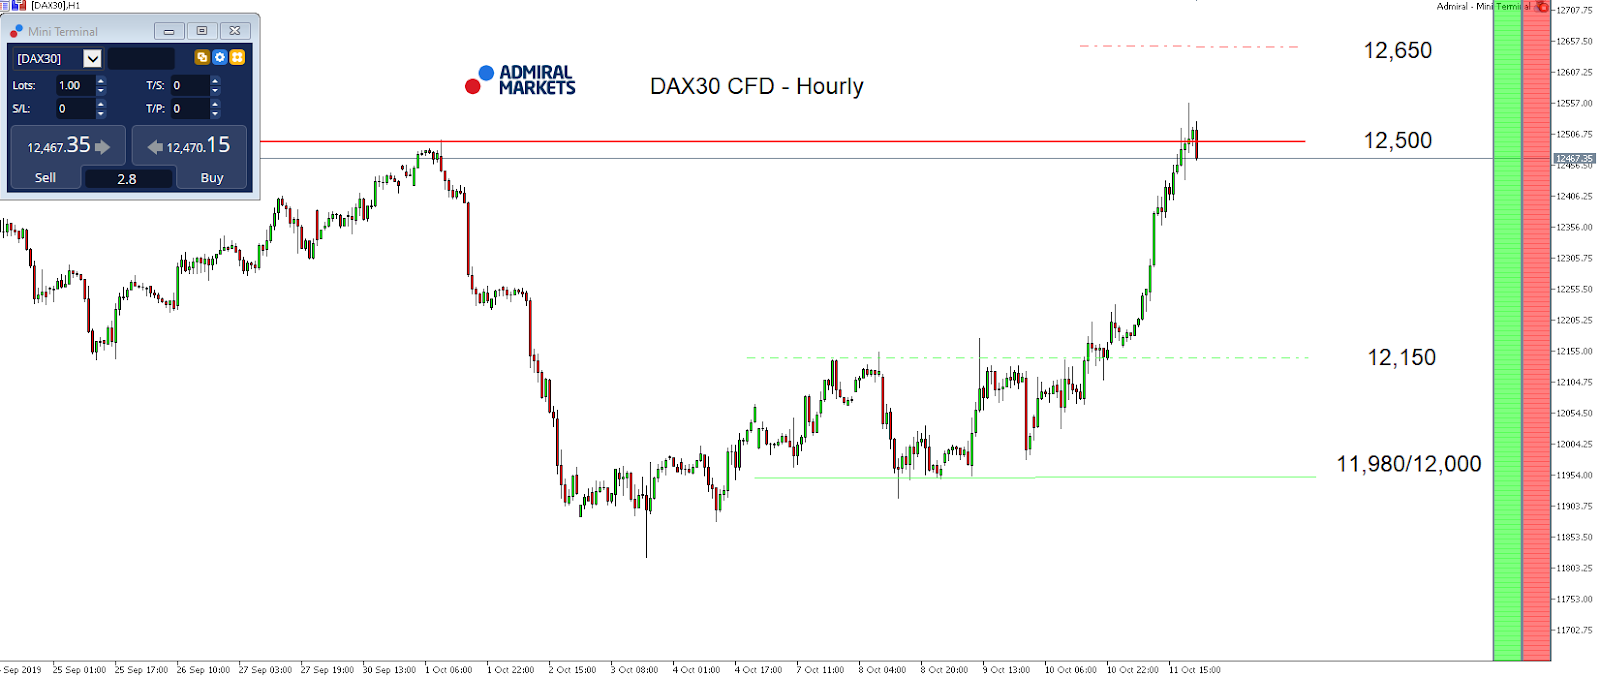
Source: Admiral Markets MT5 with MT5-SE Add-on DAX30 CFD Hourly chart (between September 24, 2019, to October 11, 2019). Accessed: October 11, 2019, at 10:00pm GMT

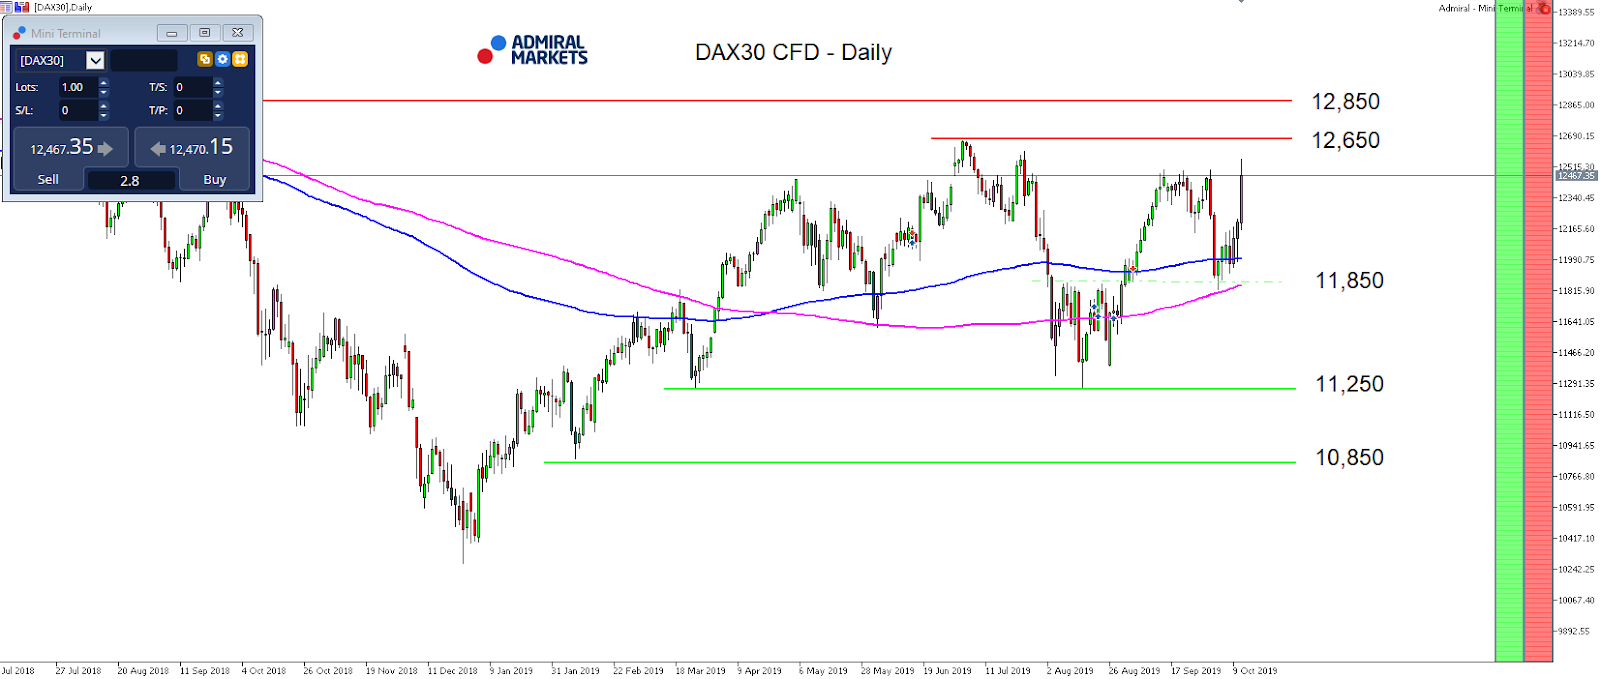
Source: Admiral Markets MT5 with MT5-SE Add-on DAX30 CFD Daily chart (between July 5, 2018, to October 11, 2019). Accessed: October 11, 2019, at 10:00pm GMT – Please note: Past performance is not a reliable indicator of future results, or future performance.

In 2014, the value of the DAX30 CFD increased by 2.65%, in 2015, it increased by 9.56%, in 2016 it increased by 6.87%, in 2017 it increased by 12.51%, in 2018 it fell by 18.26%, meaning that after five years, it was up by 10.5%.

Discover the world’s #1 multi-asset platform

Admiral Markets offers professional traders the ability to trade with a custom, upgraded version of MetaTrader 5, allowing you to experience trading at a significantly higher, more rewarding level. Experience benefits such as the addition of the Market Heat Map, so you can compare various currency pairs to see which ones might be lucrative investments, access real-time trading data, and so much more. Click the banner below to start your FREE download of MT5 Supreme Edition!

Download MetaTrader 5 and begin trading today!

Disclaimer: The given data provides additional information regarding all analysis, estimates, prognosis, forecasts or other similar assessments or information (hereinafter “Analysis”) published on the website of Admiral Markets. Before making any investment decisions please pay close attention to the following:

  1. This is a marketing communication. The analysis is published for informative purposes only and are in no way to be construed as investment advice or recommendation. It has not been prepared in accordance with legal requirements designed to promote the independence of investment research, and that it is not subject to any prohibition on dealing ahead of the dissemination of investment research.
  2. Any investment decision is made by each client alone whereas Admiral Markets shall not be responsible for any loss or damage arising from any such decision, whether or not based on the Analysis.
  3. Each of the Analysis is prepared by an independent analyst (Jens Klatt, Professional Trader and Analyst, hereinafter “Author”) based on the Author’s personal estimations.
  4. To ensure that the interests of the clients would be protected and objectivity of the Analysis would not be damaged Admiral Markets has established relevant internal procedures for prevention and management of conflicts of interest.
  5. Whilst every reasonable effort is taken to ensure that all sources of the Analysis are reliable and that all information is presented, as much as possible, in an understandable, timely, precise and complete manner, Admiral Markets does not guarantee the accuracy or completeness of any information contained within the Analysis. The presented figures refer that refer to any past performance is not a reliable indicator of future results.
  6. The contents of the Analysis should not be construed as an express or implied promise, guarantee or implication by Admiral Markets that the client shall profit from the strategies therein or that losses in connection therewith may or shall be limited.
  7. Any kind of previous or modeled performance of financial instruments indicated within the Publication should not be construed as an express or implied promise, guarantee or implication by Admiral Markets for any future performance. The value of the financial instrument may both increase and decrease and the preservation of the asset value is not guaranteed.
  8. The projections included in the Analysis may be subject to additional fees, taxes or other charges, depending on the subject of the Publication. The price list applicable to the services provided by Admiral Markets is publicly available from the website of Admiral Markets.
  9. Leveraged products (including contracts for difference) are speculative in nature and may result in losses or profit. Before you start trading, you should make sure that you understand all the risks.

By Admiral Markets

EURUSD: pair trading at the balance point

By Alpari.com

All the majors rose against the US dollar last week, except for the safe havens. The biggest mover was the pound (+2.54%), followed by the Canadian dollar (+0.87%), the euro (+054%), the Aussie dollar (+0.35%), and finally the Kiwi dollar (+0.33%). The yen dropped by 1.42% and the Swiss franc by 0.14%.

The US and China have concluded negotiations. US President Trump announced that a partial deal has been reached, which will be signed in the coming weeks. The agreement covers issues such as the purchase of agricultural produce, exchange rates, and intellectual property rights. The planned hike on import tariffs has been cancelled.

Markets had already factored in a positive end to the talks, so growth on the EURUSD pair was limited to 1.1063.

Day’s news (GMT+3):

  • 11:00 Eurozone: industrial production (Aug).
  • 21:00 US: monthly budget statement (Sep).

EURUSD H1Current situation:

Trading on the euro has opened down in Europe. Since the negotiations between the US and China are over, there are no more factors for growth. The last three trading days have all had similar trajectories. It’s unlikely that this pattern will be repeated again today. We’re forecasting a recovery to 1.1050, where we expect traders to cash in on their long positions. It would be nice to then see the pair drop from the upper to the lower boundary of the channel. If the pair manages to stay above 1.10 over the next couple of days, then we can entertain the possibility of a breakout towards 1.11.

By Alpari.com

Oil Floats Above 60 USD

By Dmitriy Gurkovskiy, Chief Analyst at RoboForex

Oil prices are still attracting a lot of attention due to their increased volatility.

According to heads of several major global oil and gas companies, the oil will cost about 50 USD per barrel in October 2020. This opinion was voiced at the Oil & Money conference that took place last week. The key risks for the oil are US-China trade wars, an increase in oil extraction and production in the USA, and a slowdown in the global economic growth rate. In other words, the same as right now, meaning that these risks can be considered long-term. This, in its turn, means that they are significantly underestimated and can pull oil prices down at any moment.

The report from Baker Hughes published last Friday showed that the number of rigs in the USA rose for the first time in eight weeks. The total number added 1 unit and is now equal to 856. This being said, the number of oil rigs added 2 units, while gas rigs lost 1.

On Monday morning, October 14th, Brent is trading at 60.22 USD and this price still includes the events that happened the week before – oil prices jumped after reports of Iranian tanker explosion not far from the Red Sea coast of Saudi Arabia.

In the H4 chart, we can see some signs of “Head & Shoulders” reversal pattern. After breaking the top of the first wave at 60.05, Brent is consolidating around 60.35. This structure may be considered as an upside continuation pattern; the entire ascending structure may be considered as the third wave to the upside. After reaching the target, the instrument may start a new correction towards 60.40 and then resume trading inside the uptrend with the first target at 64.10. From the technical point of view, this scenario is confirmed by MACD Oscillator: its signal line is moving above 0. As long as the Oscillator is staying above 0, the uptrend will dominate.

As we can see in the H1 chart, Brent is moving inside a narrow consolidation range around 60.35. Possibly, today the pair may expand the range towards 61.25 and then return to 60.35. After that, the instrument may grow to break 61.25 and then continue trading upwards to reach 62.66. From the technical point of view, this scenario is confirmed by Stochastic Oscillator: its signal line is about to reverse while moving inside the “oversold area”. Practically, the Oscillator tells that the price is trading near the downside border of the consolidation range. The indicator is expected to grow towards 50. Breakout of this level will boost the uptrend.

Disclaimer

Any predictions contained herein are based on the authors’ particular opinion. This analysis shall not be treated as trading advice. RoboForex shall not be held liable for the results of the trades arising from relying upon trading recommendations and reviews contained herein.

Python Programming: How to make text lowercase & uppercase

By CountingPips.com

A quick and simple way to change all text into lowercase or uppercase letters using python.

input:

text = “New York City”

lowertext = text.lower()

print (lowertext)

output: new york city

or you can simply apply .lower() to ‘text’

text.lower()

output: new york city


Uppercase is the same process.

input:

text.upper()

output: NEW YORK CITY

Golden Week sales exceed expectations

By Dan Steinbock

In contrast to gloomy international projections, economic realities suggest that China’s Golden Week may have exceeded expectations.

I spent China’s 70-year National Day festivities in Shanghai, China’s global financial hub, and Guangzhou, the global trade hub of the Guangdong-Hong Kong-Macao Greater Bay Area. In both, China’s massive transition toward consumption and innovation is now an increasing reality.

Due to US tariff wars, Chinese mass consumers – like their peers in the United States, Europe and Japan – are cost-conscious, increasingly discriminate and sophisticated in their spending. Indeed, sales of gold jewelry boomed during the holidays, fueled by gold prices, holiday festivities and the wedding season.

But unlike their counterparts in advanced economies where middle-classes are shrinking, Chinese middle classes continue to grow, expand and consume. That is the great opportunity in China and abroad alike.

The just-ended Golden Week is a case in point.

Golden Week retail sales 8.5% up

In effect, China has two “Golden Week” holidays; the Lunar New Year around January and February, and the National Day week in early October. Both are seen as a barometer for Chinese private consumption, due to gift-giving, family reunions, thriving retail and catering.

Last February, the Lunar New Year showed the slowest increase in years, according to international media. Yet, Chinese retail sales actually rose almost 7% from a year earlier.

Prior to the National Day Golden Week, once again, much of international media expected the trade wars to undermine Chinese holiday sales. And again, they were proved wrong. During the holidays, retail sales growth exceeded China’s growth rate by almost a half, with online sales soaring even higher.

During the Golden Week, Chinese retail and catering businesses saw sales of $213 billion, up 8.5% on the same period last year (spending on consumer services is not yet included, but will be released later in the month). New highlights featured spending on tourism, culture and sports, and “first-store economy”; that is, new brands launching their first brick-and-mortal stores.

These figures do not include the highly-popular discount sales that follow after the Golden Week.

Golden Week tourism revenues 8.5% up as well

Prior to the Golden Week, much of international media expected Chinese consumers to cut back on travel, due to trade wars and weaker yuan. In reality. Chinese people may have spent more than ever before at home and abroad.

During the past week, there were 520 million trips on all modes of transportation, with the number of rail passengers up 5.2% on the same period last year, according to the Ministry of Transport. At home, many visited Beijing, Shanghai, Xi’an, Chengdu, Chongqing and Xiamen. Abroad, the top locations featured Japan, Thailand, Korea, Vietnam, Indonesia, even Australia.

In the first Golden Week in 1999, only 29 million Chinese traveled, and all of them domestically. During the past week, almost 780 million domestic tourists – more than half of the mainland’s population – hit the road for vacations; an increase of 7.8% year-on-year. It was the greatest holiday migration in history.

Domestic tourism revenue soared to more than $90 billion; an increase of 8.5% on an annual basis, according to the Ministry of Culture and Tourism. Alipay, China’s leading and smooth online payment platform, confirmed that catering, travel and retail fueled domestic consumption during the holidays.

Currently, every 10th of the 1.4 billion Chinese holds a passport for international travel; that’s a potential of 140 million potential outbound travelers. With increasing prosperity, that figure is expected to double in the next decade.

Rise of Chinese consumption

No global brand can afford to ignore Chinese market any longer. In 2019, China’s economic growth is likely to be around 6%. Yet, in-store sales are estimated at 9% and online shopping at 24% year on yearly basis, according to KPMG.

Similarly, China’s consumer retail market is no longer a dream of the future. Last year, it grew 8% to $5.3 trillion. The Golden week is the country’s second-biggest shopping bonanza, right after Chinese New Year.

Despite US trade protectionism, Chinese tourists reportedly spent $128 billion overseas in the first half of the year. More than half of that was used in Asia, a fourth in the Americas and much of the rest in Europe. The Golden Week sales suggest that a similar pace will prevail toward year-end.

Last week, the biggest airport in the world was opened in Beijing. It was a prelude to the mid-2020s, when China will surpass the US as the largest aviation market, according to the International Air Transport Association. In two decades, Chinese airports could serve 1.6 billion passengers annually.

As China’s middle classes continue to increase and per capita incomes to grow, domestic and global retail and tourism will be major beneficiaries. China’s rise supports economic prospects at home and abroad. As the Golden Week demonstrated, Chinese consumption is now a global force.

About the Author:

Dr Dan Steinbock is the founder of Difference Group and has served at the India, China and America Institute (US), Shanghai Institute for International Studies (China) and the EU Center (Singapore). For more, see https://www.differencegroup.net/  

The commentary was released by China Daily on October 10, 2019.


Gold Gifts Traders With Another Rotation Below $1500

By TheTechnicalTraders.com

Positive expectations related to the US/China trades negotiations on October 10th prompted a moderately strong upside move in the US major indexes and the stock market.

Additionally, the precious metals fell in correlation to the upside move in the US stock market and presented another opportunity for skilled technical traders to look for entries below $1500 in Gold and below $17.75 in Silver.

We can’t stress the importance of this critical $1500 price level in Gold as a key level for all traders to watch.  It has continued to provide key support for Gold since the price rally that initiated in late April 2019.  We believe this level will act as a relatively strong price “floor” going forward and any price activity below $1500 could represent a very opportunistic entry area for skilled traders.

Back in early September, we authored this research post highlighting what we believed would happen going forward 30 to 60+ days for Gold.  At that time, the price of Gold has just rallied above $1500 for the first time in 2019.

We alerted our followers that we believed Gold would stall near the $1550 level, move briefly towards the $1475 to $1500 level, set up a new momentum base near the $1500 price level and begin a new rally soon after this base was complete.  You can read this research post here: https://www.thetechnicaltraders.com/global-market-chaos-means-precious-metals-will-continue-to-rise/ .

Gold Weekly Chart from Our September 2nd Research Post

This is a Gold Weekly chart from that September 2 research post.  We still believe our research from that post is accurate and we believe this new move below $1500 is an incredible opportunity for skilled traders that understand the real potential of the future of precious metals.

120 Minute Gold Chart Showing Price Correction Warning Before it happened

This 120 Minute Gold chart showing the early price decline on October 10, 2019 and highlighting the $1500 price support zone in RED illustrates how price has continued to find this level acting as strong support and how price has, in the past, moved through this level and back above it to form the new “momentum base/bottom” near October 1, 2019.

We believe any move below $1500 (or more precisely – $1495) is a very strong entry point.  Obviously, a price move to lower levels would be even better.  Currently, as long as price stays above the Momentum Base level (near $1463), then we consider the October 1 price rotation the true momentum base “low”.

Current Daily Chart of Gold – Support Zone, and Forecast

This Daily chart highlights the same $1500 price support zone and clearly illustrates why we believe any price move below $1500 is a very strong opportunity for skilled traders.  The next leg in Gold should push prices above $1700 (possibly higher).  Longer-term, we believe the fear and uncertainty in the global markets will not subside until well after the 2020 US Presidential election cycle completes.

Concluding Thoughts:

Therefore, we have at least 12 to 16+ months of continued fear driving investor uncertainty in precious metals and as the US political chaos heats up, so will precious metals.  At this point, we believe Gold has just started to “lift-off” in terms of the ultimate upside potential over the longer term.  We’ve discussed the potential of Gold reaching above $3750 and we believe this target level is very valid.

Yesterday I talked about how to trade and where gold, silver and miners were within their bul/bear market cycle which may surprise you. Listen to my thoughts in this Podcast here.

Play these moves accordingly.  This may be the last time you see Gold trading below $1500 for quite a while.

As a technical analysis and trader since 1997, I have been through a few bull/bear market cycles. I believe I have a good pulse on the market and timing key turning points for both short-term swing trading and long-term investment capital. The opportunities are massive/life-changing if handled properly.

Be sure to ride my coattails as I navigate these financial markets and build wealth while others lose nearly everything they own during the next financial crisis.

Chris Vermeulen
TheTechnicalTraders.com

NOTICE: Our free research does not constitute a trade recommendation or solicitation for our readers to take any action regarding this research.  It is provided for educational purposes only.  Our research team produces these research articles to share information with our followers/readers in an effort to try to keep you well informed.  Visit our web site to learn how to take advantage of our members-only research and trading signals.


The Concern for the Secretive Bio-Geopolitics

By Dan Steinbock  

Recently, many countries in Asia have suffered from deadly and costly epidemics. While globalization and climate change may play a causal role, germ geopolitics cannot be excluded any longer.

Entomological, anti-animal and crop-based diseases typically occur for natural reasons. All three have also be aggravated by globalization and climate change. However, evidence suggests that some of these outbreaks may also involve prior deployment in “biological programs” and “research.”

Take anthrax, for instance. Despite the post-9/11 concerns, the bacteria continue to be “researched.” In May 2015, Pentagon confirmed that its lab in Utah had “inadvertently” sent live anthrax samples to one of its military bases in South Korea. Last April, civic groups and residents took to the street to protest against biological agent experiments, which the US was reportedly conducting at Busan’s Port Pier 8. Pentagon’s budget estimates suggest the project was ongoing with funds set aside for live agent tests.

These issues remain sensitive in East Asia, in light of the US biowarfare against North Koreans and Chinese in the 1950s and contemporary geopolitics. Biological agents have dual-use functions. Like new technologies, they can save but also incapacitate and destroy human lives.

Asian Swine Fever: Epidemics Vs Geopolitics

Asian swine fever (ASF) is a hemorrhagic fever of pigs with mortality rates close to 100 percent and major economic losses. Historically, the first ASF outbreak took place in Kenya in 1907 and the first outside Africa in Portugal in 1957. That’s the official story.

In reality, by the early ’50s, several viruses, including ASF, were available in Fort Terry, a US bio-warfare facility in Plum Island, New York. Between the 1960s and late ‘90s, Cuba accused Washington of ten biological warfare attacks following serious infectious disease outbreaks. None were proven conclusively, but several most likely occurred. In 1971, pigs in Havana hog farm were diagnosed with ASF virus, which caused half a million pigs to be slaughtered. As Cuba suffered food shortage, the UN labeled the outbreak the “most alarming event” of 1971.

The debacle remained a mystery until 1977, when Long Island Newsday reported the virus was delivered from a US army base; the site of joint Army-CIA covert operations in the Panama Canal Zone. US Central Intelligence Agency (CIA) denied involvement. Yet, bio-warfare historian Norman Covert has affirmed CIA had access to the laboratories.

“CIA Denies Link to Cuban Swine Fever”

Following the Cold War, the ASF threat seemed to have been defused. But as a series of “color revolutions” took off in Eastern Europe – in countries targeted for NATO enlargement – the ASF in 2007 spread to Georgia in the Caucasus and thereafter widely to neighboring countries, including Armenia, Azerbaijan and several territories in Russia.

After a decade of relative quiet, the first ASF outbreak in China was reported in Shenyang in August 2018. It was thought to have come to China via Russia or Eastern Europe; that is, through the “color revolutions” countries.

The timing is intriguing. In China, the spread of ASF began with the US trade war after mid-2018. As a result, US pork sales to China were over three times pricier already last spring than a year before, despite the US retaliatory tariffs. China’s over 400 million pigs account for half of the world total. The ASF is a major threat to global food security.

US Trade War, China’s ASF Epidemic, Soaring Import Prices

China’s Breeding Saw Population, 2016-19

Source: FAO (UN), USDA (US), MARA (China)

Ethnic Bio-Bombs, Non-Endemic Outbreaks   

After the Cold War, the Nunn-Lugar Cooperative Threat Reduction Program (CTRP) was created presumably to keep the former Soviet Union’s nuclear and chemical infrastructure from rogue nations and terrorists. But as Congress in 1996 began to expand the program internationally, so did efforts to capitalize on its offensive uses.

In particular, the neoconservative Project for New American Century (PNAC), the ideological force behind the subsequent Bush administration’s foreign policy, declared in its manifesto Rebuilding America’s Defenses (2000) that “advanced forms of biological warfare that can ‘target’ specific genotypes may transform biological warfare from the realm of terror to a politically useful tool.”

Previously, such efforts at biological “ethnic bombs” had occurred mainly in apartheid-era South Africa and Rhodesia; the PNAC builds on the Israeli “ethno-bomb” idea to target specific genetic traits among target populations.

By May 2007, Russia banned all exports of human bio samples, due to concern for “genetic bio-weapons” targeting Russian population. Reportedly, some of these institutions, including Harvard Public Health and USAID, have collected biological material in China as well. In October 2018, Russian Defense Ministry claimed the spread of viral diseases from Georgia, including African swine fever since 2007, could be connected to a US lab network in the area, where more than 70 Georgians had died in odd conditions.

The lab network, a branch of the Nunn-Lugar bio-initiative, belongs to the multimillion-dollar Cooperative Biological Engagement Program (CBEP) funded by Pentagon’s Cooperative Threat Reduction Agency (DTRA). The CBEP labs are located in 25 countries, including in Eastern Europe (e.g., Georgia and Ukraine), the Middle East, Africa and Southeast Asia. In several locations, there have been reported outbreaks of tropical diseases, which are not endemic to the area.

Despite high-level Russian calls for a “comprehensive evaluation” and “joint inspections,” pleas for multilateral cooperation have been ignored. In its 2020 multimillion-dollar budget, the DTRA characterizes the “bio-security” program in Asia as “the partner of choice in a region competing against Chinese influence.”

Pressing Need for Multipolar Cooperation

Even the discoverer of the devastating Lyme disease Willy Burdorfer participated in US bio-warfare, according to science bestseller Bitten (2019). That has triggered New Jersey Rep. Chris Smith’s investigation into whether Pentagon has experimented with tics and other insects as biological weapons.

International concern is rising over the role of potential covert goals in viral outbreaks. By September, the Fall armyworm, a pest that can damage a wide variety of crops, had spread to 25 Chinese provinces posing a severe threat to food security. Described first in 1797, it used to be endemic only to Americas. After the Trump 2016 win, it has globalized faster than Facebook. Only crisis measures permitted China to contain the threat “for this year.”

A new Pentagon program called “Insect Allies” funded by the Defense Advanced Research Projects Agency (DARPA) relies on gene editing and hopes to infect insects with modified viruses, presumably to make US crops more resilient. In contrast, international scientists suggest such programs do not represent agricultural research but new bio-weapon programs, which violate the Biological Weapons Convention.

During the Cold War, the threat of the mutually assured destruction constrained nuclear and bio-warfare risks, however. The contemporary era is devoid of such constraints and thus far more dangerous. The most effective way to resolve the contested bio-warfare challenges would be to build on international multilateral biological arms control, particularly the 1925 Geneva Protocol, the 1972 Biological and Toxin Weapons Convention (BWC) and the 1993 Chemical Weapons Convention (CWC).

With rising climate risks and geopolitical tensions, no single country should have monopoly over biological agents in the 21st century. What’s desperately needed is multipolar cooperation among the major advanced economies and large emerging powers.

About the Author:

Dr. Dan Steinbock is the founder of Difference Group and has served at the India, China and America Institute (US), Shanghai Institute for International Studies (China) and the EU Center (Singapore). For more, see http://www.differencegroup.net/  

A shorter version of the commentary was released by China-US Focus on October 10, 2019


Forex Technical Analysis & Forecast 11.10.2019 (EURUSD, GBPUSD, USDCHF, USDJPY, AUDUSD, USDRUB, USDCAD, GOLD, BRENT, BTCUSD)

Article By RoboForex.com

EURUSD, “Euro vs US Dollar”

After forming the consolidation range around 1.0985 and breaking it upwards, EURUSD has completed the descending impulse from 1.1031 along with the correction. Possibly, today the pair may form the second impulse to reach 1.0944 and then start another correction towards 1.1088. Later, the market may resume trading downwards with the target at 1.0985.

EURUSD
Risk Warning: the result of previous trading operations do not guarantee the same results in the future

GBPUSD, “Great Britain Pound vs US Dollar”

GBPUSD is moving upwards. Possibly, the pair may a new wave to the upside to reach 1.2551 and then start another decline towards 1.2382. After that, the instrument may resume trading upwards with the target at 1.2565.

GBPUSD
Risk Warning: the result of previous trading operations do not guarantee the same results in the future

USDCHF, “US Dollar vs Swiss Franc”

USDCHF is moving upwards. Today, the pair may reach 0.9981 and then form a new descending structure 0.9976. After that, the instrument may continue trading upwards with the target at 1.0014.

USDCHF
Risk Warning: the result of previous trading operations do not guarantee the same results in the future

USDJPY, “US Dollar vs Japanese Yen”

USDJPY is moving upwards as well; it has broken 107.70 and right now is forming a continuation pattern. Possibly, today the pair may grow to reach 108.34 and then fall to return to 107.70. Later, the market may form one more ascending structure with the target at 108.87.

USDJPY
Risk Warning: the result of previous trading operations do not guarantee the same results in the future

AUDUSD, “Australian Dollar vs US Dollar”

AUDUSD has completed the ascending wave at 0.6780; the structure of the fifth wave implies further growth towards 0.6793. Later, the market may start a new correction to the downside with the target at 0.6725.

AUDUSD
Risk Warning: the result of previous trading operations do not guarantee the same results in the future

USDRUB, “US Dollar vs Russian Ruble”

USDRUB is falling towards 64.30. Possibly, today the pair may reach this level and then resume trading upwards with the target at 64.82. Later, the market may start another decline to reach 64.10.

USDRUB
Risk Warning: the result of previous trading operations do not guarantee the same results in the future

USDCAD, “US Dollar vs Canadian Dollar”

After breaking the consolidation range to the downside, USDCAD has fallen towards 1.3273. Today, the pair may start another correction to reach 1.3309 and then form a new descending structure towards with the target at 1.3289.

USDCAD
Risk Warning: the result of previous trading operations do not guarantee the same results in the future

XAUUSD, “Gold vs US Dollar”

After breaking 1501.60 to the downside, Gold has reached 1492.30; right now. it is consolidating around 1494.50. According to the main scenario, the price is expected to form one more ascending structure to return to 1501.60 to test it test below and then resume trading inside the downtrend with the first target at 1486.60.

GOLD
Risk Warning: the result of previous trading operations do not guarantee the same results in the future

BRENT

Brent is moving upwards. Possibly, today the pair may reach 60.33 and then consolidate around it. After breaking this range to the upside, the instrument may resume trading upwards with the predicted target at 63.63.

BRENT
Risk Warning: the result of previous trading operations do not guarantee the same results in the future

BTCUSD, “Bitcoin vs US Dollar”

BTCUSD is growing towards 8700.00. Today, the pair may reach this level and then start a new decline with the target at 8400.00. Later, the market may form one more ascending structure towards 9000.00.

BITCOIN

Article By RoboForex.com

Attention!
Forecasts presented in this section only reflect the author’s private opinion and should not be considered as guidance for trading. RoboForex LP bears no responsibility for trading results based on trading recommendations described in these analytical reviews.

Fibonacci Retracements Analysis 11.10.2019 (BITCOIN, ETHEREUM)

Article By RoboForex.com

BTCUSD, “Bitcoin vs US Dollar”

As we can see in the H4 chart, after breaking the local high at 8530.70, the rising correction has reached 38.2% fibo. The next upside targets may be 50.0% and 61.8% fibo at 9075.00 and 9405.00 respectively. If the price breaks the low at 7675.00, BTCUSD will continue falling to reach the mid-term correctional target, 61.8% fibo at 7350.00.

BITCOIN
Risk Warning: the result of previous trading operations do not guarantee the same results in the future

In the H1 chart, the divergence made the pair start a new short-term pullback, which is getting close to 38.2% fibo at 8410.80. Later, this decline may continue towards 50.0% and 61.8% fibo at 8290.30 and 8167.50 respectively. The resistance is at 8809.00.

BTCUSD
Risk Warning: the result of previous trading operations do not guarantee the same results in the future

ETHUSD, “Ethereum vs. US Dollar”

As we can see in the H4 chart, the correctional uptrend has reached 61.8% fibo, which is the resistance of the long-term descending channel. In this case, the ETHUSD is expected to start a new decline. After breaking the low at 152.28, this decline may be heading towards 76.0% fibo at 148.60 and then the post-correctional extension area between 138.2% and 161.8% fibo at 140.40 and 125.85 respectively.

ETHUSD
Risk Warning: the result of previous trading operations do not guarantee the same results in the future

In the H1 chart, the divergence on MACD made the pair start a new short-term decline, which is getting close to 38.2% fibo at 186.00. Later, the decline may continue towards 50.0% and 61.8% fibo at 182.50 and 178.95 respectively. The resistance is at 197.37.

ETHEREUM

Article By RoboForex.com

Attention!
Forecasts presented in this section only reflect the author’s private opinion and should not be considered as guidance for trading. RoboForex LP bears no responsibility for trading results based on trading recommendations described in these analytical reviews.

Investors Expect US President and Chinese Vice Premier to Meet

by JustForex

The US dollar fell against a basket of major currencies. The dollar index (#DX) closed yesterday’s trading session in the negative zone (-0.41%). The sentiment of financial market participants worsened after a tweet by the US President. Donald Trump tweeted the following: “Big day of negotiations with China. They want to make a deal, but do I? I meet with the Vice Premier tomorrow at The White House.” So now investors are still following the negotiations between the US and China with even greater attention. It is not yet clear whether countries will conclude an agreement.

Yesterday, weak US economic data was also published. So, the core consumer price index rose only by 0.1% in September instead of 0.2%. In addition, mixed reports were released in the UK. Thus, GDP (y/y) grew by 1.1% instead of 0.9%, but GDP (m/m) decreased by 0.1%, although experts did not expect any changes. Manufacturing production declined by 0.7% in August instead of the expected growth by 0.1%. At the same time, demand for the British pound has grown significantly due to the prospects for a settlement of the Brexit process. Irish Prime Minister, Leo Varadkar, said a Brexit agreement could be concluded by the end of October that would allow the UK to leave the European Union step by step.

The “black gold” prices have been growing. Currently, futures for the WTI crude oil are testing the $54.55 mark per barrel.

Market Indicators

Yesterday, there was the bullish sentiment in the US stock markets: #SPY (+0.68%), #DIA (+0.60%), #QQQ (+0.77%).

The 10-year US government bonds yield increased significantly. At the moment, the indicator is at the level of 1.67-1.68%.

The Economic News Feed for 11.10.2019:
  • – Report on the labor market in Canada at 15:30 (GMT+3:00).

by JustForex