On Thursday the 7th of November, trading on the euro closed down. Volatility was high during the European session. The rise to 1.1092 was brought about by news from China, while the subsequent drop to 1.1036 was caused by the Bank of England meeting.
China and the US have agreed to phase out the tariffs imposed over the course of the trade conflict. This was announced by the Chinese trade minister. The news increased the market’s appetite for risk. The meeting between the US and Chinese presidents Donald Trump and Xi Jinping has been pushed back to next month.
The Bank of England left interest rates at their current level of 0.75%. Two members of the MPC (Saunders and Haskell) out of 9 voted to reduce rates by 25 base points. This came as a shock to many. The GBPUSD pair dropped by 73 pips to reach 1.2794, dragging down the other majors with it and cancelling out the effect of the news from China.
Day’s news (GMT+3):
10:00 Germany: trade balance (Sep).
16:30 Canada: unemployment rate (Oct), net change in employment (Oct).
18:00 US: Michigan consumer sentiment index (Nov).
Current situation:
Despite the positive news from China and the following rise to 1.1092, the pair missed our target from the 6th of November.
The euro is currently trading at 1.1051, with the 112th degree providing support. The current situation is similar to the 6th of November, so we’ve taken a similar formation as the basis for today’s forecast, in which we expect a rise to the LB balance line at 1.1070, followed by a drop to the 135th degree at 1.1017. The forecast is for Friday and Monday.
On the H4 and H8 timeframes, the indicators point towards an upwards correction, so we don’t expect to reach fresh lows today. If we look at futures on the euro (6EZ19), there are a lot of major sales on the market. There’s not much in the economic calendar today, so pay more attention to technical analysis.
We wrote a very telling research article on October 24th, 2019. We never published it because we had other articles scheduled to be published over the next few weeks in the queue and because our subscribers get our trade alerts before the general public. At this point, we are sharing that past article as well as some current research for Natural Gas that should be very interesting to you.
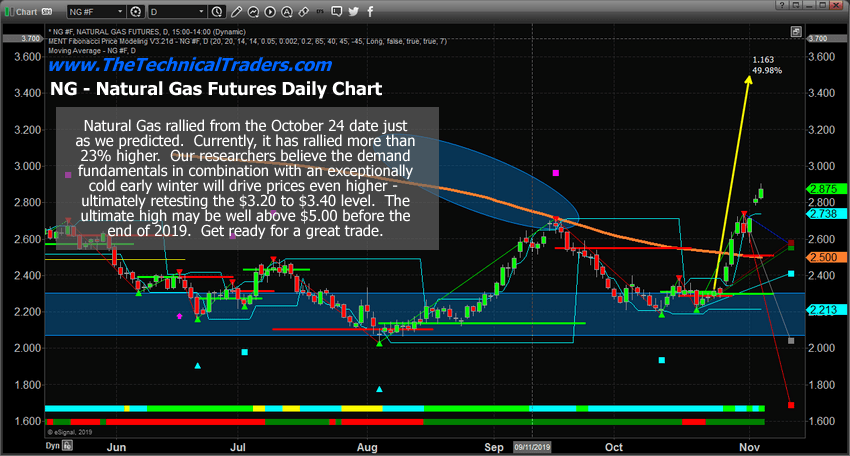
Pay very close attention to the original October 24th article, below, and our prediction that the $2.75 to $2.85 level would be a likely target for the upside price rally from the basing level below $2.30. Currently, Natural Gas is trading at $2.87 – reaching our initial target level.
If our research is correct, strong demand and limited supply globally may push Natural Gas well above the $3.20 to $3.40 level after a very brief pause happens near $3.00. In fact, Natural Gas may be getting ready to rally past 2018 highs ($4.93) if the situation presents itself for such an incredible price rally. What would it take for a rally like that to happen? Much stronger demand for natural gas because of an early, extreme winter and extended global demand.
Price reacts to supply/demand imbalances. In this case, if the demand far exceeds the supply capacities headed into the end of 2019, we could easily see Natural Gas rally above $4.00 very quickly. Could it rally even higher and take out the $5.00 level? Absolutely it could if the proper dynamics continue related to supply and demand globally.
Current Daily Natural Gas Chart
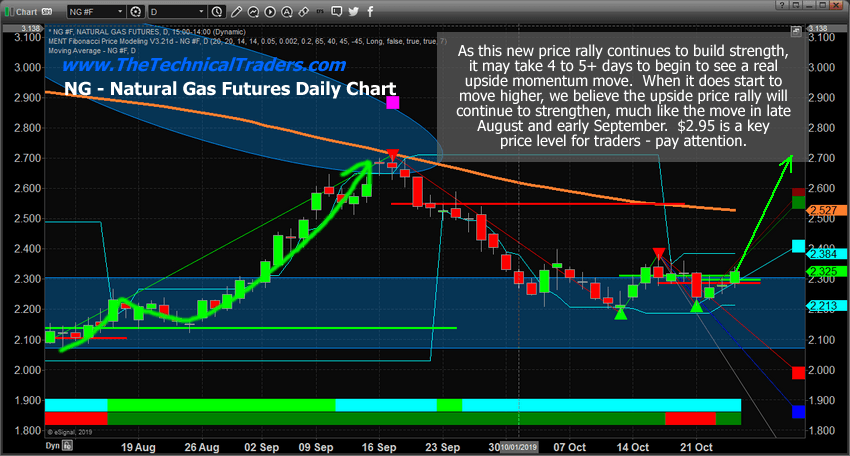
Remember to read the link from October 5th. We’ve been warning of this move for more than 60+ days and have authored multiple research posts attempting to keep our followers aware of this setup. This trade setup was telegraphed for us many months ago. All you had to do was follow our research and stay aware of the trends as this momentum base setup in October near $2.25.
Natural Gas moved higher by nearly 2% on October 24th as our researchers predicted nearly a month ago. This incredible momentum base below $2.30 seems to be a very strong support level for Natural Gas. We believe this next rally may be bigger than the last rally which reached a high near 2.70. Our Fibonacci price modeling system is suggesting a target price of $2.95 to confirm a new upside price trend. This means the price would have to rally more than +26.5% from current levels to confirm a potentially much bigger upside price move. Can you imagine seeing Natural Gas climb to above $4.50 again – like last year?
Near the end of October 2018, Natural Gas began an upside price move that really excited investors. The first upside price leg began in mid-September, near $2.75 and rallied to a level near $3.35 – a +21.6% upside price move. After a brief 12 to 15 day pause, another price rally began in early November 2018 near $3.23 and continued very aggressively over the next 11+ days to rally up to $4.93 – a +57% rally.
We issued a natural gas trade using UGAZ to members and this week we locked in 38.7% profit on a portion of our position and there is still a lot of upside potential left.
Is the same type of price advance could be setting up for an early November price rally from the $2.30 level to somewhere above $3.50? This would result in a +50% price rally from recent lows without using any leverage which would be just amazing.
Our proprietary Fibonacci price modeling system is suggesting the $2.95 price level is critical for any further upside price action to continue above $3.00. The price must cross above the $2.95 level on a strong closing price basis before we could consider any higher price levels to become valid. Our researchers believe that suggests the $2.75 to $2.85 level becomes a very real upside price target for skilled traders to pull some profits and protect any open long positions.
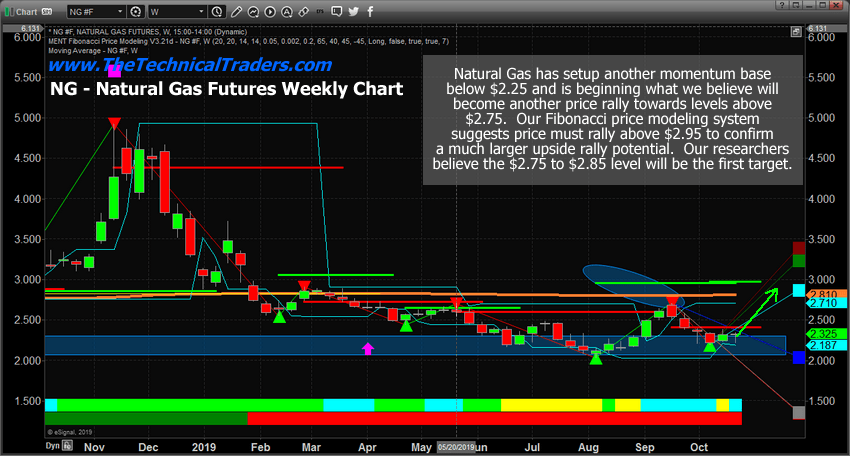
Previous Natural Gas Forecast Weekly Chart
This Weekly Natural Gas chart highlights our Fibonacci price modeling system’s results and the Bullish Trigger Level near $2.95 (The GREEN LINE). Pay very close attention to how quickly Natural Gas moved higher in November 2018. If another move happens like that in 2019, we could be setting up for a big gap higher followed by about 10 to 15+ days of incredible upside price action.
Currently, the price of Natural Gas has crossed the Daily Fibonacci price modeling system’s Bullish Price Trigger level near $2.29. This suggests that we are now in a confirmed bullish trend as long as the price stays above the $2.26 level on a closing price basis. We would expect a continued moderate price rally from these levels to move price away from the momentum base level over time – before any breakout upside price move may begin.
This could become one of the best trades, besides Silver and Gold, headed into the end of 2019. Get ready for some big volatility in Natural Gas as winter weather takes over much of North America.
November will be the month of breakouts and breakdowns and should spark some trades. I feel the safe havens like bonds and metals will be turning a corner and starting to firm up and head higher but they may not start a big rally for several weeks or months.
October was a boring month for most major asset classes completing their consolidation phase. Natural gas was the big mover in October and subscribers and I took full advantage of the bottom and breakout for a 15-22% gain and its till on fire and trading higher by another 3% this week already.
The global financial market is in a period of turmoil, and as such investors need to be constantly thinking ahead to how they can find new, more stable investment options so as to better manage their risk. With the global doom and gloom following the UK’s Brexit debacle, the USA’s potential impeachment of its Twitter-loving president and global economic uncertainty, it can be easy to think that you should batten down your investment hatches and focus all of your time and energy on tried-and-tested markets and asset classes. However, as London’s Forex trading market booms and global investors come around to the benefits of this often overlooked market, there has never been a better time to consider moving into the Forex market.
What Is Forex Trading?
Forex trading involves trading on the foreign exchange market, where currency is bought and sold and the relative value of global currencies is set. A decentralised, online market, the Forex market supports practically every business in the world, as such it is a vast market where savvy traders can achieve incredible success. Open 24 hours a day, five days a week, the Forex market is a global space where currency can be exchanged and trades can be undertaken in a variety of ways, including spread betting, futures trading and forward trading. The most common way to trade in currency is to choose a currency pair, then decide which way you expect the exchange rate to move. Then you wait, and should your prediction prove right you can close your trade on a profit. As an asset class, currency is perfect for hedging a portfolio, as earnings can be made from both the difference in value between two currencies and by holding a specific currency until its value rises, meaning that traders always have options even as the market fluctuates.
Why You Should Consider Forex Trading
If you’ve found success trading in another market or asset class then it can be difficult to see why moving into a new trading market, particularly one that’s notoriously tough for beginners, is a wise idea. However, as financial markets around the world continue to struggle, economic downturn worsens and predictions of a future recession become more likely, it’s of vital importance that investors safeguard their money by investing it strategically. One of the best ways to ensure that your portfolio will survive a recession is to diversify and make sure that you’ve got money invested in a variety of different asset classes and markets. As currency remains a staple asset even through a recession, it is ideal for those who fear the worst and want to make sure that their portfolio is protected. After all, even during a recession money still exists, and whilst some trades may close on a loss, intelligent traders can use a recession to their advantage in the Forex market by predicting which countries will struggle and which will prosper and investing accordingly.
Incorporating Forex Trading Into Your Portfolio
Trading on the Forex market is extremely flexible, and trades can be made for either the long or short-term, depending on your investment strategy. As such, intelligent traders can make the Forex market work for them and use its versatility to their advantage. You can further diversify your portfolio by investing across a variety of different global currencies, so that should one struggle, you’ve still got other trades going that could potentially bring you a profit. When trading on the Forex market it’s vital that you keep up to date with the latest market developments, and are well-informed about how the market is currently operating, so follow the market intently before you decide to move into it so that you’re completely prepared for when you do decide to invest.
How To Go About Trading On Forex
Once you’ve decided to start investing in the Forex market, the first and most important decision to make is what broker to work with. Many new traders entering the Forex market make basic mistakes, so it’s important that you work with an experienced broker who can help you not only to access the best trades on the market, but also navigate the pitfalls and challenges that it offers. Whether you want a full-service broker to provide you with advice and support or a discount broker to just give you access to the best trades in the Forex market, you need to find the perfect broker to help you to achieve the returns you want. To make the decision easier, use a dedicated broker review platform like FX Scouts to find out more about a wide range of different brokers and select the one that’ll help you to move into making money trading on the Forex market.
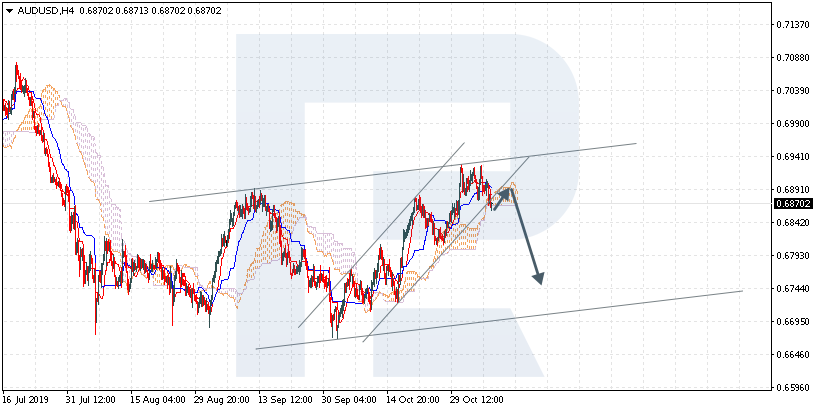
AUDUSD is trading at 0.6870; the instrument is moving below Ichimoku Cloud, thus indicating a descending tendency. The markets could indicate that the price may test the cloud’s upside border at 0.6890 and then resume moving downwards to reach 0.6745. Another signal to confirm further descending movement is the price’s rebounding from the rising channel’s downside border. However, the scenario that implies further decline may be canceled if the price breaks the cloud’s upside border and fixes above 0.6955. In this case, the pair may continue growing towards 0.7075.
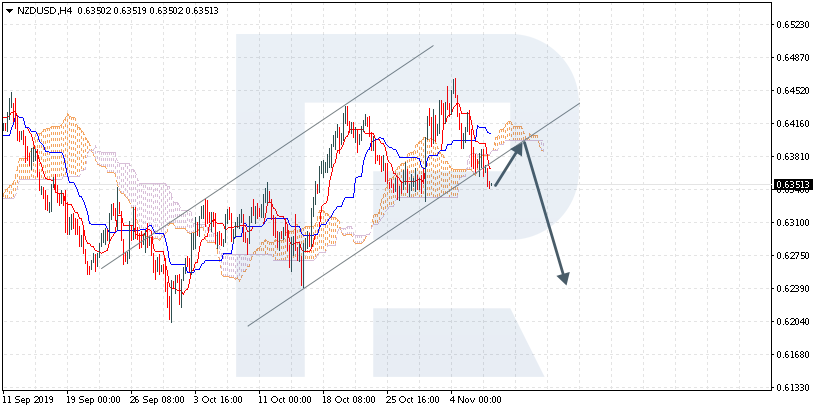
NZDUSD, “New Zealand Dollar vs US Dollar”
NZDUSD is trading at 0.6351; the instrument is moving below Ichimoku Cloud, thus indicating a descending tendency. The markets could indicate that the price may test the cloud’s downside border at 0.6380 and then resume moving downwards to reach 0.6240. Another signal to confirm further descending movement is the price’s rebounding from the rising channel’s downside border. However, the scenario that implies further decline may be canceled if the price breaks the cloud’s upside border and fixes above 0.6445. In this case, the pair may continue growing towards 0.6550.
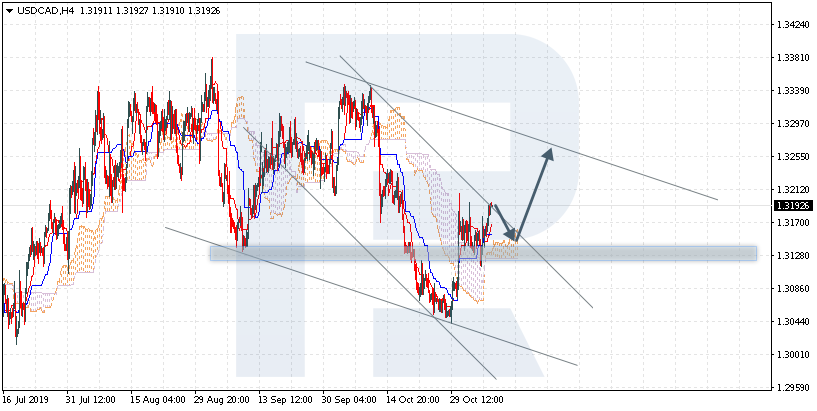
USDCAD, “US Dollar vs Canadian Dollar”
USDCAD is trading at 1.3192; the instrument is moving above Ichimoku Cloud, thus indicating an ascending tendency. The markets could indicate that the price may test the cloud’s upside border at 1.3125 and then resume moving upwards to reach 1.3325. Another signal to confirm further ascending movement is the price’s rebounding from the support level. However, the scenario that implies further growth may be canceled if the price breaks the cloud’s downside border and fixes below 1.3070. In this case, the pair may continue falling towards 1.2995. After breaking the descending channel’s upside border and fixing above 1.3210, the price may continue moving upwards.
Attention! Forecasts presented in this section only reflect the author’s private opinion and should not be considered as guidance for trading. RoboForex LP bears no responsibility for trading results based on trading recommendations described in these analytical reviews.
As we can see in the H4 chart, USDCHF has broken 5/8. In this case, the price is expected to continue growing to reach the resistance at 7/8. However, this scenario may no longer be valid if the price breaks 5/8 to the downside. After that, the instrument may continue falling towards 4/8.
As we can see in the M15 chart, the pair has broken the upside line of the VoltyChannel indicator and, as a result, may continue the ascending tendency.
XAUUSD, “Gold vs US Dollar”
As we can see in the H4 chart, XAUUSD is still consolidating at 3/8. In this case, the price is expected to break 3/8 and then continue falling to reach the support at 2/8. However, this scenario may no longer be valid if the price breaks 4/8 to the upside. After that, the instrument may continue growing towards the resistance at 5/8.
In the M15 chart, the pair may break the downside line of the VoltyChannel indicator and, as a result, continue its decline.
Attention! Forecasts presented in this section only reflect the author’s private opinion and should not be considered as guidance for trading. RoboForex LP bears no responsibility for trading results based on trading recommendations described in these analytical reviews.
The US dollar fell slightly against a basket of currency majors. The dollar index (#DX) closed yesterday’s trading session in the red zone (-0.04%). It became known that the meeting between US President Donald Trump and Chinese President Xi Jinping, at which the first stage of the trade deal was to be signed, could be postponed until December. The parties have not yet agreed on a new venue for the meeting. It also became known that Washington and Beijing intended to cancel some mutual tariffs on goods simultaneously. China said it was ready to negotiate on this issue.
Investors have taken a wait-and-see attitude before the Bank of England meeting. It is expected that no changes in the policy of the regulator will happen. However, financial market participants expect some reaction from the Bank to current Brexit-related events.
The “black gold” prices have been growing. Currently, futures for the WTI crude oil are testing the $57.00 mark per barrel.
Market Indicators
Yesterday, there was a variety of trends in the US stock markets: #SPY (+0.02%), #DIA (+0.00%), #QQQ (-0.22%).
The 10-year US government bonds yield has updated local highs. At the moment, the indicator is at the level of 1.85-1.86%.
The Economic News Feed for 07.11.2019:
– Bank of England interest rate decision at 14:00 (GMT+2:00).
We also recommend paying attention to the speeches by FOMC representatives.
The EUR / USD currency pair continues to show negative dynamics. The demand for greenback remains at a fairly high level. EUR/USD quotes updated the local lows. At the moment, the trading instrument is testing the support level of 1.10550. 1.10750 is already a mirror resistance. The single currency has the potential to further decline. We recommend opening positions from key levels.
The Economic News Feed for 07.11.2019:
– Initial Jobless Claims (US) – 15:30 (GMT+2:00);
Pay attention to the speeches by the FOMC representatives.
Indicators point to the power of the sellers, the price has fixed below 50 MA and 100 MA.
The MACD histogram is in the negative zone and below the signal line, which gives a strong signal to sell EUR/USD.
The Stochastic Oscillator is in the neutral zone, the %K line is above the %D line, which indicates a bullish sentiment.
Trading recommendations
Support levels: 1.10550, 1.10250, 1.10000
Resistance levels: 1.10750, 1.10900, 1.11200
If the price consolidates below 1.10550, expect a further descend toward 1.11000-1.11200.
Alternatively, the quotes can grow toward 1.11000-1.11200.
The GBP/USD currency pair
Technical indicators of the currency pair:
Prev Open: 1.28835
Open: 1.28528
% chg. over the last day: -0.23
Day’s range: 1.28372 – 1.28598
52 wk range: 1.1959 – 1.3385
The GBP/USD currency pair is falling before the meeting of the Bank of England. Today, the regulator will announce its decision on a key interest rate. It is expected that the Central Bank will maintain the basic parameters of monetary policy at the same level. At the same time, the Central Bank may signal a decrease in interest rates amid the uncertainty surrounding Brexit. At the moment, GBP/USD quotes are consolidating in the range of 1.28350-1.28600. We recommend opening positions from these marks.
At 14:00 (GMT+2:00) the Bank of England will announce its decision on the key interest rate.
The MACD histogram is in the negative zone and below the signal line, which gives a strong signal to sell GBP / USD.
MACD.
The Stochastic Oscillator is in the neutral zone, the %K line crossed the %D line. There are no signals at the moment.
Trading recommendations
Support levels: 1.28350, 1.28100
Resistance levels: 1.28600, 1.28900, 1.29150
If the price consolidates below 1.28350, expect the further drop toward 1.28000-1.27800.
Alternatively, the quotes could grow toward 1.28800-1.29000
The USD/CAD currency pair
Technical indicators of the currency pair:
Prev Open: 1.31550
Open: 1.31822
% chg. over the last day: +0.21
Day’s range: 1.31701 – 1.31971
52 wk range: 1.2727 – 1.3664
The USD/CAD currency pair has moved up. The trading tool has reached the key extremes. Pressure on CAD is caused by weak a Canadian PMI report from Ivey. At the moment, USD / CAD quotes are consolidating. The local support and resistance levels are 1.31700 and 1.32000, respectively. The USD / CAD currency pair has the potential for further growth. We recommend paying attention to the dynamics of oil quotes. Open positions from key levels.
The Economic News Feed for 07.11.2019 is calm.
The price fixed above 50 MA and 100 MA, which signals the power of buyers.
The MACD histogram is in the positive zone, but below the signal line, which gives a weak signal to buy USD/CAD.
The Stochastic Oscillator is in the neutral zone, the %K line is below the %D line, which indicates a bearish sentiment.
Trading recommendations
Support levels: 1.31700, 1.31400, 1.31150
Resistance levels: 1.32000, 1.32300, 1.32500
If the price consolidates above the round level of 1.32000, expect further growth toward 1.32300-1.32500.
Alternatively, the quotes could decrease toward 1.31500-1.31300.
The USD/JPY currency pair
Technical indicators of the currency pair:
Prev Open: 109.170
Open: 108.962
% chg. over the last day: +0.22
Day’s range: 108.648 – 109.123
52 wk range: 104.97 – 114.56
The USD/JPY currency pair shows a high trading activity and volatility. A trading instrument tests key highs. Financial market participants continue to monitor the settlement of the trade conflict between Washington and Beijing. At the moment, the local support and resistance levels are 108.800 and 109.100, respectively. We do not exclude further growth of the USD/JPY quotes. Open positions from the key levels.
The Economic News Feed for 07.11.2019 is calm.
Indicators do not give accurate signals: the price crossed 50 MA and 100 MA.
The MACD histogram is in the negative zone, but above the signal line, which gives a weak signal to sell USD/JPY.
The Stochastic Oscillator is in the neutral zone, the %K line is above the %D line, which indicates bullish sentiment.
Trading recommendations
Support levels: 108.800, 108.650, 108.500
Resistance levels: 109.100, 109.250, 109.500
If the price consolidates above 109.100, expect further growth toward 109.400-109.600.
Alternatively, the quotes could descend toward 108.600-108.400.
On Wednesday the 6th of November, trading on the euro closed slightly down at -0.07%. Following a rise to 1.1093, the bear hit fresh weekly lows in the Asian session. The effects of European data were short-lived. In the US session, the pair returned to 1.1065. There’s not much to say about what happened yesterday; better to get straight to analyzing our main pair.
Day’s news (GMT+3):
12:00 Eurozone: economic bulletin.
13:00 Eurozone: European Commission releases economic growth forecasts.
In today’s Asian session, the majors are trading down against the US dollar except for the safe havens. The yuan is falling, while the yen and gold are rising. Demand for the safe havens is rising amid speculation over renewed disputes between Washington and Beijing. China is seeking to have the 15% import tariffs imposed in September abolished. The US wants to conclude a deal without overturning previously imposed tariffs.
Yesterday’s target was missed. Today we expect a drop to 1.1043. The bears hit a new low in the Asian session, shifting the weekly low from 1.1064 to 1.1055. 1.1-43 is the minimum target for the double top model on the H8 timeframe. The question is via which model will this target be reached? Yesterday we wrote that we need to hit fresh lows before getting an upwards correction. This condition has now been fulfilled. Ideally, this correction should take place from the 112th degree.
The rise of the Shanghai Import Expo reflects China’s huge transformation from world producer and cheap prices to world consumer and innovator.
Speaking at the second China International Import Expo (CIIE) in Shanghai, Chinese president Xi Jinping pledged China will stimulate increased imports, continue to broaden market access, foster a world-class business environment, explore new horizons of opening-up and promote international cooperation at multilateral and bilateral levels.
In order to safeguard and promote economic globalization, Xi said two years ago at the World Economic Forum in Davos, Switzerland that “efforts to reduce tariff barriers and open up wider will lead to inter-connectivity in economic cooperation and global trade.” In contrast, “the practices of beggaring thy neighbor, isolation and seclusion will only result in trade stagnation and an unhealthy world economy.”
Today, that message is critical. The World Bank has forecast only 2.6 percent global growth in 2019. That’s the lowest since the global financial crisis of 2008-9. And the collateral damage of trade protectionism is spreading worldwide.
China shifts from exports to imports
In the past, the best known trade event in China was the Canton Fair in the southern Guangdong province. In October, even amid the US tariff wars, it attracted more than 210 countries and regions, 25,000 companies and some 200,000 potential buyers, most of which were from Belt and Road countries.
China is now promoting the Shanghai CIIE as the world’s first international import expo. Its partners include the World Trade Organization and key United Nations trade organizations, which understand well that the CIIE reflects China’s structural rebalancing from investment and net exports toward innovation and consumption.
Shanghai, the most international Chinese megacity, is the natural host of the import expo. While the Canton Fair built its clout over decades, the Shanghai CIIE could develop its international influence in a matter of years.
Despite international tensions, it has attracted foreign leaders, such as French President Emmanuel Macron, diamonds from Belgium, Cambodian fragrant rice, and Kenyan farm products, along with US automaker Ford’s cutting-edge Ford and Lincoln brands. Despite the US tariff war against China, almost 200 US-based companies – from GE to Qualcomm – are participating in the CIIE and US companies have the largest exhibition space at the expo.
While the Canton Fair has morphed from traditional manufacturing exports to advanced technology, the Shanghai CIIE is focused on imports. It’s a massive shift in a country of more than 1.3 billion people. As China has prospered, Chinese companies have invested increasingly abroad, while Chinese consumers can afford foreign imports, thanks to reforms and opening-up policies, and Chinese innovation in ecommerce.
Middle-income consumers drive import growth
Recently, the European Union (EU) said that its firms had provided positive feedback on the CIIE last year, registered increased sales or met new potential buyers. Yet, EU wants more to do more vis-à-vis the EU-China investment agreement.
Obviously, the US, the EU and Japan would like to see China implementing the kind of reforms that support their exporters in the near term. But such reforms cannot happen disruptively. Even the advanced countries fought two world wars and were engaged in a Cold War before import growth truly picked up internationally.
While the middle class is shrinking in the West, China’s gradual reforms will ensure a rapidly expanding middle-income consumer base, the new precondition of international trade. As the world factory is morphing into the world’s largest market, rising numbers of consumers fuel import growth.
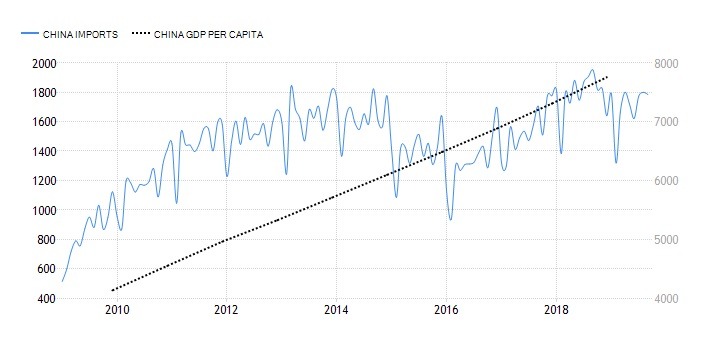
As China’s intensive industrialization shifts toward a post-industrial society, GDP growth is decelerating, but living standards, as measured by per capita income, are rising (Figure). That is vital for import growth over time and provides a blueprint for middle-income groups in other large emerging countries, such as India.
FigureChinese Imports and GDP Per Capita, 2000-2019
As long as globalization advances in both rich and middle-income economies, imports to China increase. For instance, as the world economy was still recovering in early 2018, Chinese imports reached an all-time high. But after the US began imposing heavy tariffs on Chinese imports, businesses invested more cautiously and consumers became more cost-conscious. After all, China’s average per capita income remains only 15-25 percent of that in the US and Western Europe.
Long-term benefits require global cooperation
Some US research firms expect China to become the world’s top retail market this year, surpassing the US. The forecast may be optimistic, but the trend is clear. Today, China’s imports of goods and services are estimated to be about 10 percent of the global total and, given international peace and stability, they will continue to expand.
China’s focus is on economic development that shuns trade protectionism and seeks to balance the needs of the global economy and its own economy. That’s why, instead of promoting “China First” nationalism and imposing excessive tariffs on imports, China is helping the Canton Fair to expand international trade and the Shanghai CIIE to supports import and that’s why President Xi promotes globalization.
That’s very much in the long-term interest of both the advanced and developing economies.
About the Author:
Dr. Dan Steinbock is an internationally recognized strategist of the multipolar worldand the founder of Difference Group. He has served at the India, China and America Institute (US), the Shanghai Institutes for International Studies (China) and the EU Center (Singapore). For more, see https://www.differencegroup.net/
The original commentary was published online by China Daily on Nov 6, 2019, and in print on Nov 7, 2019.
A Jeremy Corbyn-led government will lead to an exodus of high-net-worth individuals from Britain, warns the CEO of one of the world’s largest independent financial advisory organizations.
The warning from deVere Group’s chief executive, Nigel Green, comes as UK Prime Minister Boris Johnson today launches his official election campaign with a column in The Daily Telegraph in which he compares opposition Labour Leader Jeremy Corbyn to Stalin over his “hatred” of wealth creators.
Mr Green notes: “Whilst I wouldn’t have used the language employed by Mr Johnson, through his anti-business rhetoric, and high tax and low-profit policies Jeremy Corbyn does routinely take swiping broadsides at the wealthy.
“It’s our experience that an increasing number of high-net-worth clients are legitimately worried about the damaging impact of a Jeremy Corbyn-led government on their finances.
“There are real concerns from these individuals that should Mr Corbyn sweep into power he would increase inheritance taxes, income taxes, stamp duty and capital gains taxes, potentially even roll out capital controls, and slash other areas, such as pensions tax relief.”
He continues: “I believe we can realistically expect a Corbyn government would trigger an exodus of the country’s most successful and wealthiest individuals who contribute significantly both directly and indirectly to the British economy.
“Soaking the rich doesn’t work because these people, typically, have the resources to move to lower tax jurisdictions if the tax burden in the UK becomes too great. They are internationally mobile.
“Should these largely job and wealth-creating individuals emigrate – and according to our anecdotal evidence a high number very well could – government finances will suffer considerably because they contribute a disproportionately large amount to the state’s coffers.”
Mr Green adds: “It would also likely deter top international talent and investors from coming to the UK too, which would negatively impact long-term, sustainable economic growth prospects.”
The deVere CEO concludes: “If Mr Corbyn is serious about having the better-off pay more tax, they should cut rates further and allow them to become wealthier.
“This would incentivise top achievers, who prop-up ‘The System’, to remain in the UK. However, I suspect that implementing this economically-sound philosophy would be political suicide for Jeremy Corbyn.”
About:
deVere Group is one of the world’s largest independent advisors of specialist global financial solutions to international, local mass affluent, and high-net-worth clients. It has a network of more than 70 offices across the world, over 80,000 clients and $12bn under advisement
 Current situation: