Early in another November week, the oil market is going down againб but it is evident that investors just can’t decide on a more promising direction on a global scale. Currently, Brent is trading at 61.81 USD.
The statistics published by Baker Hughes last Friday showed that the Oil Rig Count in the USA reached the lowest level over the previous 31 months: the indicator lost 8 units and now equals to 684. The total number of rigs lost 7 units, down to 817 overall. As a result, the actual reading is close to April of 2017. Since the beginning of 2019, the indicator has dropped 23%, but without influencing the total oil extraction as it has added 8% over the same period.
The latest numbers showed that the daily oil output in the USA stopped at 12.6M. The EIA Crude Oil Stocks Change is increasing (+8M barrels over a week by November 8th).
All fine and dandy, and the reason for oil stocks growth can be easily explained by seasonality, but market players are anxious as they continue following the trade conflict between the USA and China. Earlier, US President Donald Trump said that he wasn’t ready yet to consider the possibility of completely removing import tariffs on Chinese goods introduced in the past.
As we can see in the H4 chart, Brent is forming the fifth structure of Flag correctional pattern. Today, the pair may fall to break 61.83 and then continue trading downwards with the target at 60.60 to complete the correction. After that, the instrument may form a reversal pattern for one more ascending structure towards 64.40. However, the “correction” scenario may no longer be valid if the price grows to break 63.00. in this case, the market may resume trading inside the uptrend to reach 64.40б at least. From the technical point of view, this scenario is confirmed by MACD Oscillator: its signal line is moving downwards to reach 0. Breaking it may boost the downtrend.
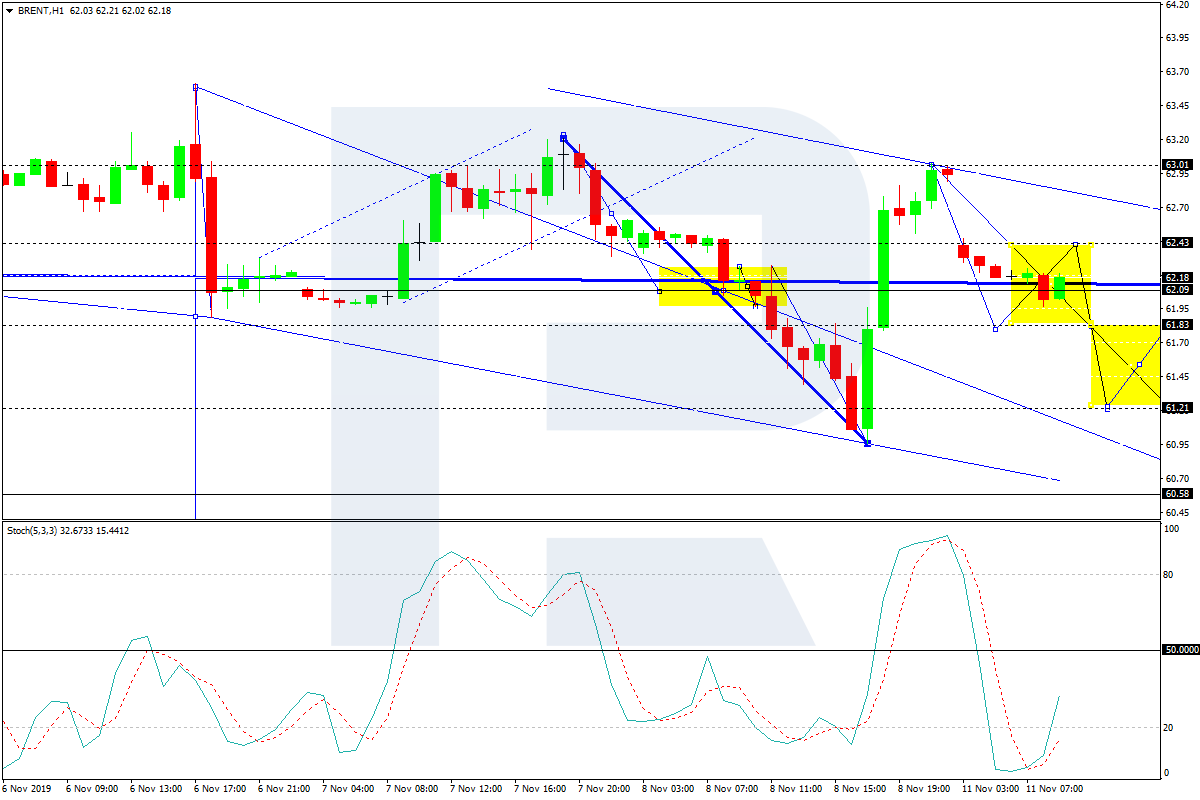
In the H1 chart, Brent is consolidating around 62.10. Possibly, today the pair may form a new descending structure towards 61.83 and then start another growth to reach 62.43. After that, the instrument may fall to reach 61.21, thus forming a wider consolidation range between 62.43 and 61.21. If later the pair breaks this range to the downside, the instrument may continue falling towards 60.60; if to the upside – cancel the correction. From the technical point of view, this scenario is confirmed by Stochastic Oscillator: its signal line is moving below 50. Practically, the indicator suggests that the instrument is moving in the middle of the fifth correctional structure. The indicator is expected to start another decline to enter the “oversold area” below 20.
Disclaimer
Any predictions contained herein are based on the authors’ particular opinion. This analysis shall not be treated as trading advice. RoboForex shall not be held liable for the results of the trades arising from relying upon trading recommendations and reviews contained herein.
Last week, the USD has grown significantly against its main competitors. The drop of EUR/USD quotes exceeded 150 points. At the moment, the trading instrument has stabilized. The local support and resistance levels are 1.10150 and 1.10400, respectively. Concerns over the conclusion of a trade deal between the US and China have resumed. On Friday, US President Donald Trump said he did not agree to abolish duties on Chinese imports. We recommend that you keep track of current information on this issue. In the near future, technical correction of the EUR/USD currency pair is not ruled out. Open positions from key levels.
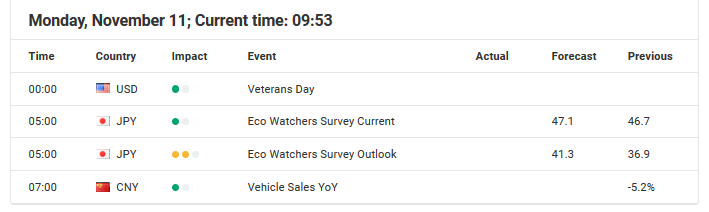
The Economic News Feed for 11.11.2019 is calm.
Indicators signal the power of sellers: the price has fixed below 50 MA and 100 MA.
The MACD histogram is in the negative zone, but above the signal line, which gives a weak signal to sell EUR/USD.
The Stochastic Oscillator is in the overbought zone, the %K line crossed the %D line. There are no signals at the moment.
Trading recommendations
Support levels: 1.10150, 1.10000, 1.09600
Resistance levels: 1.10400, 1.10600, 1.10900
If the price consolidates below 1.10150, expect the quotes to fall toward 1.09800-1.09700.
Alternatively, the quotes could correct toward 1.10600-1.10800.
The GBP/USD currency pair
Technical indicators of the currency pair:
Prev Open: 1.28130
Open: 1.27937
% chg. over the last day: -0.33
Day’s range: 1.27841 – 1.28096
52 wk range: 1.1959 – 1.3385
The GBP/USD currency pair stabilized after a significant drop last week. At the moment, a unidirectional trend is not observed. Investors expect additional drivers. The key support and resistance levels are: 1.27700 and 1.28200, respectively. We recommend keeping track of up-to-date information regarding the Brexit process. This week a series of important statistics on the UK economy will be published, which may have a significant impact on the dynamics of the pound. Positions must be opened from key levels.
The Economic News Feed for 11.11.2019:
– GDP Report (UK) – 11:30 (GMT+2:00);
– Manufacturing Production Volume (UK) – 11:30 (GMT+2:00);
Indicators do not give accurate signals. The price approached 50 MA, which at the moment is a strong dynamic resistance.
The MACD histogram is in the negative zone, but above the signal line, which gives a weak signal to sell GBP/USD.
The Stochastic Oscillator is located near the overbought zone, the %K line is above the %D line, which indicates bullish sentiment.
Trading recommendations
Support levels: 1.27700, 1.27500
Resistance levels: 1.28200, 1.28600, 1.28900
If the price consolidates below 1.27700, expect a further drop toward 1.27500-1.27300.
Alternatively, the quotes could grow toward 1.28500-1.28700
The USD/CAD currency pair
Technical indicators of the currency pair:
Prev Open: 1.31734
Open: 1.32184
% chg. over the last day: +0.44
Day’s range: 1.32181 – 1.32343
52 wk range: 1.2727 – 1.3664
A bullish sentiment prevails on the USD/CAD currency pair. The trading instrument has set new local highs. Looney is currently consolidating. Investors expect additional drivers. The local support and resistance levels are 1.32100 and 1.32350, respectively. USD/CAD can grow further. Pay attention to the dynamics of oil quotes. Open positions from key levels.
The Economic News Feed for 11.11.2019 is calm.
The price fixed above 50 MA and 100 MA, which signals the strength of buyers.
The MACD histogram is in the positive zone but below the signal line, which gives a weak signal to buy USD/CAD.
The Stochastic Oscillator is in the neutral zone, the %K line is below the %D line, which points to a bearish sentiment.
Trading recommendations
Support levels: 1.32100, 1.31900, 1.31600
Resistance levels: 1.32350, 1.32600, 1.32800
If the price consolidates above 1.32350, expect further growth toward 1.32600-1.32800.
Alternatively, the quotes could descend toward 1.31900-1.31600.
The USD/JPY currency pair
Technical indicators of the currency pair:
Prev Open: 109.277
Open: 109.195
% chg. over the last day: -0.03
Day’s range: 108.915 – 109.254
52 wk range: 104.97 – 114.56
The USD/JPY currency pair went down. The trading tool has updated local lows. Uncertainty regarding the settlement of the trade conflict between Washington and Beijing has resumed again, which has caused an increase in demand for the safe haven currencies. At the moment, USD / JPY quotes are consolidating in the range of 108.850-109.150. The yen has the potential for further growth against the US dollar. We recommend paying attention to the dynamics of oil quotes. Positions must be opened from key levels.
The Economic News Feed for 11.11.2019 is calm.
Indicators do not give accurate signals, the price crossed 50 MA and 100 MA.
The MACD histogram has moved into the negative zone, which points to a bearish sentiment.
The Stochastic Oscillator is in the oversold zone, the %K line crossed the %D line. There are no signals at the moment.
Trading recommendations
Support levels: 108.850, 108.650, 108.500
Resistance levels: 109.150, 109.450, 109.700
If the price consolidates below 108.850, expect the quotes to fall toward 108.650-108.500.
Alternatively, the quotes could grow toward 109.400-109.600.
After bullish performance over the last week of trading, there seems to be a higher chance of a slow start into the new week.
Due to the “Veterans Day” bank holiday in the US, the US Fixed Income Markets will not be open for regular trading hours, indicating that trading volume will be lower than on average. That’s noteworthy because of the fact that yields have been a principal driver of price action in the last days, and with no impulses to be expected from this end, volatility should stay low.
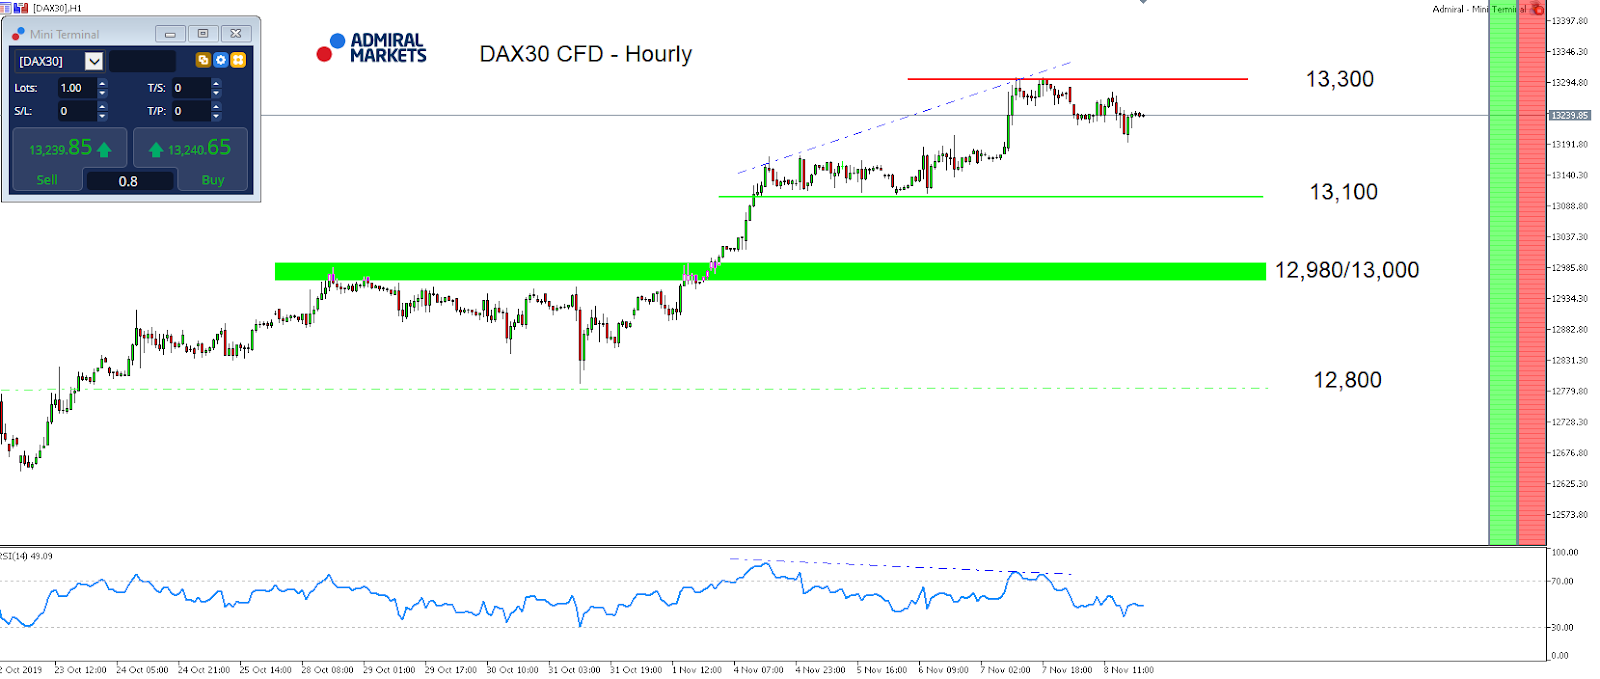
From a technical perspective, the picture in the DAX30 CFD on H1 stays bullish and the Long sequence stays intact as long as the German index trades above 13,100 points. Only a break lower would darken the technical picture from a short-term perspective, activating the region around 12,970/13,000 points as a first target.
On the upside, the region around 13,300 points stays in focus: a break higher could initiate a Short-squeeze to around 13,500 points in the days to come. One main driver here could be the small expiration in DAX options next Friday. Data from EUREX shows an elevated Open Interest of Short Calls around 13,300 points and then around 13,500 points, meaning that a break above 13,300 could trigger a wave of market participants being in a need to hedge their Short exposure by buying the DAX:
Source: Admiral Markets MT5 with MT5-SE Add-on DAX30 CFD Hourly chart (between October 22, 2019, to November 8, 2019). Accessed: November 8, 2019, at 10:00pm GMT
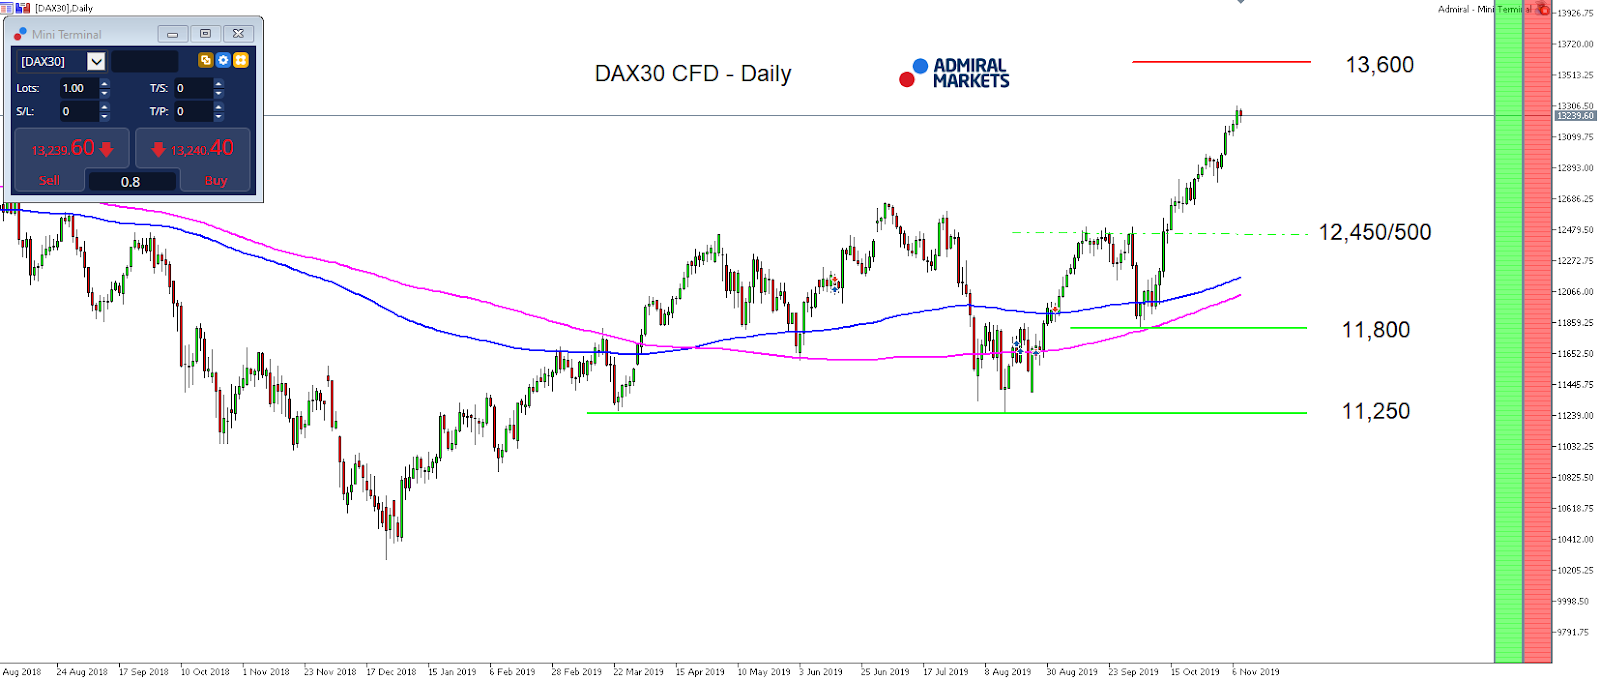
Source: Admiral Markets MT5 with MT5-SE Add-on DAX30 CFD Daily chart (between August 2, 2018, to November 8, 2019). Accessed: November 8, 2019, at 10:00pm GMT – Please note: Past performance is not a reliable indicator of future results, or future performance.
In 2014, the value of the DAX30 CFD increased by 2.65%, in 2015, it increased by 9.56%, in 2016, it increased by 6.87%, in 2017, it increased by 12.51%, in 2018, it fell by 18.26%, meaning that after five years, it was up by 10.5%.
Discover the world’s #1 multi-asset platform
Admiral Markets offers professional traders the ability to trade with a custom, upgraded version of MetaTrader 5, allowing you to experience trading at a significantly higher, more rewarding level. Experience benefits such as the addition of the Market Heat Map, so you can compare various currency pairs to see which ones might be lucrative investments, access real-time trading data, and so much more. Click the banner below to start your FREE download of MT5 Supreme Edition!
Disclaimer: The given data provides additional information regarding all analysis, estimates, prognosis, forecasts or other similar assessments or information (hereinafter “Analysis”) published on the website of Admiral Markets. Before making any investment decisions please pay close attention to the following:
This is a marketing communication. The analysis is published for informative purposes only and are in no way to be construed as investment advice or recommendation. It has not been prepared in accordance with legal requirements designed to promote the independence of investment research, and that it is not subject to any prohibition on dealing ahead of the dissemination of investment research.
Any investment decision is made by each client alone whereas Admiral Markets shall not be responsible for any loss or damage arising from any such decision, whether or not based on the Analysis.
Each of the Analysis is prepared by an independent analyst (Jens Klatt, Professional Trader and Analyst, hereinafter “Author”) based on the Author’s personal estimations.
To ensure that the interests of the clients would be protected and objectivity of the Analysis would not be damaged Admiral Markets has established relevant internal procedures for prevention and management of conflicts of interest.
Whilst every reasonable effort is taken to ensure that all sources of the Analysis are reliable and that all information is presented, as much as possible, in an understandable, timely, precise and complete manner, Admiral Markets does not guarantee the accuracy or completeness of any information contained within the Analysis. The presented figures refer that refer to any past performance is not a reliable indicator of future results.
The contents of the Analysis should not be construed as an express or implied promise, guarantee or implication by Admiral Markets that the client shall profit from the strategies therein or that losses in connection therewith may or shall be limited.
Any kind of previous or modeled performance of financial instruments indicated within the Publication should not be construed as an express or implied promise, guarantee or implication by Admiral Markets for any future performance. The value of the financial instrument may both increase and decrease and the preservation of the asset value is not guaranteed.
The projections included in the Analysis may be subject to additional fees, taxes or other charges, depending on the subject of the Publication. The price list applicable to the services provided by Admiral Markets is publicly available from the website of Admiral Markets.
Leveraged products (including contracts for difference) are speculative in nature and may result in losses or profit. Before you start trading, you should make sure that you understand all the risks.
On Friday the 8th of November, trading on the EURUSD pair closed at 1.1018. The drop, which started at the beginning of the European session, was mostly triggered by technical factors. It gathered pace on the back of increased demand for safe haven assets in response to mixed reports on the US-China trade deal.
The Chinese Ministry of Trade said on Thursday that Beijing and Washington had agreed to gradually cancel previously imposed tariffs, although they did not specify a timetable.
US President Donald Trump said that he doesn’t want to completely cancel the tariffs, and so he hasn’t yet made a decision about cancelling trade tariffs on Chinese goods. Traders are already accustomed to the fact that contradictory statements from Trump are to be expected. There are trading robots whose algorithms follow Trump’s Twitter account, which bring in big money.
Day’s news (GMT+3):
12:30 UK: GDP (Q3), manufacturing production (Sep).
15:00 UK: NIESR GDP estimate (Nov).
Current situation:
On Friday, we made a forecast for the next two trading days with a target of 1.1017 (135 degrees). The bears reached their target for the first day with the pair’s drop coming to an end at 1.1017.
Today, Veterans’ Day is being celebrated in the US. Many exchanges are closed, so with low liquidity on the market today, we could see the pair head north against Friday’s movements. At the time of writing, the euro is trading at 1.1026. Today’s forecast is looking back upwards with a target of 1.1060. There’s an intermediate resistance at 1.1037.
Make no mistake: Oil and gas companies may be doing some serious cost-cutting and slimming-and-trimming to stay competitive after the shale boom binge, but when it comes to employment, it’s still one of the best industries to hit up for a job.
Jobs are booming, just as much as U.S. oil and gas production is.
US oil production has increased from 11.7 million bpd at the start of 2019 to 12.6 million by the end of October, according to the Energy Information Administration (EIA). Natural gas production has risen as well, to 99.1 Bcf/d at the end of October—95 Bcf/d of which is from dry natural gas—up from 91.3 Bcf/d this time last year for total US natural gas production.
Those gains have translated into more oil and gas industry jobs.
US Oil and Gas Employment
The United States Traditional Energy and Energy Efficiency Sectors in 2018 employed 6.7 million Americans in 2018, according to the US Energy and Employment Report 2019, with nearly 1.5 million directly employed by the oil and gas industry, and another 1.2 million workers employed by the power generation sector, which includes all types of power generation, including oil and gas.
Employment in the oil and gas extraction and support services, specifically, was at its highest level in 2018 since the fall of 2014—the next most recent high.
And those jobs? None too shabby if you’re interested.
America’s energy independence push has resulted in a new high for US oil and gas workers. In fact, the energy and utility sectors have the highest median salary of any industry in the S&P 500.
Who’s Who in Energy
If you’re looking to make some cash in the oil and gas industry, you won’t have to look far. The oil industry is having a heck of a time recruiting a skilled workforce, and ExxonMobil, Phillips66, and Anadarko—all Texas based—have been more than willing to pony up the cash.
ExxonMobil’s median pay, according to a Wall Street Journal analysis, came in at $171,375. Phillips66’s median pay was $196,407, according to a Wall Street Journal survey.
Compared to America’s overall median wage for advanced degree holders of $77,324, that’s downright generous. But what oil and gas jobs are the best?
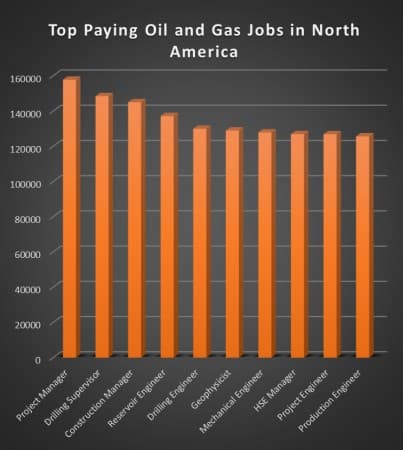
Top Paying Oil and Gas Jobs
Pay isn’t everything, but it sure is something. And if you can’t woo employees with good corporate citizenship or your climate friendliness, you had better pony up the cash. So what jobs are oil and gas companies sinking the most money into in its quest to acquire good talent?
The list of annual salaries below, developed from the Global Talent Energy Index, is based on employees with six years of experience in the oil and gas industry:
#10 Production Engineer $125,600. Production engineers mostly carry petroleum engineering degrees and are responsible for designing and selection well equipment to get it to the production stage post-drilling. They also monitor the well while it is flowing to make sure the well is efficient and still commercially viable.
#9 Project Engineer $126,846. Project Engineers ensure that the design, construction and major maintenance projects are safely completed, and completed within budget. They review progress reports and proposed construction changes, as well as monitoring and communication project progress to stakeholders.
#8 HSE Manager $126,874. Health, Safety, and Environmental managers develop and implement organizational safety programs. They review and keep updated HSE policies, as well as conduct risk assessments and create precautionary measures. Requirements include a BA in occupational health, safety management or environmental science.
#7 Mechanical Engineer $127,828. Mechanical engineers support plant equipment, and design, develop, install, and maintain equipment that is used for processing oil and gas, with a focus on safety, reliability, quality, and sustainability.
#6 Geophysicist $128,965. A geophysicist studies the physical aspects of the earth in order to determine what lies beneath the surface of the earth.
#5 Drilling Engineer $129,944. This position manages rig staff and is responsible for assessing and maintaining wells, ensuring safety measures are implementing, and is generally responsible for the financial and technical operations of drilling for oil or gas.
#4 Reservoir Engineer $137,156. Reservoir Engineers draw on geology and fluid mechanics knowledge to find petroleum in underground reservoirs. They also assess the amount of petroleum reserves underground. Typically they have a degree in petroleum engineering.
#3 Construction Manager $145,000. CMs are responsible for delivering construction in compliance with HSE requirements and the schedule. They work closely with the project manager in leading teams to manage and control construction projects.
#2 Drilling Supervisor $148,476. Drilling supervisors are in charge of the drill operations and make sure drilling is completed on time. Unlike most of the other top jobs in the oil and gas industry, drilling supervisors often do not need a bachelor’s degree. However, years of experience are usually required. Some employers prefer degrees in drilling technology or mechanical engineering.
#1 Project Manager $157,795. The top paying job in the oil and gas industry is the Project Manager, and it’s no wonder. The PM is tasked with ensuring that an entire project from start to finish is on track, in budget, to specifications, and within safety guidelines. The PM also ensures that communication is flowing between groups. Essentially, the PM is the glue that holds an entire operation together—and companies are willing to pay for the best.
Top Paying Petrochemicals Jobs
The petrochemicals industry doesn’t get as much love as the oil and gas industry, but it is said to be the oil and gas industry’s future. Like the traditional oil and gas industry, petrochemicals are a booming business, although the salaries are not quite as high.
The top paying job in petrochemicals is that of the Process Engineer, which pays on average for a six-year veteran $123,400 per year. Quality Assurance Manager comes in at #2, which pays $122,190 per year. Other top jobs in the petrochemicals sector are Construction Manager (#3) at $117,856 per year, Mechanical Engineer (#4) at $111,630, and Chemical Engineer (#5) $98,636.
Top Paying Jobs in Renewables Sector
The renewables sector has something the other energy-related jobs don’t: they are appealing to the millennial generation. And as such, they tend to have an easier time with talent acquisition of doe-eyed job seekers looking to be excellent citizens.
And it’s good that they feel good about their jobs, because on average, they’re going to make less money.
The top paying job in the renewables sector is Construction Manager, at $118,730. The number two slot is held by the HSE Manager at $102,997, followed by Mechanical Engineer at $92,822.
Top Paying Jobs in the Nuclear Sector
We hear a lot about oil and gas here in the United States, but the US is also the world’s largest producer of nuclear power, according to the World Nuclear Association, producing more than 30% of the world’s total nuclear generation of electricity.
About 20% of the United States’ total electrical output comes from nuclear power, and despite a near 30-year slump for new builds, two new nuclear facilities are now in the works. In total, the US has 98 functioning nuclear power reactors spread across 30 states.
But the nuclear sector may find it difficult to attract new talent. The reputation the segment has, the technical nature of the work required, and the fact that the skills needed are specific to just nuclear are all working against the industry.
But there are great opportunities here, with the current nuclear workforce over the age of 55 representing a third of all workers in this sector, leaving the door open for the next generation—if they are interested.
So how do jobs in this segment measure up? Somewhere near the bottom of the pile, it would seem, but salaries are on the rise.
The top paying job in the nuclear sector is that of the Construction Manager at $118,565. Coming in second is the Nuclear Engineer, at $108,250 per year, with Electric Engineer in fourth place at $103,160.
Going forward, IHS predicts that by 2025, just the unconventional oil and natural gas value chain and energy-related chemicals activity will support 3.9 million jobs.
The United States accounted for 98% of all global oil production growth in 2018, and the EIA is expecting crude oil production in the US to reach 13.2 million barrels per day next year. Add to that the fact that the US is expected to retain its spot as the number one oil consumer of the world, US job growth for the oil and gas sector is expected to see more gains going forward.
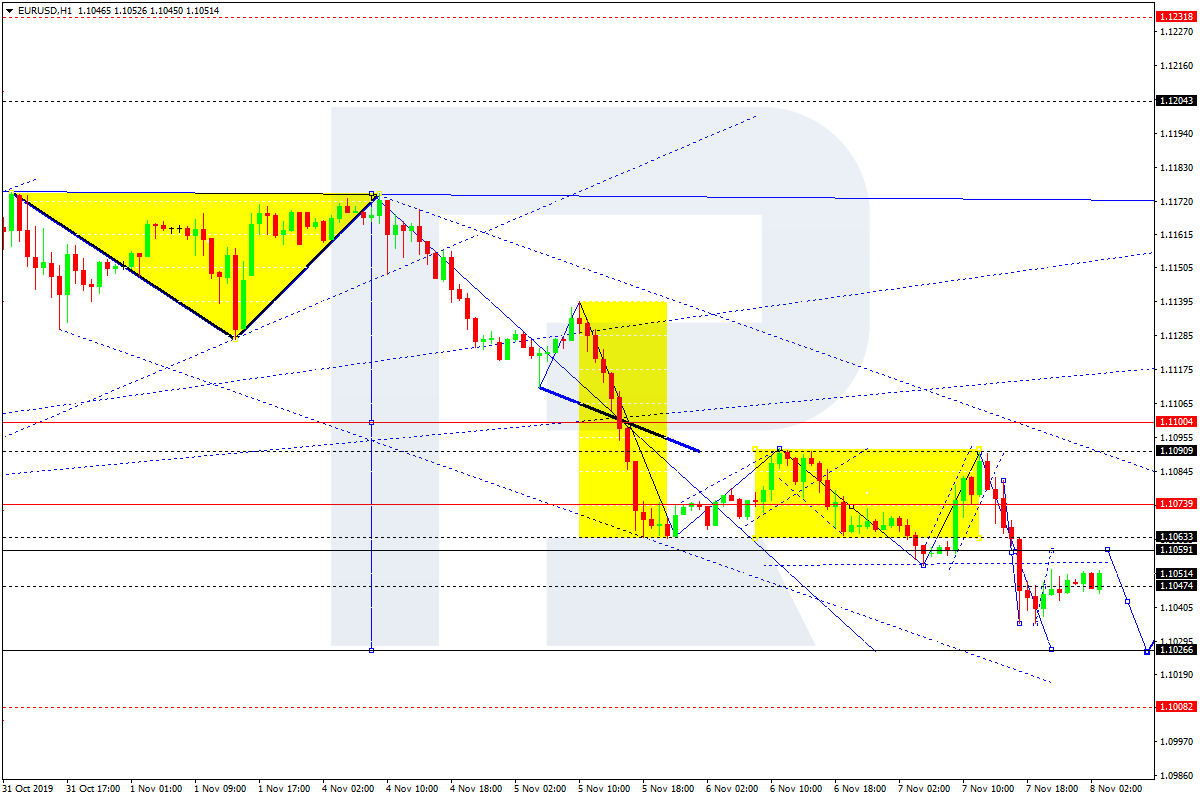
After breaking 1.1060, EURUSD has reached the short-term downside target at 1.1036. Today, the pair may grow to return to 1.1060 and then resume falling to reach 1.1027. After that, the instrument may start a new correction with the target at 1.1077.
GBPUSD, “Great Britain Pound vs US Dollar”
GBPUSD has reached 1.2800. Possibly, today the pair may resume trading upwards with the target at 1.2850. Later, the market may form a new descending structure towards 1.2765.
USDCHF, “US Dollar vs Swiss Franc”
USDCHF has expanded the consolidation range towards 0.9974; right now, it is falling to reach 0.9938. After that, the instrument may start another growth with the target at 0.9980.
USDJPY, “US Dollar vs Japanese Yen”
USDJPY has finished another ascending structure towards 109.47, thus forming Divergent Triangle pattern; right now, it is falling to reach 109.10. Alter, the market may form one more ascending structure towards 109.58 and then trade downwards with the target at 107.04.
AUDUSD, “Australian Dollar vs US Dollar”
AUDUSD is moving downwards to reach 0.6844. After that, the instrument may start a new growth with the target at 0.6898.
USDRUB, “US Dollar vs Russian Ruble”
USDRUB is falling towards 63.50; right now, it is forming Triangle pattern near the lows. If later the pair breaks this pattern to the upside, the instrument may continue the correction towards 64.64; if to the downside – resume trading inside the downtrend with the target at 62.00.
USDCAD, “US Dollar vs Canadian Dollar”
USDCAD is moving upwards. Possibly, the pair may reach 1.3197 and then start another decline to break 1.3155. After that, the instrument may continue trading downwards with the target at 1.3104.
XAUUSD, “Gold vs US Dollar”
After breaking 1481.00, Gold has completed the correction at 1464.50. Today, the pair may trade upwards to reach 1479.00 and then continue the correction with the target at 1447.40.
BRENT
After completing the descending impulse and then the correction at 63.22, Brent has broken the correctional channel; right now, it is consolidating around 62.50. Possibly, today the pair may fall towards 61.95. If later the price breaks this level, the market may continue trading downwards with the short-term target at 60.70.
BTCUSD, “Bitcoin vs US Dollar”
After reaching 9070.00, BTCUSD is growing towards the first target at 9325.00. In fact, the market is expected to start a new ascending structure to reach 9600.00.
Attention! Forecasts presented in this section only reflect the author’s private opinion and should not be considered as guidance for trading. RoboForex LP bears no responsibility for trading results based on trading recommendations described in these analytical reviews.
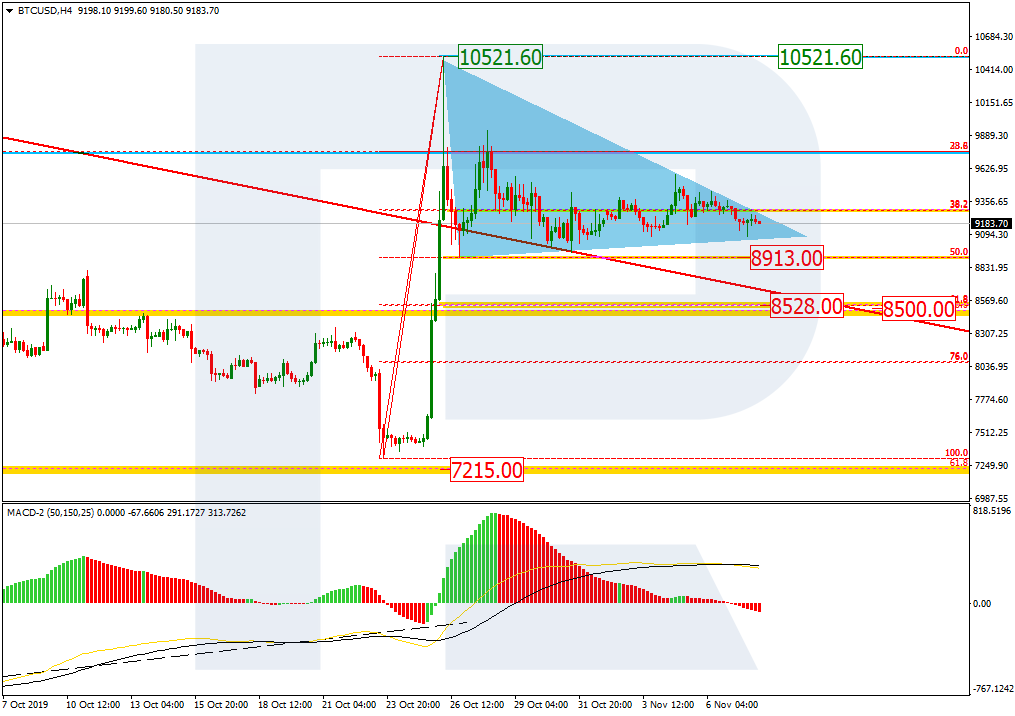
As we can see in the daily chart, BTCUSD is still correcting in the form of Triangle pattern. The previous impulse itself is the first part of the mid-term correction that started after the convergence. By now, the impulse has already reached 38.2% fibo. Later, the market may complete the current correction and resume growing towards the high at 10521.60, and 50.0% and 61.8% fibo at 10578.00 and 11345.00 respectively.
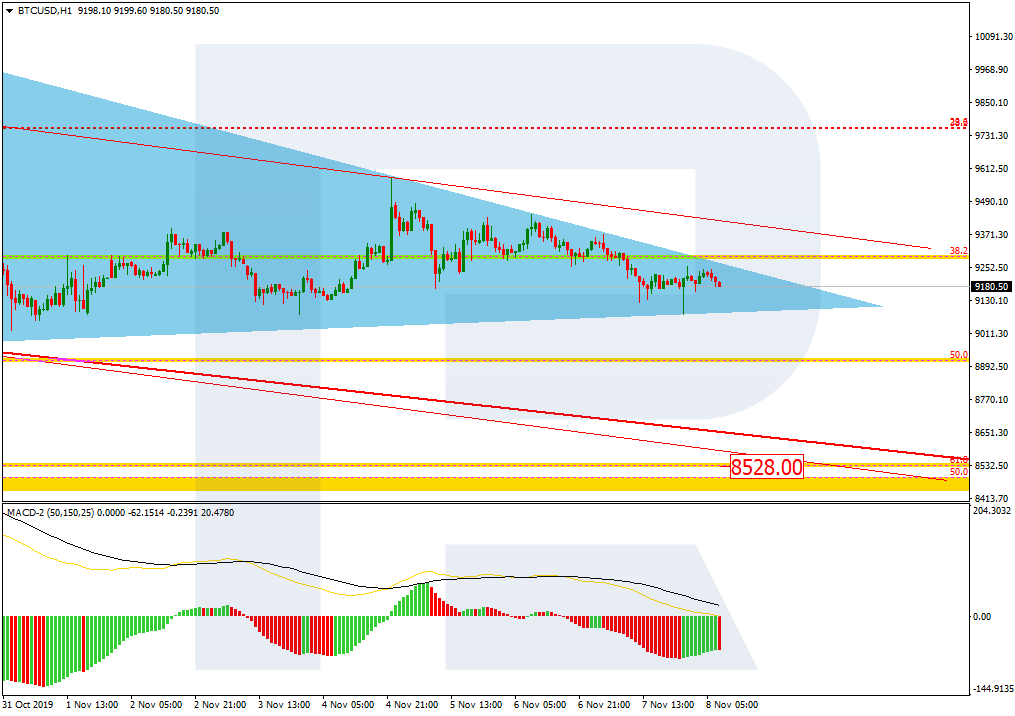
In the H1 chart, the current correction Triangle pattern is a descending one, which means that the decline may yet continue. By now, the pair has already reached 50.0% fibo. The next downside target may be 61.8% fibo at 8532.00. The resistance is the high at 10521.60.
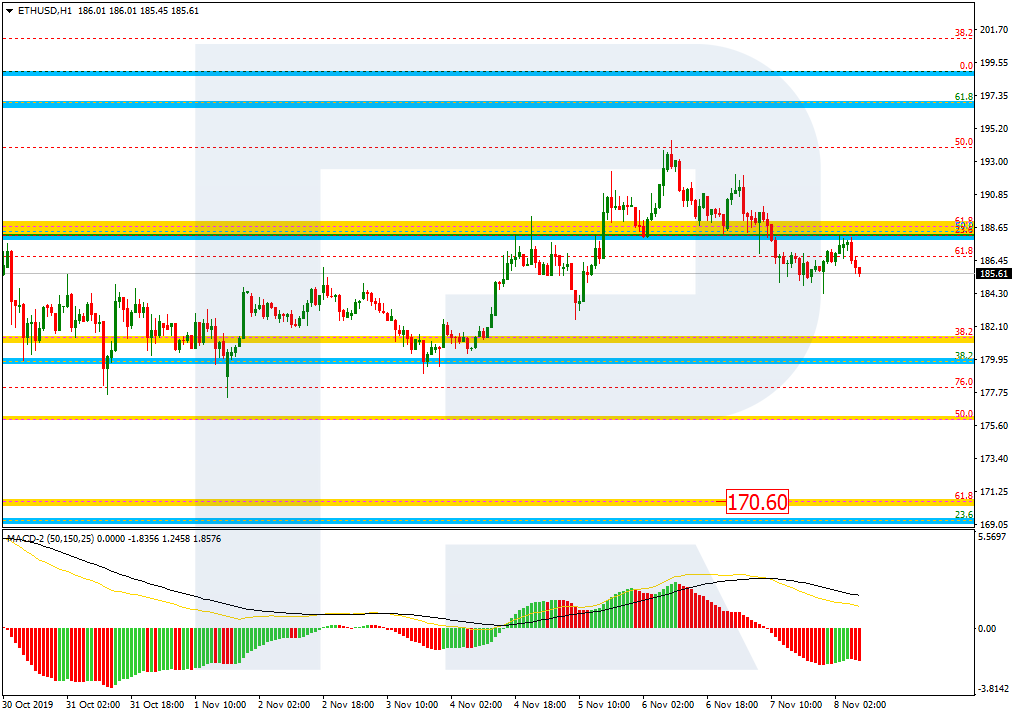
ETHUSD, “Ethereum vs. US Dollar”
As we can see in the H4 chart, after reaching 50.0% fibo, ETHUSD is correcting upwards. If the price breaks the high at 198.94, the mid-term correction may continue towards 76.0% fibo at 207.04. However, if the price fails, the instrument may start a new descending wave towards 61.8% and 76.0% fibo at 170.60 and 164.00 respectively.
In the H1 chart, the instrument is forming a new short-term descending wave with the closest target at 61.8% fibo at 170.60.
Attention! Forecasts presented in this section only reflect the author’s private opinion and should not be considered as guidance for trading. RoboForex LP bears no responsibility for trading results based on trading recommendations described in these analytical reviews.
Bearish sentiment still prevails at the EUR/USD currency pair. The trading tool again updated local lows. The demand for USD remains at a high level due to the prospects for resolving the trade conflict between Washington and Beijing. The parties agreed to phase out the previously introduced duties. The European Commission has worsened the forecast for GDP growth in the eurozone from 1.2% to 1.1% this year. At the moment, EUR/USD quotes are consolidating in the range of 1.10350-1.10600. We do not exclude a further decline in the single currency. We recommend opening positions from key levels.
The Economic News Feed for 08.11.2019:
– Consumer Expectation and Sentiment Indices by University of Michigan (EU) – 17:00 (GMT+2:00);
Indicators signal the power of sellers: the price has fixed below 50 MA and 100 MA.
The MACD histogram is in the negative zone and below the signal line, which gives a strong signal to sell EUR / USD.
The Stochastic Oscillator is in the neutral zone, the %K line is above the %D line, which indicates bullish sentiment.
Trading recommendations
Support levels: 1.10550, 1.10250, 1.10000
Resistance levels: 1.10750, 1.10900, 1.11200
If the price consolidates below the level of 1.10550, expect the quotes to fall toward 1.10200-1.10000.
Alternatively, the quotes could rise toward 1.11000-1.11200.
The GBP/USD currency pair
Technical indicators of the currency pair:
Prev Open: 1.28528
Open: 1.28130
% chg. over the last day: -0.25
Day’s range: 1.28045 – 1.28224
52 wk range: 1.1959 – 1.3385
GBP/USD quotes continue to show a negative trend. The GBP hit 1.28 USD. The Bank of England, as expected, kept its key interest rate unchanged at 0.75%. At the same time, two members of the monetary policy committee voted to reduce it. At the moment, the GBP/USD currency pair is consolidating in the range of 1.28000-1.28350. The trading instrument has the potential to further decline. We recommend opening positions from key levels.
Today, the news background on the UK economy is calm.
The price fixed below 50 MA and 100 MA, which signals the power of sellers.
The MACD histogram is in the negative zone but above the signal line, which gives a weak signal to sell GBP/USD.
The Stochastic Oscillator is in the neutral zone, the% K line crossed the% D line. There are no signals at the moment.
Trading recommendations
Support levels: 1.28000, 1.27600
Resistance levels: 1.28350, 1.28600, 1.28900
If the price consolidates below the round level of 1.28000, expect a further descend toward 1.27700-1.27500.
Alternatively, the quotes could grow toward 1.28500-1.28700.
The USD/CAD currency pair
Technical indicators of the currency pair:
Prev Open: 1.31822
Open: 1.31734
% chg. over the last day: -0.04
Day’s range: 1.31716 – 1.31914
52 wk range: 1.2727 – 1.3664
An ambiguous technical pattern has developed on the USD/CAD currency pair. CAD is trading in a flat. Investors expect additional drivers. At the moment, the key support and resistance levels are 1.31600 and 1.32000, respectively. USD/CAD has prospects for growth. Today, financial market participants will evaluate important economic data from Canada. We also recommend paying attention to the dynamics of oil quotes. Open positions from key levels.
The Economic News Feed for 08.11.2019 is calm.
– Real Estate Market Report (CAD) – 15:30 (GMT+2:00);
– Labour Market Report (CAD) – 15:30 (GMT+2:00);
The price fixed above 50 MA and 100 MA, which signals the power of buyers.
The MACD histogram is in the positive zone, which gives a signal to buy USD/CAD.
The Stochastic Oscillator is in the overbought zone, the %K line crossed the %D line, which indicates a bearish sentiment.
Trading recommendations
Support levels: 1.31600, 1.31400, 1.31150
Resistance levels: 1.32000, 1.32300, 1.32500
If the price consolidates above 1.32000, expect the quotes to grow toward 1.32300-1.32500.
Alternatively, the quotes could decrease toward 1.31400-1.31200.
The USD/JPY currency pair
Technical indicators of the currency pair:
Prev Open: 108.962
Open: 109.277
% chg. over the last day: +0.28
Day’s range: 109.148 – 109.408
52 wk range: 104.97 – 114.56
Purchases prevail on USD/JPY currency pair. The trading instrument reached semi-annual highs. Demand for safe haven currencies remains at a rather low level against the backdrop of the prospects for resolving the trade conflict between the US and China. At the moment, USD/JPY quotes are consolidating. The local support and resistance levels are 109.150 and 109.500, respectively. We do not exclude further growth of the USD/JPY currency pair. Open positions from key levels.
During the Asian trading session Japan published a positive report on household spending
Indicators signal a bullish mood: the price has fixed above 50 MA and 100 MA.
The MACD histogram is in the positive zone, but below the signal line, which gives a weak signal to buy USD/JPY.
The Stochastic Oscillator is in the neutral zone, the %K line is above the %D line, which indicates bullish sentiment.
Trading recommendations
Support levels: 109.150, 108.850, 108.650
Resistance levels: 109.500, 109.800, 110.000
If the price consolidates above 109.500, expect further growth to 109.750-110.000.
Alternatively, the quotes could fall toward 108.900-108.700.
China wants Trump re-elected in 2020 to achieve medium-term and long-term economic objectives, affirms the CEO of one of the world’s largest independent financial advisory organizations.
The comments from Nigel Green, chief executive of deVere Group, come after China fuelled hopes that a deal can be reached to end its trade war with the U.S. after agreeing with Washington to roll back on some tariffs.
The deal to reduce trade tensions could encourage the International Monetary Fund (IMF) to revise up global growth forecasts next year.
Mr Green notes: “There has been an argument that in regard to the trade war, China was holding out, playing the long game and waiting for President Trump to leave office, before dealing with another administration.
“Whilst this argument might have held water before, I now believe this is not the case – and it is what is fueling recent developments in the trade war negotiations.”
He continues: “It is likely that China is currently fueling hopes to reach a phased agreement in the trade dispute with the U.S. and cancel tariffs as soon as possible because it will help President Trump’s re-election.
“His re-election would suit them for two major reasons.
“First, because they will assume that reaching a deal with Trump to end the damaging trade war will probably be easier than with some others. These include Elizabeth Warren, the potential Democratic rival, who could, say many supporters, win next year’s presidential election.
“Ms Warren can be expected to be even tougher with China than Trump, and not only on trade, but on other difficult issues, including climate change and human and labor rights.
“And second, despite the trade war, Trump’s policies and rhetoric have proven to be strategically helpful to China in achieving its longer-term goals.
“In many respects, President Trump has undermined Washington’s global credibility, international governance bodies and key alliances, and has been indifferent if not antagonistic towards major trading agreements.
“This all compromises America’s standing as the world’s primary superpower and it provides China with openings and opportunities it has previously never had in terms of global influence and setting international trade conventions.”
The deVere CEO concludes: “The positive signs coming from Beijing and Washington on the trade talks between the world’s two largest economies have been welcomed by stock markets – some reaching all-time highs this week.
“Investors’ exuberance will grow further still should the deal be cemented, and also should Trump be re-elected.
“However, U.S. investors should perhaps also question whether Mr Trump’s administration has, in fact, handed China a great strategic opportunity that could damage America’s preeminent superpower status in the longer-term and, therefore, its economic dominance.”
About:
deVere Group is one of the world’s largest independent advisors of specialist global financial solutions to international, local mass affluent, and high-net-worth clients. It has a network of more than 70 offices across the world, over 80,000 clients and $12bn under advisement
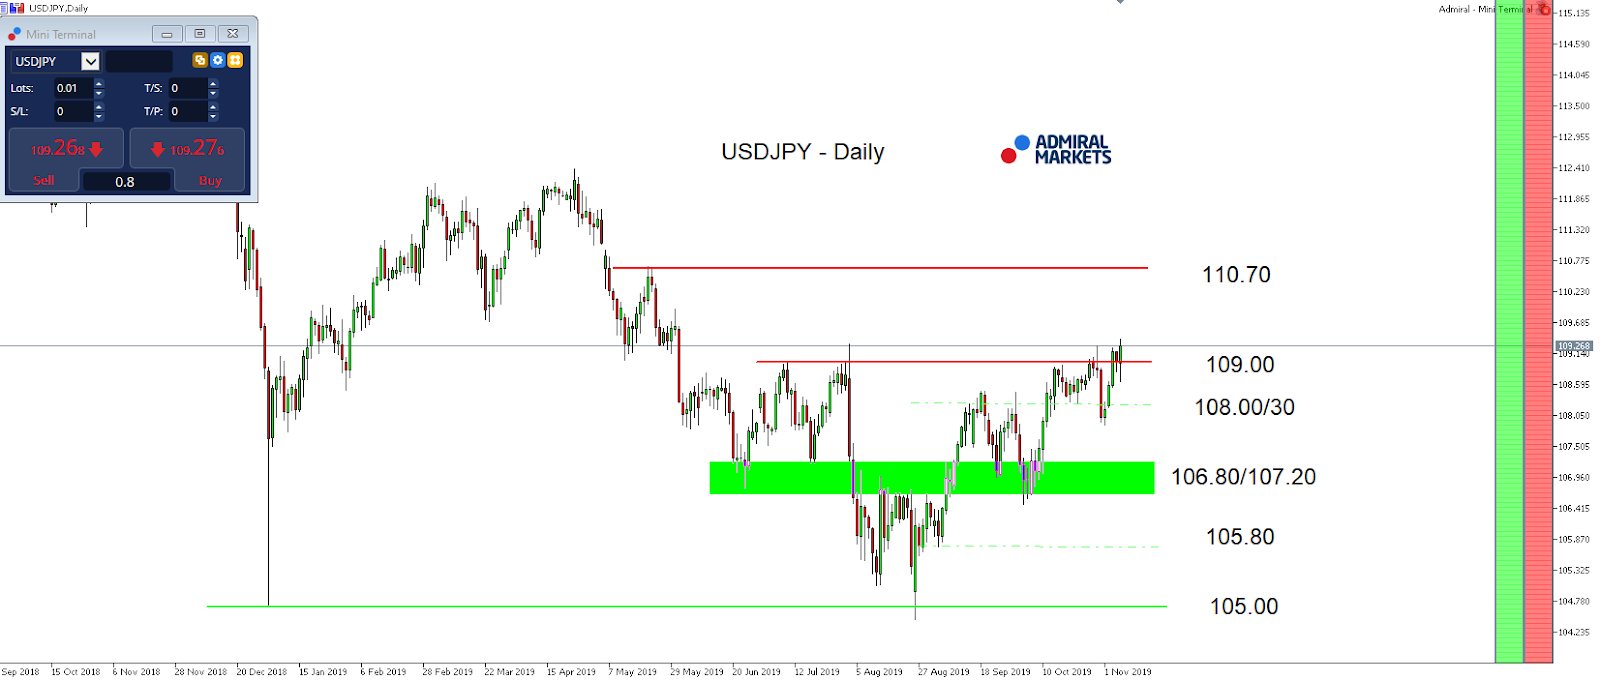
Into the weekly close, we want to have a look at USDJPY again. A potential trigger for volatility in the currency pair could be delivered by the Michigan Consumer Sentiment being publish today.
The data set is expected to continue the positive development of the last two months after the big disappointment in July with data coming in at the lowest level since 2016.
But what’s probably of higher importance is the development around 10-year US yields over the past days, which drove the currency pair back towards 109.00.
10-year US Treasury yields took on bullish momentum into the start of November, gaining over 20 basis points, driving the positively correlated USDJPY higher, too.
This could change if the next economic projection from the US (like today’s US Michigan Consumer Sentiment) comes in worse than expected, but also if tensions between the US and China start to re-gain momentum in regard to their current Phase-1 trade-deal negotiations.
On Thursday, the Chinese Commerce Ministry said that China and the US have agreed to cancel existing tariffs in different phases and if China and the US reach a Phase-1 Trade Deal, both sides must cancel existing tariffs at the same time with the same proportion based on the agreement.
Still, we have the feeling that especially the rising pressure on US president Trump in regards to the current impeachment developments, could result in the Chinese using these developments as a tool to put further pressure on the US and Trump, telling them to give up on all already imposed tariffs, or else they won’t negotiate on the Phase-1 deal, or anything that may follow.
That said, rising rate-cut speculation and/or risk-off-fears could result in any spikes above 109.00/30 in USDJPY to be not sustainable, but instead being a fake out, resulting in USDJPY go for another stint to the region around 108.00.
Source: Admiral Markets MT5 with MT5SE Add-on USDJPY Daily chart (between 21 September 2018 to 07 November 2019). Accessed: 07 November 2019 at 10:00 PM GMT
Please note: Past performance is not a reliable indicator of future results, or future performance.
In 2014, the value of USDJPY increased by 13.7%, in 2015, it increased by 0.5%, in 2016 it fell by 2.8%, in 2017 it fell by 3.6%, in 2018 it fell by 2.7%, meaning that after five years, it was up by 5.1%.
Disclaimer: The given data provides additional information regarding all analysis, estimates, prognosis, forecasts or other similar assessments or information (hereinafter “Analysis”) published on the website of Admiral Markets. Before making any investment decisions please pay close attention to the following:
This is a marketing communication. The analysis is published for informative purposes only and are in no way to be construed as investment advice or recommendation. It has not been prepared in accordance with legal requirements designed to promote the independence of investment research, and that it is not subject to any prohibition on dealing ahead of the dissemination of investment research.
Any investment decision is made by each client alone whereas Admiral Markets shall not be responsible for any loss or damage arising from any such decision, whether or not based on the Analysis.
Each of the Analysis is prepared by an independent analyst (Jens Klatt, Professional Trader and Analyst, hereinafter “Author”) based on the Author’s personal estimations.
To ensure that the interests of the clients would be protected and objectivity of the Analysis would not be damaged Admiral Markets has established relevant internal procedures for prevention and management of conflicts of interest.
Whilst every reasonable effort is taken to ensure that all sources of the Analysis are reliable and that all information is presented, as much as possible, in an understandable, timely, precise and complete manner, Admiral Markets does not guarantee the accuracy or completeness of any information contained within the Analysis. The presented figures refer that refer to any past performance is not a reliable indicator of future results.
The contents of the Analysis should not be construed as an express or implied promise, guarantee or implication by Admiral Markets that the client shall profit from the strategies therein or that losses in connection therewith may or shall be limited.
Any kind of previous or modeled performance of financial instruments indicated within the Publication should not be construed as an express or implied promise, guarantee or implication by Admiral Markets for any future performance. The value of the financial instrument may both increase and decrease and the preservation of the asset value is not guaranteed.
The projections included in the Analysis may be subject to additional fees, taxes or other charges, depending on the subject of the Publication. The price list applicable to the services provided by Admiral Markets is publicly available from the website of Admiral Markets.
Leveraged products (including contracts for difference) are speculative in nature and may result in losses or profit. Before you start trading, you should make sure that you understand all the risks.