By Dan Steinbock
Two decades ago, the BRIC economies were projected to surpass the advanced G6 economies by the early 2030s. Today, the huge potential of the BRICs prevails, but the pace has slowed and country trajectories have diverged. China and India are on track, Brazil and Russia are not, thanks to geopolitics.
In the early 2000s, Goldman Sachs projected that the four largest emerging economies – Brazil, Russia, India and China, or the BRICs – would surpass the major advanced economies by the early 2030s.
When the first BRICS Summit took place in Yekaterinburg, Russia in 2009, the combined economic power of the BRIC countries amounted to barely 12 percent of the collective economic power of the major advanced economies, the Group of Six (G6); the US, Western Europe (Germany, UK, France, Italy), and Japan.
At the time, the US economy was some 2.5 times bigger than that of China but amid the worst asset-bubble burst since the Great Depression. Japan, the world’s second-largest economy, was coping with a second lost decade. Chancellor Merkel’s Germany and President Sarkozy’s France still led the ailing Europe, where the global recession would soon morph into a series of sovereign debt crises. In Brazil, President Lula drove a dramatic growth catch-up, while reducing historical income polarization. In Manmohan Singh’s India, growth was accelerating. In Russia, President Putin had multiplied the size of the economy by more than five-fold in one decade, thanks to rising energy prices.
But where are the BRICs today?
Projected Versus Actual Growth
To gain a better understanding of what has happened in the past two decades, let’s compare Goldman Sachs’s original BRIC projections in the 2000s, which rested on the economic development in the 1980s and 1990s, with the actual BRIC prospects today, which are the net effect of the past two decades.
What Goldman Sachs projected was a dramatic expansion of China whose GDP was anticipated to grow more than 14-fold between 2000 and 2025. At the same time, India’s economy would increase by almost tenfold and was projected to grow relatively faster than China in the late 2010s. Brazil was expected to expand fivefold and Russia more than tenfold. In light of the fact that, in the same time period, the US, the largest advanced economy, was projected to expand more than twofold, these were stunning projections indicating solid catch-up growth in the largest emerging economies.
So what happened? Here’s the bottom line: If peaceful conditions prevail and trade protectionism can be kept in check, China could deliver more than expected, while India is on track as well. However, the potential of Brazil and Russia, respectively, has been undermined by geopolitics (Figure 1).
Figure 1 Expansion by BRIC Economies, 2000-2024
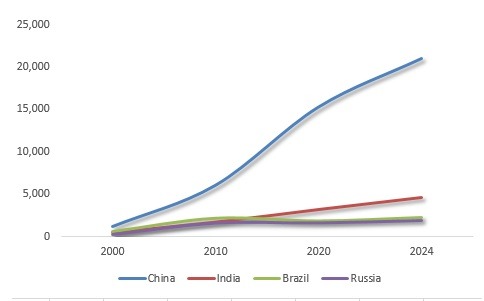
Sources: IMF; Difference Group.
After China joined the World Trade Organization (WTO) in 2001, its economic expansion intensified dramatically, fueled by the export-led growth model. Since the early 2010s, that model has been morphing toward consumption and innovation. By the mid-2020s – again, assuming peaceful conditions and managed trade tensions – China’s economy could expand more than 17 times, relative to its size in 2000. It is set to surpass the size of the US economy in the 2030s, which may well be the key to the Obama military pivot to Asia in the early 2010s and to Trump tariff wars more recently.
While India’s growth trajectory has periodically slipped, it has been pushed harder by Prime Minister Narendra Modi, despite recent growth pains. If things go right, India’s economy could expand the projected tenfold by the mid-2020s. New Delhi is engaged in a cautious balancing act between economic development and rising prosperity, which is what the country needs, and geopolitics and rearmament, which is what Washington would prefer.
Under President Lula’s leadership, Brazil’s GDP grew even faster than expected by the original BRIC projection. But since the mid-2010s, the contested impeachment of President Rousseff and particularly the imprisonment of Lula, Brazil’s growth trajectory has plunged. The geopolitical soft coup, which critics claim paved the way to radical right’s President Bolsonaro and the dreams of a new military dictatorship, could result in a lost decade. By the mid-2020s, Brazil’s GDP may reach the level where it first was at the end of the Lula era, already in the early 2010s.
Instead of being almost a fifth of the US GDP by the mid-2020s, Brazil’s economy may prove to be less than 9 percent of the US (over half smaller than originally projected). The dreams of tens of millions of Brazilians of a better future have been undermined.
In Russia, President Putin was able to reverse the economy’s drastic fall in the 1990s and restore the growth trajectory in the 2000s, when Russian economic prospects were in line with the BRIC projections. As Stephen F. Cohen has argued, Washington initiated a “new Cold War” against Russia before the 2008 global crisis. Due to the continued softness in oil prices and particularly the still ongoing sanctions, the Russian economy could have been almost a fifth of the U.S. economy by 2025. Thanks to the new Cold War, the Russian economy could prove to be less than a tenth of the US GDP in the period. Thanks to the new Cold War, Russian economy could prove to be less than a tenth of the US GDP in the period.
Russian economy could increase by six to seven times, but it cannot deliver its full potential.
BRICs positioned to surpass G6 in early 2030s
The peak of the advanced economies’ global power was in the 1980s and ‘90s. In 2000, the economies of the major advanced nations of the “West,” as reflected by the G6, were still almost ten times bigger than the BRICs. But increasing debt, military overstretch and aging populations have hit hard the advanced West.
In 2010, the BRICs accounted for more than a third of the G6; and in the mid-2020s, that figure will be two-thirds of G6. The original Goldman Sachs projections suggested the BRICs would catch up with G6 by the late 2020s. Thanks to geopolitical interventions, the actual convergence is likely to take a 5-10 years longer (Figure 2).
Figure 2 G6 Economies and the BRICs’ Catch-Up, 2000-2024
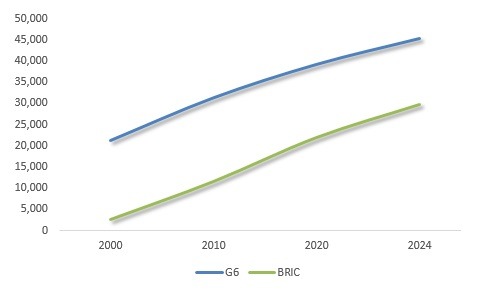
Sources: IMF; Difference Group.
Of course, if the six G6 countries would be compared with the six largest emerging economies – not just the four BRICs – Indonesia and Mexico could be added to the group. In that case, convergence would happen a few years earlier.
As International Monetary Fund reported in 2007, the large emerging economies have fueled global economic prospects since the 2000s. Recent efforts to undermine their economic potential reflect efforts at destabilization and regime change, critics argue. In the absence of significant policy U-turn, collateral damage is spreading.
As US pivot to Asia is promoting competition rather than cooperation, the economic promise of the Asian Century is threatened. The Trump tariff wars have played a key role in the plunge of world trade, the fall of world investment and rising migration barriers, which have caused the number of the globally displaced to soar to more than 70 million; far higher than they were after World War II. At the same time, global economic prospects continue to diminish in a way that could push major advanced economies into secular stagnation earlier than anticipated.
Spearheading the world’s largest emerging and developing economies, China, India, Brazil and Russia together pace global economic prospects. And as they go, so will the world economy.
About the Author:
Dr. Dan Steinbock is the founder of Difference Group and has served as research director at the India, China and America Institute (USA) and visiting fellow at the Shanghai Institutes for International Studies (China) and the EU Center (Singapore). For more, see http://www.differencegroup.net/
The original commentary was released by China-US Focus on November 10, 2019.