Article By RoboForex.com
EURUSD, “Euro vs US Dollar”
After breaking 1.1118, EURUSD has reached 1.1065. Possibly, today the pair may return to 1.1118 to test it from below and then form a new descending structure with the target at 1.1063.


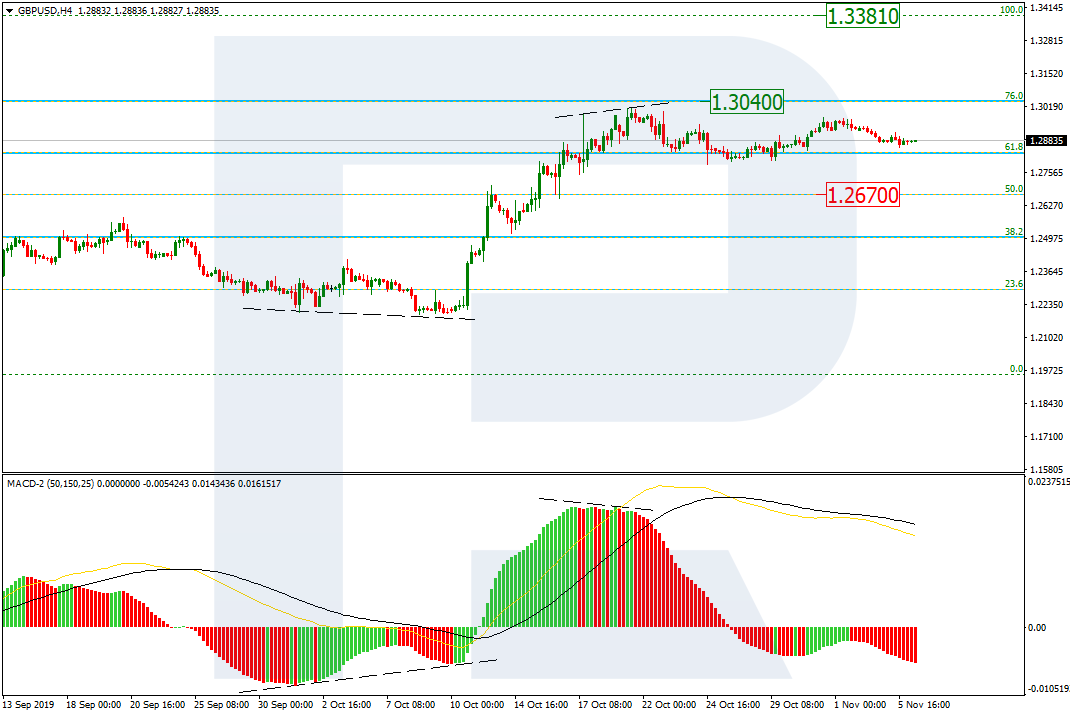
GBPUSD, “Great Britain Pound vs US Dollar”
GBPUSD has finished the first descending wave at 1.2866. Today, the pair may start another correction to reach 1.2917 and then continue trading downwards with the target at 1.2765.

USDCHF, “US Dollar vs Swiss Franc”
After completing the ascending wave at 0.9888 and forming another consolidation range around it, USDCHF has broken it upwards to reach 0.9933; right now, it is consolidating around this level. Possibly, the pair may expand the range towards 0.9938 and then start a new decline with the target at 0.9888.

USDJPY, “US Dollar vs Japanese Yen”
After forming the consolidation range above 109.07, USDJPY has broken it downwards. According to the main scenario, the price is expected to trade downwards to reach 108.87 and then form one more ascending structure towards 109.04. Later, the market may resume its decline with the target at 108.52.

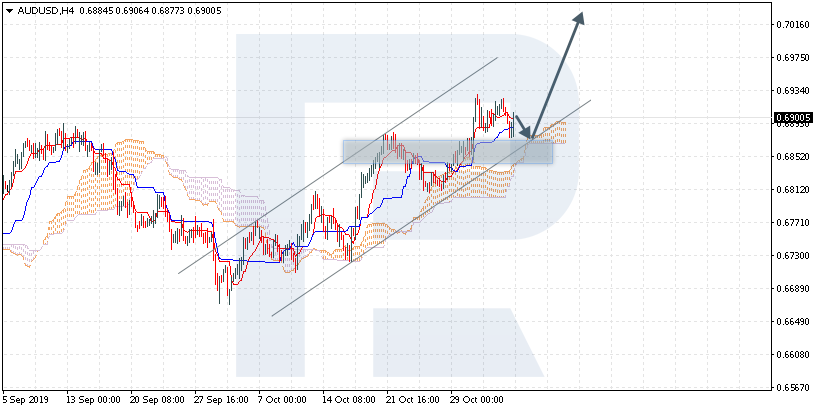
AUDUSD, “Australian Dollar vs US Dollar”
AUDUSD is consolidating around 0.6900. Possibly, the pair may reach 0.6877 and then resume trading upwards to return to 0.6900.

USDRUB, “US Dollar vs Russian Ruble”
USDRUB is correcting towards 63.69. Later, the market may resume falling with the short-term target at 63.00.

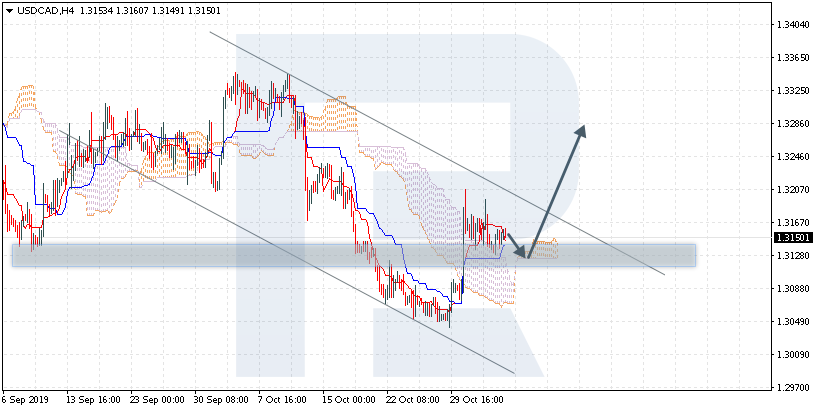
USDCAD, “US Dollar vs Canadian Dollar”
After finishing the descending impulse towards 1.3137, USDCAD has completed the correction. Possibly, the pair may form a new descending impulse to reach 1.3104 and then start another growth with the target at 1.3160.

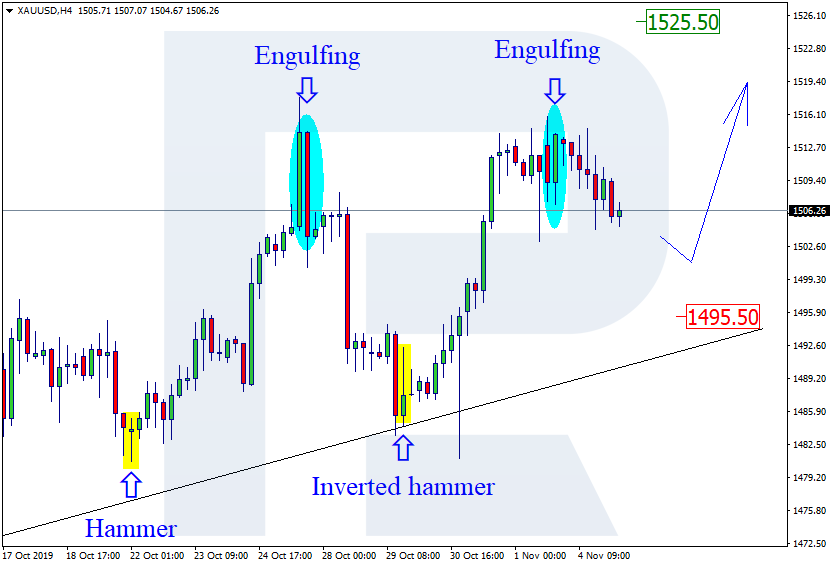
XAUUSD, “Gold vs US Dollar”
After completing the descending structure at 1479.30, Gold is consolidating near the lows. Today, the pair may break the range upwards to reach 1493.45. After that, the instrument may form a new descending structure to return to 1478.30.

BRENT
After finishing the ascending structure at 63.50, Brent is correcting towards 62.50. After that, the pair may grow to reach 62.85. If later the price breaks this range to the downside, the market may continue the correction to reach 61.50; if to the upside – resume trading inside the uptrend with the target at 64.90.

BTCUSD, “Bitcoin vs US Dollar”
BTCUSD is moving upwards to reach 9415.00. Later, the market may form a new descending structure towards 9130.00 and then start another growth with the target at 9600.00.

Article By RoboForex.com
Attention!
Forecasts presented in this section only reflect the author’s private opinion and should not be considered as guidance for trading. RoboForex LP bears no responsibility for trading results based on trading recommendations described in these analytical reviews.