Last week, the US dollar closed with a decline against a basket of currency majors. The dollar index (#DX) moved away from local highs and closed in the red zone. The US has published some ambiguous economic releases. At the same time, Fed Chairman Jerome Powell said the US economy was stable and the official did not see a risk of recession. In the near future, the regulator plans to keep interest rates at current levels. Financial market participants continue to monitor the settlement of the trade conflict between Washington and Beijing.
White House economic adviser, Larry Kudlow, said China and the US were approaching an end to their trade war, which has been going on for 16 months. On Sunday, Xinhua, China’s news agency, reported that the parties had “constructive talks” via the phone, but they didn’t give any information about it.
The “black gold” prices have been growing. Currently, futures for the WTI crude oil are testing the $57.80 mark per barrel.
Market Indicators
On Friday, there was the bullish sentiment in the US stock markets: #SPY (+0.72%), #DIA (+0.61%), #QQQ (+0.73%).
The 10-year US government bonds yield has not changed. At the moment, the indicator is at the level of 1.84-1.85%.
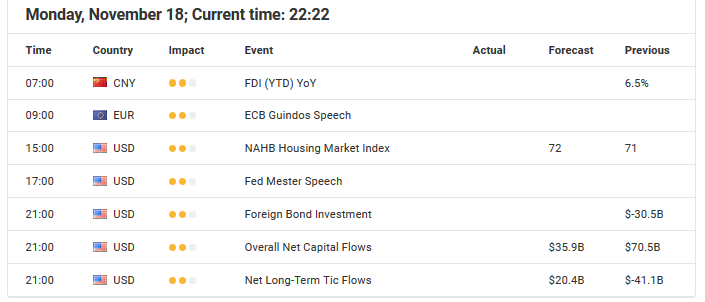
The Economic News Feed for 18.11.2019:
Today, the publication of important economic news is not expected.
EUR/USD currency pair is in a bullish sentiment. The trading instrument has set new local highs. EUR/USD quotes found resistance at the level of 1.10650. 1.10400 is already a mirror support. Sentiment in the financial markets has improved amid optimistic news on the settlement of the trade conflict between Washington and Beijing. White House spokesman Larry Kudlow said the parties are close to making a deal. We recommend that you keep track of current information on this issue. EUR/USD can grow further. You should open positions from key levels.
The Economic News Feed for 18.11.2019 is calm.
The price fixed above 50 MA and 100 MA, which signals the strength of buyers.
The MACD histogram is in the positive zone and continues to rise, indicating a further recovery of the EUR/USD currency pair.
Stochastic Oscillator has started to leave the overbought zone, the %K line is below the %D line, which indicates a bearish sentiment.
Trading recommendations
Support levels: 1.10400, 1.10150, 1.09900
Resistance levels: 1.10650, 1.10900, 1.11000
If the price consolidates above 1.10650, expect further correction to the round level of 1.11000.
Alternatively, the quotes could drop toward 1.10250-1.10000.
The GBP/USD currency pair
Technical indicators of the currency pair:
Prev Open: 1.28809
Open: 1.29214
% chg. over the last day: +0.14
Day’s range: 1.29095 – 1.29516
52 wk range: 1.1959 – 1.3385
The GBP/USD currency pair is showing aggressive purchases. Sterling updated key extremes. At the moment, GBP/USD quotes are testing the resistance level of 1.29500. Mark 1.29150 is already a mirror support. A trading instrument has the potential for further growth. We recommend keeping track of up-to-date information regarding the Brexit process. Open positions from key levels.
The news background on the UK economy is calm.
The price fixed above 50 MA and 100 MA, which signals the power of buyers.
The MACD histogram is in the positive zone and above the signal line, which gives a strong signal to buy GBP/USD.
The Stochastic Oscillator is in the neutral zone, the %K line crossed the %D line. There are no signals at the moment.
Trading recommendations
Support levels: 1.29150, 1.28850, 1.28600
Resistance levels: 1.29500, 1.30000
If the price consolidates above 1.29500, expect further growth toward 1.30000.
Alternatively, the quotes could descend toward 1.28900-1.28700.
The USD/CAD currency pair
Technical indicators of the currency pair:
Prev Open: 1.32478
Open: 1.32230
% chg. over the last day: -0.18
Day’s range: 1.32097 – 1.32249
52 wk range: 1.2727 – 1.3664
The USD/CAD currency pair is dominated by bearish sentiment. At the moment, Looney is consolidating near key extremes. The trading tool is testing the support level of 1.32100. 1.32350 is the nearest resistance. USD / CAD quotes have the potential to further decline. The Canadian dollar is supported by the positive dynamics of oil quotes. We recommend opening positions from key levels.
The Economic News Feed for 18.11.2019 is calm.
The price fixed below 50 MA and 100 MA, which signals the power of sellers.
The MACD histogram is in the negative zone and continues to decline, which gives a strong signal to sell USD/CAD.
The Stochastic Oscillator is in the neutral zone, the %K line crossed the %D line. There are no signals at the moment.
Trading recommendations
Support levels: 1.32100, 1.31900, 1.31600
Resistance levels: 1.32350, 1.32700
If the price consolidates below 1.32100, further correction of the USD/CAD currency pair is expected toward 1.31800-1.31600.
Alternatively, the quotes could grow toward 1.32600-1.32800.
The USD/JPY currency pair
Technical indicators of the currency pair:
Prev Open: 108.384
Open: 108.783
% chg. over the last day: +0.31
Day’s range: 108.669 – 108.949
52 wk range: 104.97 – 114.56
The USD/JPY currency pair has moved up. The trading tool has updated local highs. At the moment, quotes are testing a mirror resistance level of 108.900. The 108.650 mark is the immediate support. Demand for safe haven currencies has weakened amid the prospects for resolving a trade conflict between the US and China. We do not exclude further growth of the USD/JPY quotes. We recommend that you pay attention to the dynamics of yield on US government bonds. Open positions from key levels.
The Economic News Feed for 18.11.2019 is calm.
Indicators do not give accurate signals, the price crossed 50 MA and 100 MA.
The MACD histogram is in the positive zone and continues to rise, which gives a strong signal to buy USD/JPY.
The Stochastic Oscillator is in the neutral zone, the %K line is below the %D line, which indicates a bearish sentiment.
Trading recommendations
Support levels: 108.650, 108.400, 108.250
Resistance levels: 108.900, 109.150, 109.300
If the price consolidates above 108.900, expect the quotes to rise toward 109.150-109.300.
Alternatively, the quotes could descend toward 108.500-108.300.
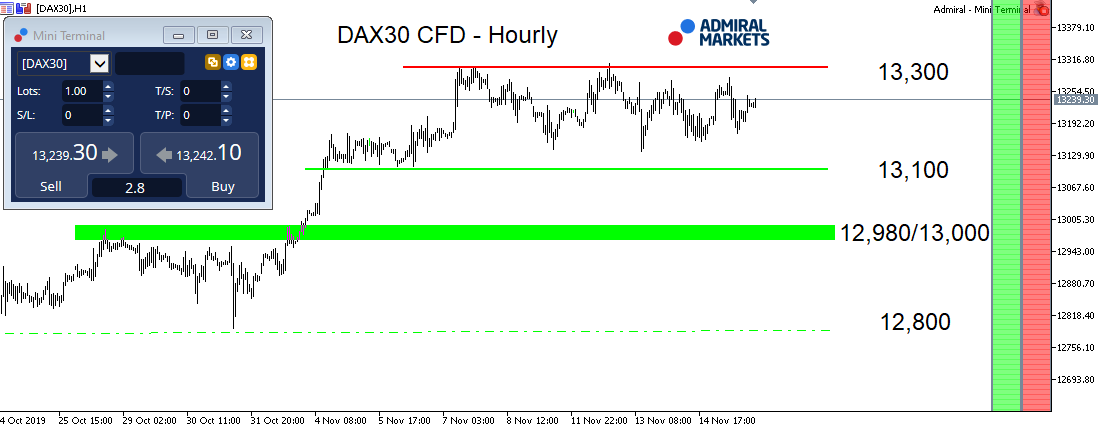
The DAX30 CFD was range-bound again last week, and since we have a thin economic calendar this Monday, we have to see whether we get to see a serious attack of the DAX30 CFD to break out of its range.
The relevant levels can still be found around 13,100 points on the downside, and 13,300 points on the upside and, and this is where our focus will be.
While the short-term mode can be considered neutral, the longer time-frame picture can be seen bullish with a break out of the range above 13,300 points having an overall higher likelihood in our opinion.
Besides the technical side, the thin economic calendar in addition to market participants keep adding to their overall extended volatility short-position add up tour bullish bias.
Above 13,300 points, the first target can be found around 13,500 points, while in the event of a (surprise) breakout of the trading range on the downside, and a drop below 13,100 points, the next target can be found around 12,970 / 13,000 points:
Source: Admiral Markets MT5 with MT5-SE Add-on DAX30 CFD Hourly chart (between October 24, 2019, to November 15, 2019). Accessed: November 15, 2019, at 10:00pm GMT
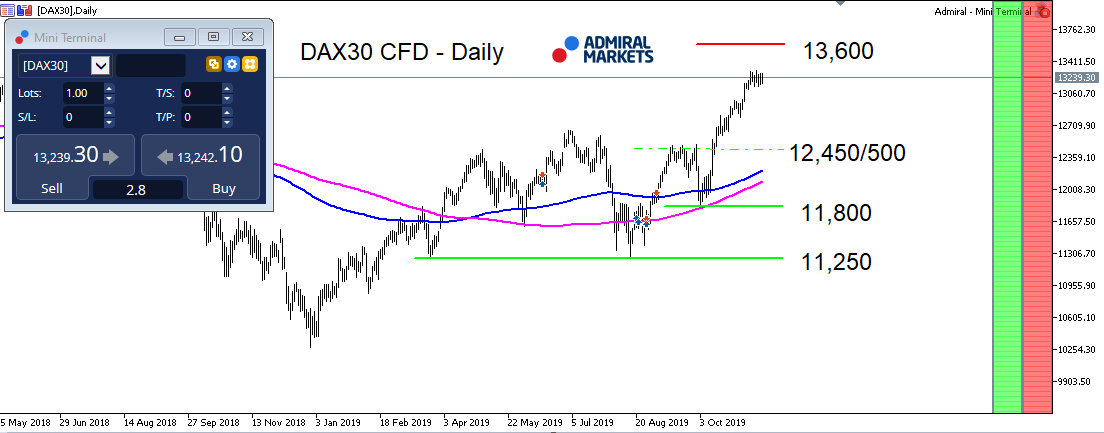
Source: Admiral Markets MT5 with MT5-SE Add-on DAX30 CFD Daily chart (between May 15, 2018, to November 15, 2019). Accessed: November 15, 2019 at 10:00pm GMT – Please note: Past performance is not a reliable indicator of future results, or future performance.
In 2014, the value of the DAX30 CFD increased by 2.65%, in 2015, it increased by 9.56%, in 2016, it increased by 6.87%, in 2017, it increased by 12.51%, in 2018, it fell by 18.26%, meaning that after five years, it was up by 10.5%.
Discover the world’s #1 multi-asset platform
Admiral Markets offers professional traders the ability to trade with a custom, upgraded version of MetaTrader 5, allowing you to experience trading at a significantly higher, more rewarding level. Experience benefits such as the addition of the Market Heat Map, so you can compare various currency pairs to see which ones might be lucrative investments, access real-time trading data, and so much more. Click the banner below to start your FREE download of MT5 Supreme Edition!
Disclaimer: The given data provides additional information regarding all analysis, estimates, prognosis, forecasts or other similar assessments or information (hereinafter “Analysis”) published on the website of Admiral Markets. Before making any investment decisions please pay close attention to the following:
This is a marketing communication. The analysis is published for informative purposes only and are in no way to be construed as investment advice or recommendation. It has not been prepared in accordance with legal requirements designed to promote the independence of investment research, and that it is not subject to any prohibition on dealing ahead of the dissemination of investment research.
Any investment decision is made by each client alone whereas Admiral Markets shall not be responsible for any loss or damage arising from any such decision, whether or not based on the Analysis.
Each of the Analysis is prepared by an independent analyst (Jens Klatt, Professional Trader and Analyst, hereinafter “Author”) based on the Author’s personal estimations.
To ensure that the interests of the clients would be protected and objectivity of the Analysis would not be damaged Admiral Markets has established relevant internal procedures for prevention and management of conflicts of interest.
Whilst every reasonable effort is taken to ensure that all sources of the Analysis are reliable and that all information is presented, as much as possible, in an understandable, timely, precise and complete manner, Admiral Markets does not guarantee the accuracy or completeness of any information contained within the Analysis. The presented figures refer that refer to any past performance is not a reliable indicator of future results.
The contents of the Analysis should not be construed as an express or implied promise, guarantee or implication by Admiral Markets that the client shall profit from the strategies therein or that losses in connection therewith may or shall be limited.
Any kind of previous or modeled performance of financial instruments indicated within the Publication should not be construed as an express or implied promise, guarantee or implication by Admiral Markets for any future performance. The value of the financial instrument may both increase and decrease and the preservation of the asset value is not guaranteed.
The projections included in the Analysis may be subject to additional fees, taxes or other charges, depending on the subject of the Publication. The price list applicable to the services provided by Admiral Markets is publicly available from the website of Admiral Markets.
Leveraged products (including contracts for difference) are speculative in nature and may result in losses or profit. Before you start trading, you should make sure that you understand all the risks.
By the end of last week, almost all major currencies closed in the black. The highest growth against the US dollar was shown by the New Zealand dollar (+1.22%). The British pound increased by 0.98%, the Swiss franc – 0.79%, the Japanese yen – 0.43% and the euro – 0.23%. The Australian dollar fell (-0.56%). Major US stock indices closed at record highs.
Positivity in the market was caused by news out of China. US Economic Advisor Larry Kudlow said the US and China are close to a trade agreement. He called the ongoing negotiations “very constructive”.
US Secretary of Commerce Wilbur Ross said progress is being made in concluding the details of a future trade agreement. Both parties are keen on concluding an agreement at the end of the first phase of negotiations.
Day’s news (GMT +3):
14:00 Germany: German Buba Monthly Report.
18:00 USA: NAHB Housing Market Index (Nov).
21:00 USA: 3- and 6-Month Bill Auction.
Current situation: On the 8H chart, after the breakdown of the trend line from 1.1175, the euro exchange rate has grown by 60 points, to 1.1064. The news regarding the productive negotiations between the US and China which broke over the weekend was clearly the catalyst.
Today is Monday – correction day. There is hardly any fresh news to report. At Asian auctions, the pound and the euro are trading up, while other currencies are down. To understand the general mood of market players, we will need to wait until the start of trading in Europe.
The increase was 38% of the fall from 1.1175 to 1.0989. The maximum of 1.1043 (11.11.19) was passed. Now kickbacks will be perceived for purchases. Support is based at the 1.1025 mark.
EURUSD has reached the target at 1.0988; right now, it is moving upwards to reach 1.1030. Later, the market may start a new correction towards 1.1004 and then form one more ascending structure with the target at 1.1050.
GBPUSD, “Great Britain Pound vs US Dollar”
GBPUSD has broken 1.2855 to the upside. Possibly, the pair may expand the range towards 1.2895 and then start another decline to return to 1.2955, thus forming a new consolidation range. If later the price breaks this range to the upside, the market may resume trading upwards with the target at 1.2950; if to the downside – continue the correction to reach 1.2760.
USDCHF, “US Dollar vs Swiss Franc”
USDCHF is forming the second rising impulse to break 0.9895. Later, the market may break this level and then continue trading upwards with the short-term target at 0.9917.
USDJPY, “US Dollar vs Japanese Yen”
USDJPY has extended the descending wave at 108.40; right now, it is moving upwards with the target at 108.71. After that, the instrument may start a new correction towards 108.48 and then form one more ascending structure with the short-term target at 108.95.
AUDUSD, “Australian Dollar vs US Dollar”
AUDUSD has reached its short-term target at 0.6773; right now, it is moving upwards with the target at 0.6797. Later, the market may start a new correction towards 0.6783 and then form one more ascending structure to reach 0.6805. After that, the instrument may break this level and continue growing with the short-term target at 0.6827.
USDRUB, “US Dollar vs Russian Ruble”
USDRUB has broken 64.28; right now, it is correcting towards 63.95. Later, the market may resume trading upwards with the target at 64.64.
USDCAD, “US Dollar vs Canadian Dollar”
After completing the ascending wave at 1.3268 and starting a new structure to the downside, USDCAD has broken 1,3235. Possibly, the pair may continue falling towards 1.3198. After that, the instrument may start a new correction to reach 1.3235.
XAUUSD, “Gold vs US Dollar”
Gold has reached its upside target at 1473.37; right now, it is falling with the first target at 1463.50. After that, the instrument may start another growth towards 1468.94 and then form a new descending structure to reach 1459.33.
BRENT
Brent has failed to fix above 63.03; right now, it is moving downwards. Today, the pair may fall to reach 61.98. If later the price breaks this level to the downside, the market may continue trading inside the downtrend with the target at 61.30.
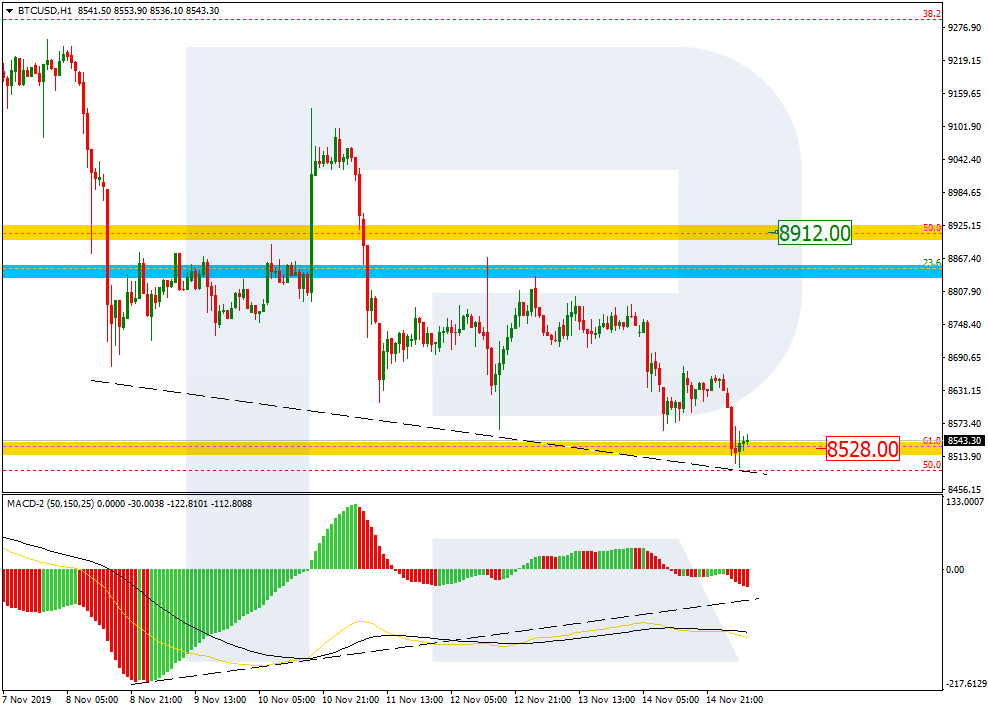
BTCUSD, “Bitcoin vs US Dollar”
BTCUSD has broken 8550.00 downwards. Possibly, today the pair may test this level from below and then resume trading inside the downtrend with the target at 8424.00. Later, the market may break this level and continue falling to reach 8050.00.
Attention! Forecasts presented in this section only reflect the author’s private opinion and should not be considered as guidance for trading. RoboForex LP bears no responsibility for trading results based on trading recommendations described in these analytical reviews.
As we can see in the H4 chart, BTCUSD is still correcting downwards. By now, it has already broken 61.8% fibo and may continue falling to reach 76.0% fibo at 8080.50. However, if later the price continues its decline towards the low at 7302.00, this correction may transform into a new descending wave. So far, the main scenario implies that the market may complete the current correction and resume growing towards the high at 10521.60, and 50.0% and 61.8% fibo at 10572.00 and 11350.00 respectively.
In the H1 chart, there is a convergence on MACD while the pair is testing 61.8% fibo. Probably, it might be a turning period, but in order to reverse, the price must test the local resistance at 50.0% fibo (8912.00).
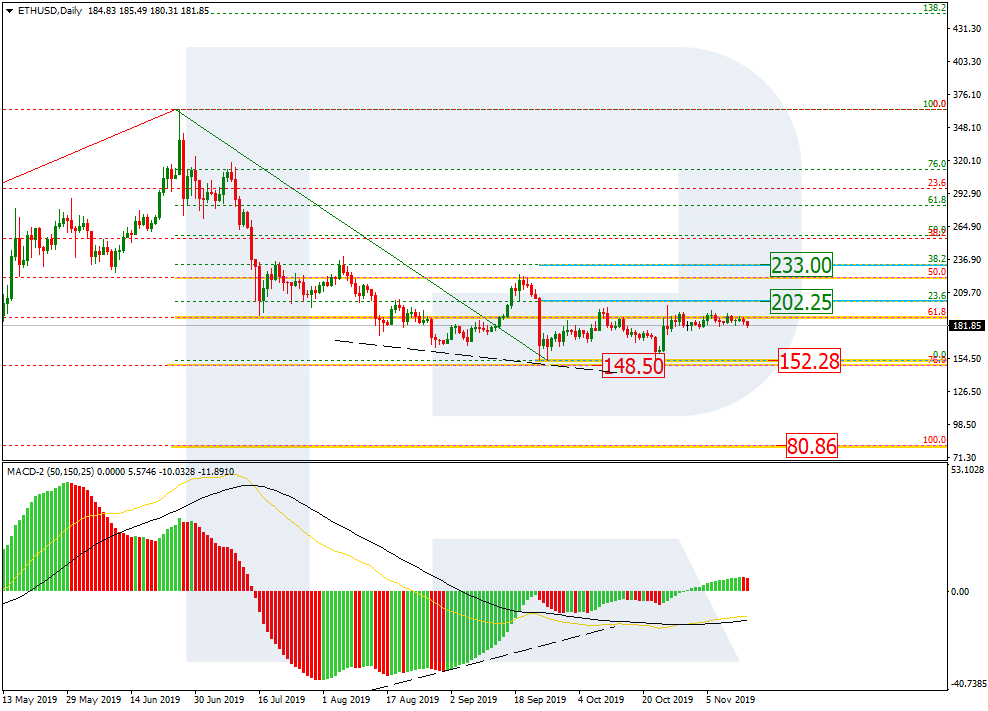
ETHUSD, “Ethereum vs. US Dollar”
The daily chart shows the sideways correction. The pair is trying to reach 23.6% fibo at 202.25, but hasn’t been able to do it so far. After reaching this level, ETHUSD may continue moving towards the next upside target at 38.2% fibo (233.00). However, if later the price breaks the low at 152.28, the mid-term correction may continue towards 76.0% fibo at 148.50 and then this year’s low at 80.86.
The H4 chart shows more detailed structure of the current correction after the rising impulse. The correction is taking the form Triangle pattern and has already reached 50.0% fibo. In case of further decline, the next targets will be 61.8% and 76.0% fibo at 170.55 and 164.00.
Attention! Forecasts presented in this section only reflect the author’s private opinion and should not be considered as guidance for trading. RoboForex LP bears no responsibility for trading results based on trading recommendations described in these analytical reviews.
Mankind as a race, has progressed mightily over the years. From the agricultural days of yesteryear, to the industrial revolution, and the technological advancements of today, humanity has experienced evolution on a massive scale. One thing that has not changed though, is our dependence on livestock and agriculture. Who would have thought that agricultural commodities too, stand as a medium to reap profits from! Some agricultural commodities stand as a source of food for people and animals around the world, while others exist solely for industrial applications. Grains, livestock and dairy are rich sources of food, which are necessary for survival.
Latex from rubber trees, lumber from trees, and wool from sheep, find their application for industrial purposes, and are sold as a variety of different products. Over 20% of the world’s population find themselves in the farming trade (Nearly 1.3 billion people!), and the global impact of the farming industry is gigantic. According to the Food and Agricultural Organization of the United Nations, the agricultural industry’s economic value is upwards of $3 trillion. Now is the best time to trade in agricultural commodities. Here are a few of the best soft agricultural commodities you can trade in.
What is a Futures Contract? Where are Soft Commodities Traded?
Futures Contracts are agreements which entail one party agreeing to buy a specific quantity of a commodity, and take its delivery on a pre-decided date. The selling party must agree to provide the commodity in discussion, on the date being agreed upon. Soft commodities can be traded on Exchanges, in a specific quantity.
Among the most popular exchanges for soft commodities include – (CME) Chicago Mercantile Exchange, (CBOT) Chicago Board of Trade, (ICE) Intercontinental Exchange, (NYMEX) New York Mercantile Exchange, (TOCOM) Tokyo Commodity Exchange, (SHFE) Shanghai Futures Exchange, and (ASX) Australian Stock Exchange
Popular Soft Commodities –
Cereal Grains
The most common cereal grains include the likes of – Rough Rice, Barley, Oats, Corn, and Wheat. These commodities are grown as a food source for humans and animals, as well as a feedstock for certain fuels, in some cases. Barley, oats, and corn serve as good food sources for livestock, and farmers will choose to buy one grain over the other depending on its price.
As a result of this, most cereal grain commodities have a strong price relationship with each other. Traders often monitor the spread existing between the prices of these cereal grains, to determine the relative values of one cereal grain, with respect to the other.
Oilseeds
Among the most common oilseeds are Soybeans, Palm Oil, Cotton and Canola. Farmers generally grow oilseeds for a variety of purposes. Oilseeds have high oil content in their seeds, and provide for a hearty meal as well, or have industrial applications, once the oil has been extracted.
For example, when it comes to cotton, its plant fibres are extremely important in the clothing and houseware industries. Other oilseeds, on the other hand, serve as a rounded meal for livestock, once oil has been extracted from their seeds. This renders a strong price relationship between oilseeds, and cereal grains.
Meat
Meat commodities include the likes of live animals raised for their meat, hide, bones, organs and hooves, as well as cuts of meat produced during the butchering of livestock. Feeder Cattle, Live Cattle, Fish, Chicken, Pork Bellies and Lean Hogs, are among the many meat commodities.
Dairy Products
Among the most popular dairy products include milk, butter, cheese, and whey. The markets for these products days well back to the 19th century, when traders first organized the Chicago Butter and Egg Board. As of today, these products are traded on the Chicago Mercantile Exchange (CME).
Other Products
There are several other products, like Sugar, Cocoa, Coffee, and Frozen Concentrated Orange Juice, which find wide application all over the world, and are sold vastly.
Population Growth
According to research, the world’s population is expected to exceed 9 billion, by 2040. Demographers have come to the conclusion that about three-fourths of the entire world’s population, will reside in either Africa, or Asia, at the time. Not only will there be a substantial rise in population, but people will be richer as well. Developing countries with developing regions will experience the greatest boom in wealth, with people migrating from rural areas to cities, and great development ensuing in rural regions. Wealthier people will correlate to an exponential rise in the demand for agricultural products, as does the rise in population correlate to the same.
A rise in population, and decreasing rural regions could strain agricultural resources, and the need of the hour would be great innovation in the fields of irrigation and biogenetics. Lang usage will have to be optimized in order to cater to the larger agricultural demands, and to feed an enormous population. Trading in soft commodities will be humongous at that point of time, and their prices will be much, much higher than they are now. 20% of the world’s population is involved in some form of farming as of today, and by 2040, the number of investment opportunities, and people involved in agriculture and farming will be much higher. Start investing in the right soft commodities today, and build for the future.
About the Author:
Michael is an experienced financial trader using Forex, Commodities and Cryptocurrencies. In addition to trading, he runs businesses, trains traders and develops trading technology products. His other passions are boxing and travelling.
The EUR/USD currency pair went up after a long fall. EUR/USD quotes updated local highs. Investors began to partially fix positions on the greenback. Trade negotiations between Washington and Beijing remain the focus of attention. White House representatives Larry Kudlow said yesterday that the parties are approaching a deal. We recommend that you keep track of current information on this issue. We expect the release of important statistics. We recommend opening positions from key levels.
The Economic News Feed for 15.11.2019:
– The Consumer Price Index (EU) – 12:00 (GMT+3:00);
– Retail Sales Report (US) – 15:30 (GMT+3:00);
– Industrial Production Volume (US) – 16:15 (GMT+3:00);
Indicators do not provide accurate signals, 50 MA started to cross 100 MA.
The MACD histogram is in the positive zone, but below the signal line, which gives a weak signal to buy EUR/USD.
The Stochastic Oscillator is in the neutral zone, the %K line is below the %D line, which indicates a bearish sentiment.
Trading recommendations
Support levels: 1.10150, 1.09900, 1.09500
Resistance levels: 1.10400, 1.10600, 1.10900
If the price consolidates above 1.10400, expect further correction to 1.10600-1.10900.
Alternatively, the quotes could drop toward 1.09900-1.09700.
The GBP/USD currency pair
Technical indicators of the currency pair:
Prev Open: 1.28526
Open: 1.28809
% chg. over the last day: +0.24
Day’s range: 1.28717 – 1.28861
52 wk range: 1.1959 – 1.3385
GBP/USD quotes began to recover after a long consolidation. GBP updated local highs. At the moment, the trading instrument is consolidating near the key supply zone of 1.28850-1.29000. 1.28600 is already a mirror support. We do not exclude further growth of the GBP/USD currency pair. We recommend keeping track of up-to-date information regarding the Brexit process. Today, investors will evaluate important economic releases from the United States. Open positions from key levels.
The Economic News Feed for 15.11.2019 is calm.
The price fixed above 50 MA and 100 MA, which signals the strength of buyers.
The MACD histogram is in the positive zone, but below the signal line, which gives a weak signal to buy GBP/USD.
The Stochastic Oscillator is in the neutral zone, the %K line crossed the %D line. There are no signals at the moment.
Trading recommendations
Support levels: 1.28600, 1.28200, 1.27900
Resistance levels: 1.28850, 1.29000, 1.29250
If the price consolidates above 1.28850, expect further growth toward 1.29100-1.29300.
Alternatively, the quotes can descend toward 1.28300-1.28100.
The USD/CAD currency pair
Technical indicators of the currency pair:
Prev Open: 1.32518
Open: 1.32478
% chg. over the last day: -0.02
Day’s range: 1.32194 – 1.32518
52 wk range: 1.2727 – 1.3664
The USD/CAD currency pair went down. The trading tool has updated local lows. CAD is currently consolidating in the range of 1.32150-1.32400. USD/CAD quotes can decline further. Today we recommend that you pay attention to economic reports from the US, as well as the dynamics of prices of black gold. Open positions from key levels.
The Economic News Feed for 15.11.2019 is calm.
Indicators do not provide accurate signals: the price crossed 50 MA and 100 MA.
The MACD histogram is in the negative zone and below the signal line, which gives a strong signal to sell USD/CAD.
The Stochastic Oscillator is in the neutral zone, the %K line is above the %D line, which indicates bullish sentiment.
Trading recommendations
Support levels: 1.32150, 1.31900, 1.31600
Resistance levels: 1.32400, 1.32700
If the price consolidates below 1.32150, expect further correction of the USD/CAD to 1.31900-1.31700.
Alternatively, the quotes could grow toward 1.32600-1.32800.
The USD/JPY currency pair
Technical indicators of the currency pair:
Prev Open: 108.883
Open: 108.384
% chg. over the last day: -0.30
Day’s range: 108.378 – 108.628
52 wk range: 104.97 – 114.56
An ambiguous technical pattern has developed on the USD/JPY currency pair. The trading instrument is in a lateral movement. At the moment, the following local support and resistance levels can be distinguished: 108.400 and 108.650, respectively. Financial market participants are waiting for new information regarding the settlement of the trade conflict between Washington and Beijing. Today we recommend paying attention to economic releases from the USA. Open positions from key levels.
During the Asian trading session, Japan published a positive data on the volume of industrial production.
The price fixed below 50 MA and 100 MA, which signals the strength of sellers.
The MACD histogram is in the negative zone, but above the signal line, which gives a weak signal to sell USD/JPY.
The Stochastic Oscillator is in the neutral zone, the %K line is below the %D line, which indicates a bearish sentiment.
Trading recommendations
Support levels: 108.400, 108.250, 108.000
Resistance levels: 108.650, 108.850, 109.150
If the price consolidates below 108.400, expect a further drop toward 108.000.
Alternatively, the quotes could grow toward 108.850-109.100.
The US dollar weakened slightly against a basket of currency majors despite optimistic economic data. The dollar index (#DX) closed yesterday’s trading session in the red zone (-0.21%). Thus, the producer price index in the US rose by 0.4% in October instead of forecasted growth by 0.3%. Also, Fed Chairman Jerome Powell noted that the US economy was stable and the official did not see the risk of recession. Currency majors are currently consolidating.
The US currency is under pressure due to contradictions concerning China-US relations. Chinese Ministry of Commerce spokesman, Gao Feng, said that in order to reach a phase one agreement, the United States would have to cancel the tariffs previously introduced. “The trade war was begun with adding tariffs, and should be ended by canceling these additional tariffs. This is an important condition for both sides to reach an agreement,” Gao said. However, as you know, the United States is in no hurry to take such a step. At the same time, White House economic adviser, Larry Kudlow, said the parties were approaching a deal.
The “black gold” prices have been declining. At the moment, futures for the WTI crude oil are testing the $56.50 mark per barrel. At 20:00 (GMT+2:00), US Baker Hughes total rig count will be published.
Market Indicators
Yesterday, there was a variety of trends in the US stock markets: #SPY (+0.15%), #DIA (+0.06%), #QQQ (-0.08%).
The 10-year US government bonds yield has not changed. At the moment, the indicator is at the level of 1.84-1.85%.
The Economic News Feed for 15.11.2019:
– Consumer price index in the Eurozone at 12:00 (GMT+2:00);
– Report on retail sales in the US at 15:30 (GMT+2:00);
– Industrial production in the US at 16:15 (GMT+2:00).
As we approach the weekly close, the US Retail Sales will catch the attention of traders, especially USD/JPY traders.
While the outlook for the Japanese Yen hasn’t in fact changed over the last week, since US inflation came in below 2% at 1.8% last Wednesday and market participants not seeing any further dovishness from the Fed into the yearly end, markets seem a little too biased towards a “wait-and-see” approach from the US central bank.
That said, after USD/JPY pushed back towards 109.00/30, mainly driven by 10-year US-Treasury yields which took on bullish momentum in the first half of November while gaining over 20 basis points and driving the positive correlated USD/JPY higher, a disappointing US Retail Sales data set today could result in a weak weekly close in the USD/JPY.
Retail Sales data is expected to come in at 0.2% (MoM) for the month of October after a disappointing data set for September at -0.3%, showing the first decline in retail trade since February, mainly due to lower sales at motor vehicles, building materials, hobbies and online purchases.
So, any print below 0.2% and confirmation of the last Retail Sales prints leaves room for the Short-side in USD/JPY, which we also consider to be more attractive from a risk-reward-perspective with a first important target on the downside being found around 107.80/108.00:
Source: Admiral Markets MT5 with MT5-SE Add-on USD/JPY Daily chart (between September 27, 2018, to November 14, 2019). Accessed: November 14, 2019, at 10:00pm GMT- Please note: Past performance is not a reliable indicator of future results, or future performance.
In 2014, the value of the USD/JPY increased by 13.7%, in 2015, it increased by 0.5%, in 2016, it fell by 2.8%, in 2017, it fell by 3.6%, in 2018, it fell by 2.7%, meaning that after five years, it was up by 4.1%.
Discover the world’s #1 multi-asset platform
Admiral Markets offers professional traders the ability to trade with a custom, upgraded version of MetaTrader 5, allowing you to experience trading at a significantly higher, more rewarding level. Experience benefits such as the addition of the Market Heat Map, so you can compare various currency pairs to see which ones might be lucrative investments, access real-time trading data, and so much more. Click the banner below to start your FREE download of MT5 Supreme Edition!
Disclaimer: The given data provides additional information regarding all analysis, estimates, prognosis, forecasts or other similar assessments or information (hereinafter “Analysis”) published on the website of Admiral Markets. Before making any investment decisions please pay close attention to the following:
This is a marketing communication. The analysis is published for informative purposes only and are in no way to be construed as investment advice or recommendation. It has not been prepared in accordance with legal requirements designed to promote the independence of investment research, and that it is not subject to any prohibition on dealing ahead of the dissemination of investment research.
Any investment decision is made by each client alone whereas Admiral Markets shall not be responsible for any loss or damage arising from any such decision, whether or not based on the Analysis.
Each of the Analysis is prepared by an independent analyst (Jens Klatt, Professional Trader and Analyst, hereinafter “Author”) based on the Author’s personal estimations.
To ensure that the interests of the clients would be protected and objectivity of the Analysis would not be damaged Admiral Markets has established relevant internal procedures for prevention and management of conflicts of interest.
Whilst every reasonable effort is taken to ensure that all sources of the Analysis are reliable and that all information is presented, as much as possible, in an understandable, timely, precise and complete manner, Admiral Markets does not guarantee the accuracy or completeness of any information contained within the Analysis. The presented figures refer that refer to any past performance is not a reliable indicator of future results.
The contents of the Analysis should not be construed as an express or implied promise, guarantee or implication by Admiral Markets that the client shall profit from the strategies therein or that losses in connection therewith may or shall be limited.
Any kind of previous or modeled performance of financial instruments indicated within the Publication should not be construed as an express or implied promise, guarantee or implication by Admiral Markets for any future performance. The value of the financial instrument may both increase and decrease and the preservation of the asset value is not guaranteed.
The projections included in the Analysis may be subject to additional fees, taxes or other charges, depending on the subject of the Publication. The price list applicable to the services provided by Admiral Markets is publicly available from the website of Admiral Markets.
Leveraged products (including contracts for difference) are speculative in nature and may result in losses or profit. Before you start trading, you should make sure that you understand all the risks.