Author Archive for InvestMacro – Page 132

EURUSD: price jammed in triangular formation

By Alpari.com

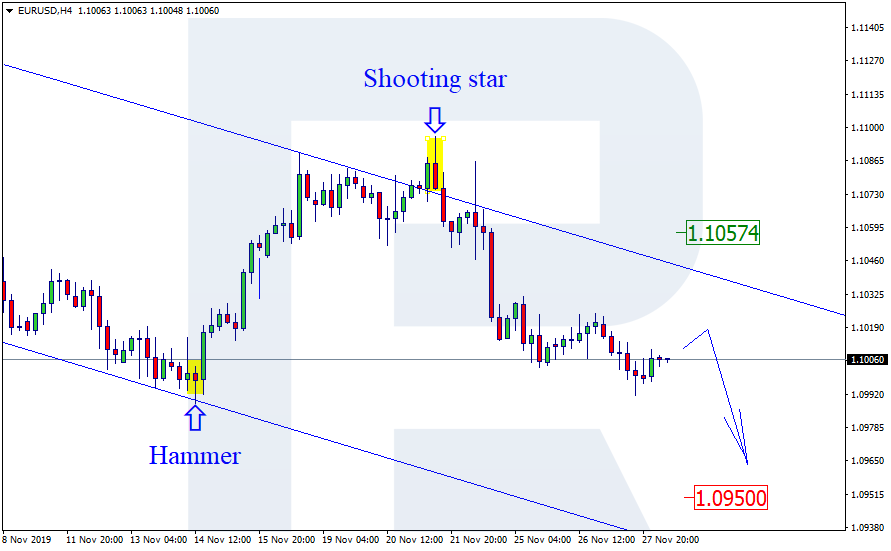
On Thursday the 28th of November, trading on the euro ended in a nine-point increase for the single currency. Due to the Thanksgiving holiday in the United States and the subsequent lower level of activity by traders, bulls were unable to break through to the 1.1030 mark. Although, all of the necessary technical conditions for a recovery have now been met. In the US session, the pair was trading at 1.1010.

Day’s news (GMT +3):

  • 10:45 France: Gross Domestic Product (QoQ) (Q3), Consumer Spending (MoM) (Oct), Consumer Price Index (EU norm) (MoM) (Nov).
  • 11:00 Switzerland: KOF Leading Indicator (Nov).
  • 11:55 Germany: Unemployment Rate s.a. (Nov).
  • 12:30 UK: Net Lending to Individuals (MoM) (Oct), M4 Money Supply (MoM) (Oct), Mortgage Approvals (Oct).
  • 13:00 Eurozone: Consumer Price Index – Core (YoY) (Nov), Unemployment Rate (Oct).
  • 16:30 Canada: Gross Domestic Product Annualized (QoQ) (Q3), Industrial Product Price (MoM) (Oct).

291119

Current situation:

The market continues to be influenced by news coming out of the UK, Hong Kong and China. The pound sterling (GBP) is being temporarily boosted by YouGov, a company which publishes the results of public opinion polls ahead of parliamentary elections, which will be held on December 12. The latest results point heavily towards a Conservative Party parliamentary majority. GBP will hope to find a foothold on the back of this news.

The “trade war” between China and the United States also remains in the focus of market players. Investors fear that the Chinese could pull out of the deal in protest after US President Donald Trump signed a law aimed at supporting protesters in Hong Kong. China condemned the actions of the United States, but is keeping its hand close to its chest as the trade agreement negotiations draw to a close.

Today is a shorter working day in the US. Most likely, trading activity will remain at a low level. No forecast was made, as bulls can still bump the price to 1.1030. Yesterday, resistance was met at the 22nd degree and it’s fair to say that main level for upwards correction is at the 45th degree ­- 1.1044.

By Alpari.com

Ichimoku Cloud Analysis 28.11.2019 (AUDUSD, NZDUSD, USDCAD)

Article By RoboForex.com

AUDUSD, “Australian Dollar vs US Dollar”

AUDUSD is trading at 0.6765; the instrument is moving below Ichimoku Cloud, thus indicating a descending tendency. The markets could indicate that the price may test the cloud’s downside border at 0.6780 and then resume moving downwards to reach 0.6685. Another signal to confirm further descending movement is the price’s rebounding from the resistance level. However, the scenario that implies further decline may be canceled if the price breaks the cloud’s upside border and fixes above 0.6830. In this case, the pair may continue growing towards 0.6915.

AUDUSD
Risk Warning: the result of previous trading operations do not guarantee the same results in the future

NZDUSD, “New Zealand Dollar vs US Dollar”

NZDUSD is trading at 0.6421; the instrument is moving above Ichimoku Cloud, thus indicating an ascending tendency. The markets could indicate that the price may test the cloud’s upside border at 0.6405 and then resume moving upwards to reach 0.6525. Another signal to confirm further ascending movement is the price’s rebounding from the rising channel’s downside border. However, the scenario that implies further growth may be canceled if the price breaks the cloud’s downside border and fixes below 0.6355. In this case, the pair may continue falling towards 0.6275.

NZDUSD
Risk Warning: the result of previous trading operations do not guarantee the same results in the future

USDCAD, “US Dollar vs Canadian Dollar”

USDCAD is trading at 1.3289; the instrument is moving above Ichimoku Cloud, thus indicating an ascending tendency. The markets could indicate that the price may test the cloud’s downside border at 1.3265 and then resume moving upwards to reach 1.3405. Another signal to confirm further ascending movement is the price’s rebounding from the rising channel’s downside border. However, the scenario that implies further growth may be canceled if the price breaks the cloud’s downside border and fixes below 1.3220. In this case, the pair may continue falling towards 1.3135.

USDCAD

Article By RoboForex.com

Attention!
Forecasts presented in this section only reflect the author’s private opinion and should not be considered as guidance for trading. RoboForex LP bears no responsibility for trading results based on trading recommendations described in these analytical reviews.

Japanese Candlesticks Analysis 28.11.2019 (EURUSD, USDJPY)

Article By RoboForex.com

EURUSD, “Euro vs. US Dollar”

As we can see in the H4 chart, the descending tendency continues. After forming Shooting Star pattern, EURUSD has reversed and right now is still trading in the middle of the channel. We may assume that after finishing a slight correction the price may resume falling to reach 1.0950. However, one shouldn’t exclude a possibility that the price may continue growing towards 1.1057.

EURUSD
Risk Warning: the result of previous trading operations do not guarantee the same results in the future

USDJPY, “US Dollar vs. Japanese Yen”

As we can see in the H4 chart, the ascending tendency continues. By now, USDJPY has formed another reversal pattern, Shooting Star. Later, the pair may reverse and start a slight correction, which may be followed by further growth towards 109.85 to continue forming the ascending tendency. At the same time, the pair may choose another scenario and start a new decline to reach 108.75.

USDJPY

Article By RoboForex.com

Attention!
Forecasts presented in this section only reflect the author’s private opinion and should not be considered as guidance for trading. RoboForex LP bears no responsibility for trading results based on trading recommendations described in these analytical reviews.

The Analytical Overview of the Main Currency Pairs on 2019.11.28

by JustForex

The EUR/USD currency pair

Technical indicators of the currency pair:
  • Prev Open: 1.10157
  • Open: 1.09992
  • % chg. over the last day: -0.14
  • Day’s range: 1.10056 – 1.10126
  • 52 wk range: 1.0884 – 1.1623

The EUR/USD currency pair is still consolidating. There is no defined trend. The local support and resistance levels are 1.10000 and 1.10250, respectively. Mixed US economic data was released yesterday. Thus, US GDP (q/q) grew in the third quarter by 2.1% instead of the expected growth of 1.9%. The number of initial applications for unemployment benefits fell to 213K instead of 223K. However, the index of incomplete sales in the real estate market fell in October by 1.7%, while experts expected an increase of 0.2%. According to the Beige Book, the US economy is growing at a moderate pace. Today, volatility is reduced as US financial markets are closed due to Thanksgiving. We recommend opening positions from key levels.

The Economic News Feed for 28.11.2019 is calm.

EUR/USD

The indicators do not give accurate signals: the price crossed 50 MA.

The MACD histogram is near the 0 mark, which also does not give signals.

Stochastic Oscillator is near the overbought zone, the %K line is above the %D line, which gives a weak signal to buy EUR/USD.

Trading recommendations
  • Support levels: 1.10000, 1.09850
  • Resistance levels: 1.10250, 1.10500, 1.10800

If the price consolidates below the round level of 1.10000, expect the quotes to fall toward 1.09700-1.09600.

Alternatively, the quotes could grow toward 1.10400-1.10600.

The GBP/USD currency pair

Technical indicators of the currency pair:
  • Prev Open: 1.28542
  • Open: 1.28542
  • % chg. over the last day: +0.49
  • Day’s range: 1.28332 – 1.28464
  • 52 wk range: 1.1959 – 1.3385

The GBP/USD currency pair began to win back losses. During yesterday’s and today’s trading, GBP/USD quotes rose by more than 85 points. This movement is largely due to technical factors. Market participants are waiting for new information regarding the Brexit process. At the moment, the key support and resistance levels are: 1.29200 and 1.29500, respectively. We recommend opening positions from these marks. GBP can grow further.

The Economic News Feed for 28.11.2019 is calm.

GBP/USD

Indicators point to the power of buyers: the price is trading above 50 MA and 100 MA.

The MACD histogram is in the positive zone and above the signal line, which gives a strong signal to buy GBP/USD.

The Stochastic Oscillator is in the neutral zone, the %K line crossed the %D line. There are no signals at this time.

Trading recommendations
  • Support levels: 1.29200, 1.28950, 1.28700
  • Resistance levels: 1.29500, 1.29800

If the price consolidates above 1.29500, expect further growth toward 1.30000.

Alternatively, the quotes could descend toward 1.28950-1.28700

The USD/CAD currency pair

Technical indicators of the currency pair:
  • Prev Open: 1.32712
  • Open: 1.32821
  • % chg. over the last day: +0.11
  • Day’s range: 1.32900 – 1.32949
  • 52 wk range: 1.2727 – 1.3664

The technical picture on the USD/CAD currency pair is still ambiguous. CAD is trading in a protracted flat. At the moment, the local support and resistance levels are: 1.32800 and 1.33000, respectively. Participants in financial markets expect additional drivers. Today, volatility will be reduced due to the holiday in the United States. We recommend paying attention to the dynamics of oil quotes. Open positions from key levels.

The Economic News Feed for 28.11.2019 is calm.

USD/CAD

Indicators do not give accurate signals: the price crossed 50 MA and 100 MA.

The MACD histogram is in the positive zone and above the signal line, which gives a strong signal to buy USD/CAD.

The Stochastic Oscillator is in the neutral zone, the %K line crosses %D. There are no signals at this moment.

Trading recommendations
  • Support levels: 1.32800, 1.32650, 1.32400
  • Resistance levels: 1.33000, 1.33200, 1.33350

If the price consolidates above the round level of 1.33000, expect further growth toward 1.33200-1.33400.

Alternatively, the quotes could descend toward 1.32600-1.32400.

The USD/JPY currency pair

Technical indicators of the currency pair:
  • Prev Open: 109.034
  • Open: 109.549
  • % chg. over the last day: +0.30
  • Day’s range: 109.374 – 109.446
  • 52 wk range: 104.97 – 114.56

The USD/JPY currency pair continued to rise. The trading tool again updated local highs. At the moment, USD/JPY quotes are consolidating. The key support and resistance levels are 109.350 and 109.600, respectively. In the near future, technical correction is possible. We recommend you to keep track of current information regarding trade negotiations between the United States and China. Open positions from key levels.

The Economic News Feed for 28.11.2019 is calm.

USD/JPY

Indicators point to the strength of buyers: the price has fixed above 50 MA and 100 MA.

The MACD histogram is in the positive zone, but below the signal line, which gives a weak signal to buy USD/JPY.

The Stochastic Oscillator is in the neutral zone, the %K line is below the %D line, which gives a signal to sell USD/JPY.

Trading recommendations
  • Support levels: 109.350, 109.200, 109.050
  • Resistance levels: 109.600, 110.000

If the price consolidates above 109.600, expect further growth toward 110.000.

If the USD/JPY quotes fall below 109.350, the quotes will reach 109.200-109.000.

by JustForex

Donald Trump Has Signed Bills Supporting Hong Kong Protesters

by JustForex

The US dollar is being traded without significant changes against a basket of currencies. Yesterday, the dollar index (#DX) closed in the positive zone (+0.12%). However, market tensions increased due to a new decision by US President D. Trump. So, yesterday, the official signed two bills that support protesters in Hong Kong. This step may significantly complicate trade negotiations with China. The Ministry of Foreign Affairs of the People’s Republic of China threatens to take strict measures, calling any attempt to interfere in Hong Kong’s affairs “doomed to fail.”

Mixed US economic data were also released yesterday. Thus, US GDP (q/q) grew in the third quarter by 2.1% instead of the expected growth by 1.9%. Initial jobless claims fell to 213K instead of 223K. However, pending home sales fell by 1.7% in October, while experts expected an increase by 0.2%. According to the Beige Book, the US economy is growing at a moderate pace.

Today, US financial markets are closed due to Thanksgiving. Market volatility may be reduced.

The “black gold” prices are declining. Currently, futures for the WTI crude oil are testing the $57.70 mark per barrel.

Market Indicators

Yesterday, there was the bullish sentiment in the US stock market: #SPY (+0.45%), #DIA (+0.20%), #QQQ (+0.70%).

The 10-year US government bonds yield has increased slightly. At the moment, the indicator is at the level of 1.76-1.77%.

The Economic News Feed for 28.11.2019:
  • Today, the publication of important economic news is not expected.

by JustForex

Forex Technical Analysis & Forecast 27.11.2019 (EURUSD, GBPUSD, USDCHF, USDJPY, AUDUSD, USDRUB, USDCAD, GOLD, BRENT, BTCUSD)

Article By RoboForex.com

EURUSD, “Euro vs US Dollar”

After finishing the correction at 1.1024 and then falling towards 1.1014, EURUSD is consolidating inside Triangle pattern. If later the price breaks this range to the upside at 1.1024, the market may continue the correction towards 1.1035; if to the downside at 1.1007 – resume trading inside the downtrend with the target at 1.0984.

EURUSD
Risk Warning: the result of previous trading operations do not guarantee the same results in the future

GBPUSD, “Great Britain Pound vs US Dollar”

GBPUSD has broken 1.2874 to the downside; right now, it is consolidating around 1.2854. The main scenario implies that the price may continue trading inside the downtrend to reach 1.2798 and then start another correction to return to 1.2854. After that, the instrument may form a new descending structure with the short-term target at 1.2780.

GBPUSD
Risk Warning: the result of previous trading operations do not guarantee the same results in the future

USDCHF, “US Dollar vs Swiss Franc”

USDCHF is still consolidating around 0.9974 without any particular direction. Possibly, today the pair may expand the range towards 0.9987 and then fall to return to 0.9974. If later the price breaks this range to the upside, the market may form one more ascending structure towards 0.9999; if to the downside – start a new correction with the target at 0.9932.

USDCHF
Risk Warning: the result of previous trading operations do not guarantee the same results in the future

USDJPY, “US Dollar vs Japanese Yen”

USDJPY has almost reached its correctional target. Today, the pair may continue growing towards 109.16 and then start a new decline to reach 109.01, thus forming another consolidation range. If later the price breaks this range to the downside, the market may form the third descending wave with the short-term target at 108.60.

USDJPY
Risk Warning: the result of previous trading operations do not guarantee the same results in the future

AUDUSD, “Australian Dollar vs US Dollar”

AUDUSD has returned to 0.6791; right now, it is consolidating around this level. Possibly, today the pair may form a new descending structure to reach 0.6763. Later, the market may continue trading upwards with the target at 0.6791.

AUDUSD
Risk Warning: the result of previous trading operations do not guarantee the same results in the future

USDRUB, “US Dollar vs Russian Ruble”

USDRUB is still consolidating around 64.04. Possibly, the pair may expand the range both ways towards 63.88 and 64.17 respectively. After that, the instrument may break it to the downside and fall with the target at 63.61.

USDRUB
Risk Warning: the result of previous trading operations do not guarantee the same results in the future

USDCAD, “US Dollar vs Canadian Dollar”

USDCAD has broken 1.3290 downwards. Possibly, the pair may continue falling with the short-term target at 1.3265. Later, the market may start a new correction to return to 1.3290.

USDCAD
Risk Warning: the result of previous trading operations do not guarantee the same results in the future

XAUUSD, “Gold vs US Dollar”

After completing another descending structure at 1450.35, Gold has returned to 1461.50; right now, it is moving downwards again. Possibly, the pair may reach 1446.84 and then return to 1461.50. Later, the market may start another decline with the target at 1444.00.

GOLD
Risk Warning: the result of previous trading operations do not guarantee the same results in the future

BRENT

Brent has broken 63.72. Possibly, the pair may grow to break 64.18 and then continue trading upwards to reach 64.50. After that, the instrument may start a new correction to return to 63.72 and then form one more ascending structure with the target at 65.60.

BRENT
Risk Warning: the result of previous trading operations do not guarantee the same results in the future

BTCUSD, “Bitcoin vs US Dollar”

BTCUSD is consolidating around 7081.00. Today, the pair may start another decline towards 6930.00 and then continue trading upwards to return to 7081.00. Later, the market may form a new descending structure with the short-term target at 6864.00.

BITCOIN

Article By RoboForex.com

Attention!
Forecasts presented in this section only reflect the author’s private opinion and should not be considered as guidance for trading. RoboForex LP bears no responsibility for trading results based on trading recommendations described in these analytical reviews.

Murrey Math Lines 27.11.2019 (USDJPY, USDCAD)

Article By RoboForex.com

USDJPY, “US Dollar vs. Japanese Yen”

As we can see in the H4 chart, USDJPY is moving above 5/8. In this case, the price is expected to test the resistance at 8/8, rebound from it, and then resume falling to reach the support at 6/8. However, this scenario may no longer be valid if the price breaks 8/8 to the upside. After that, the instrument may start a new growth towards the resistance at +2/8.

USDJPY_H4
Risk Warning: the result of previous trading operations do not guarantee the same results in the future

In the M15 chart, the pair may break the downside line of the VoltyChannel indicator and, as a result, continue trading downwards.

USDJPY_M15
Risk Warning: the result of previous trading operations do not guarantee the same results in the future

USDCAD, “US Dollar vs Canadian Dollar”

As we can see in the H4 chart, USDCAD is moving above 5/8 as well. In this case, the pair is expected to break 6/8 and then continue growing to reach the resistance at 8/8. However, this scenario may no longer be valid if the price breaks the support at 5/8. After that, the instrument may continue falling towards 3/8.

USDCAD_H4
Risk Warning: the result of previous trading operations do not guarantee the same results in the future

In the M15 chart, the pair may break the upside line of the VoltyChannel indicator and, as a result, continue moving upwards to reach 8/8 from the H4 chart.

USDCAD_M15
Risk Warning: the result of previous trading operations do not guarantee the same results in the future

Article By RoboForex.com

Attention!
Forecasts presented in this section only reflect the author’s private opinion and should not be considered as guidance for trading. RoboForex LP bears no responsibility for trading results based on trading recommendations described in these analytical reviews.

Crypto haters’ Bitcoin cynicism is placing them on the wrong side of history

By George Prior

The price of Bitcoin has dropped in recent weeks, but cryptocurrencies are redefining and reshaping the financial system and their influence is growing. Denying this puts you on the wrong side of history.

This is the unequivocal message from the founder and CEO of one of the world’s largest independent financial advisory organizations.

Nigel Green, chief executive of deVere Group, is speaking out as the price of Bitcoin, the largest cryptocurrency by market cap, has fallen 6 per cent since the beginning of the month, prompting many critics to launch tirades against digital money.

Indeed, on Tuesday NYU Economist Nouriel Roubini declared there to be a ‘total crypto-apocalypse.’

Mr Green comments: “Many crypto critics are becoming radicalized in their attacks.

“The reality is that there are peaks and troughs in all financial markets, the cryptocurrency market is not – and should not be – any different.

“Yet each time there is a dip in the market or a bout of volatility in cryptocurrencies, the crypto haters declare that digital currencies are finished – only for them to subsequently experience a rally.

“The same people do not make such extreme and unfounded statements with most other financial markets. I would suggest that most people saying these things do not understand the crypto sector as it is relatively young and/or have vested interests in older, traditional ones.”

He continues: “However, whether they like it or not, dyed-in-the-wool financial traditionalists need to accept that cryptocurrencies are here to stay.

“The world has changed in three significant ways that support the rise of cryptocurrencies.

“First, technological advancement. We are adopting more and more technology into our lives.  And the rate at which we’re doing so is increasing rapidly.

“Second, political shifts. There is an appetite, a huge and growing one, for currencies that are not controlled by central banks and governments.  Supporters believe that these digital currencies are part of the antidote to what they see as the ills caused by the traditional system.

“And third, globalization.  We’re all becoming increasingly interdependent and internationally-minded, and this, when harnessed properly, is an immensely positive force for trade, commerce and prosperity across the world.”

The deVere CEO concludes: “Temporary market dips or bouts of volatility can have negative outcomes, but to believe they are necessarily and entirely negative is misguided.

“In the crypto market, as in all financial markets, movements of this nature create important buying opportunities and can be capitalised upon by investors for their long-term financial gain.  Using them effectively can be a very rewarding strategy.

About:

deVere Group is one of the world’s largest independent advisors of specialist global financial solutions to international, local mass affluent, and high-net-worth clients.  It has a network of more than 70 offices across the world, over 80,000 clients and $12bn under advisement

The Analytical Overview of the Main Currency Pairs on 2019.11.27

Article By RoboForex.com

The EUR/USD currency pair

Technical indicators of the currency pair:
  • Prev Open: 1.10129
  • Open: 1.10157
  • % chg. over the last day: +0.08
  • Day’s range: 1.10029 – 1.10141
  • 52 wk range: 1.0884 – 1.1623

The EUR/USD currency pair is still consolidating. There is no defined trend. The local support and resistance levels are 1.10000 and 1.10250, respectively. Investors continue to monitor the settlement of the trade conflict between Washington and Beijing. Donald Trump said yesterday that the parties are in the final stage of concluding the first stage of a trade agreement. Today, the US will release important economic statistics. We recommend opening positions from key levels.

The Economic News Feed for 27.11.2019:

  • – Durable Goods Orders (US) – 15:30 (GMT+2:00);
  • – GDP Report (US) – 15:30 (GMT+2:00);
  • – Incomplete Real Estate Sales (US) – 17:00 (GMT+2:00);
  • – Beige Book (US) – 21:00 (GMT+2:00);
EUR/USD

The price fixed below 50 MA and 100 MA, which signals the power of the sellers.

The MACD histogram has gone down, which gives a signal to sell EUR/USD.

The Stochastic Oscillator is near the oversold zone, the %K line crossed the %D line. There are no signals at the moment.

Trading recommendations
  • Support levels: 1.10000, 1.09850
  • Resistance levels: 1.10250, 1.10500, 1.10800

If the price consolidates below the round level of 1.10000, expect the quotes to fall toward 1.09700-1.09600.

Alternatively, the quotes can grow toward 1.10400-1.10600.

The GBP/USD currency pair

Technical indicators of the currency pair:
  • Prev Open: 1.28982
  • Open: 1.28542
  • % chg. over the last day: -0.30
  • Day’s range: 1.28332 – 1.28464
  • 52 wk range: 1.1959 – 1.3385

The GBP / USD currency pair again went down. Sterling reached key extremes. Currently, local support levels are: 1.28300 and 1.28600, respectively. Demand for the US dollar is recovering amid news of a possible trade deal between the US and China. Investors are awaiting new information regarding the Brexit process. Today we recommend paying attention to economic data from the USA. Open positions from key levels.

The Economic News Feed for 27.11.2019 is calm.

GBP/USD

Indicators point to the power of sellers: the price is trading below 50 MA and 100 MA.

The MACD histogram is in the negative zone and below the signal line, which gives a strong signal to sell GBP/USD.

The Stochastic Oscillator is in the neutral zone, the %K line crosses the %D line. There are no signals at the moment.

Trading recommendations
  • Support levels: 1.28300, 1.28000, 1.27700
  • Resistance levels: 1.28600, 1.28950, 1.29250

If the price consolidates below 1.28300, expect further drop toward 1.28000-1.27700.

Alternatively, the quotes can grow toward 1.28850-1.29000.

The USD/CAD currency pair

Technical indicators of the currency pair:
  • Prev Open: 1.32954
  • Open: 1.32712
  • % chg. over the last day: -0.21
  • Day’s range: 1.32709 – 1.32774
  • 52 wk range: 1.2727 – 1.3664

During yesterday’s trades, the USD/CAD currency pair kept key extremes and started to decline. At the moment, the quotes are testing the support level of 1.32600. 1.32850 is the nearest resistance. We do not exclude a further decline in the trading instrument. We expect the release of important statistics. Open positions from key levels.

The Economic News Feed for 27.11.2019 is calm.

USD/CAD

The price fixed below 100 MA, which signals the strength of sellers.

The MACD histogram is in the negative zone and continues to decline, which gives a strong signal to sell USD/CAD.

The Stochastic Oscillator is in the neutral zone, the %K line is below the %D line, which also indicates a bearish sentiment.

Trading recommendations
  • Support levels: 1.32600, 1.32350, 1.32150
  • Resistance levels: 1.32850, 1.33000, 1.33250

If the price consolidates below 1.32600, expect the quotes to drop toward 1.32400-1.32200.

Alternatively, the quotes could grow toward 1.33000-1.33200.

The USD/JPY currency pair

Technical indicators of the currency pair:
  • Prev Open: 108.923
  • Open: 109.034
  • % chg. over the last day: +0.17
  • Day’s range: 109.153 – 109.194
  • 52 wk range: 104.97 – 114.56

The USD/JPY currency pair remains bullish. The trading tool has updated local highs once more. At the moment, the quotes are testing resistance at 109.200. Round level 109.00 is the immediate support. Demand for safe haven currencies remains at a rather low level against the backdrop of the prospects for resolving the trade conflict between the US and China. We recommend that you pay attention to the dynamics of yield on US government bonds. Open positions from key levels.

The Economic News Feed for 27.11.2019 is calm.

USD/JPY

Indicators point to the power of buyers: the price has fixed above 50 MA and 100 MA.

The MACD histogram is in the positive zone, above the signal line, which gives a strong signal to buy USD / JPY.

The Stochastic Oscillator is near the overbought zone, the %K line crosses the %D line. There are no signals.

Trading recommendations
  • Support levels: 109.000, 108.850, 108.700
  • Resistance levels: 109.200, 109.500

If the price consolidates above 109.200, expect the quotes to rise toward 109.400-109.600.

Alternatively, the quotes could fall below 109.000 and eventually reach 108.850-108.700.

Article By RoboForex.com

Attention!
Forecasts presented in this section only reflect the author’s private opinion and should not be considered as guidance for trading. RoboForex LP bears no responsibility for trading results based on trading recommendations described in these analytical reviews.

Currency Majors Show Mixed Trends. We Expect US economic releases

by JustForex

The US dollar is being traded without significant changes against a basket of currencies. Yesterday, the dollar index (#DX) closed in the negative zone (-0.07%). Investors also expect important US economic statistics to be released today.

Persisting optimism regarding the early resolution of the US-China trade conflict supports the US dollar. Donald Trump said the night before that Washington was in the final stages of work on a trade agreement with China, after a telephone conversation between representatives of both countries on Tuesday.

At the same time, the US President drew attention to the fact that the United States intended to support the protesters in Hong Kong, and it could strain relations with China. It should be also recalled that Washington will impose additional duties on Chinese imports on December 15, if both sides do not reach an agreement by this time.

The “black gold” prices show positive dynamics. Currently, futures for the WTI crude oil are testing the $58.55 mark per barrel. At 17:30 (GMT+2:00), US crude oil inventories will be published.

Market Indicators

Yesterday, there was the bullish sentiment in the US stock market: #SPY (+0.23%), #DIA (+0.20%), #QQQ (+0.19%).

The 10-year US government bonds yield has decreased slightly. At the moment, the indicator is at the level of 1.74-1.75%.

The Economic News Feed for 27.11.2019:
  • – Core durable goods orders in the US at 15:30 (GMT+2:00);
  • – US GDP data at 15:30 (GMT+2:00);
  • – Pending home sales in the US at 17:00 (GMT+2:00);
  • – Fed’s Beige Book at 21:00 (GMT+2:00).

by JustForex