Author Archive for InvestMacro – Page 127

The US Dollar Won Back Part of the Losses

by JustForex

On Friday, the US dollar strengthened against a basket of major currencies. The dollar index (#DX) closed yesterday in the green zone (+0.30%). Optimistic data on the US labor market published on Friday supported the greenback. Thus, the number of people employed in the nonfarm sector of the United States grew by 266K instead of 186K. The unemployment rate counted to 3.5% instead of the forecasted value of 3.6%. At the moment, investors expect the US President Trump’s decision regarding the introduction of new tariffs for China, which is scheduled for December 15.

The British pound strengthened against the US dollar. On Thursday, December 12, general elections will be held in the British Parliament regarding the Brexit issue. The currency was supported amid expectations that the Conservative Party of British Prime Minister Boris Johnson would receive an absolute majority in the election.

The “black gold” prices are falling after growth the day before. Currently, futures for the WTI crude oil are testing the $58.65 mark per barrel.

Market Indicators

On Friday, there was the bullish sentiment in the US stock market: #SPY (+0.91%), #DIA (+1.20%), #QQQ (+1.07%).

The 10-year US government bonds yield has risen. At the moment, the indicator is at the level of 1.82-1.83%.

The Economic News Feed for 09.12.2019:
  • – Japan’s GDP data at 02:50 (GMT+2:00).

by JustForex

The Analytical Overview of the Main Currency Pairs on 2019.12.09

by JustForex

The EUR/USD currency pair

Technical indicators of the currency pair:
  • Prev Open: 1.10773
  • Open: 1.10582
  • % chg. over the last day: -0,41
  • Day’s range: 1.10612 – 1.10650
  • 52 wk range: 1,0884 – 1,1623

During Friday’s trading, the EUR/USD quotes fell. An optimistic report on the US labor market were published on Friday, which propped up the USD. Thus, the number of employees in the non-agricultural sector of the United States grew by 266K instead of 186K. The unemployment rate was 3.5% instead of the predicted value of 3.6%. Currently, the key support and resistance levels are 1.10550 and 1.10800, respectively. Open positions from these marks.

The Economic News Feed for 09.12.2019 is calm.

EUR/USD

Indicators indicate the strength of sellers: the price is being traded below 50 MA and 100 MA.

The MACD histogram is in the negative zone, but above the signal line, which gives a weak signal to sell EUR/USD.

The Stochastic Oscillator is in the overbought zone, the %K line is above the %D line, which gives a weak signal to buy EUR/USD.

Trading recommendations
  • Support levels: 1.10550, 1.10300, 1.10000
  • Resistance levels: 1.10800, 1.11050

If the price consolidates below 1.10550, expect the quotes to descend toward 1.10000

Alternative ly, the price could fix above 1.10800 amd rise toward 1.11050-1.11300.

The GBP/USD currency pair

Technical indicators of the currency pair:
  • Prev Open: 1.31622
  • Open: 1.31350
  • % chg. over the last day: -0.15
  • Day’s range: 1.31506 – 1.31580
  • 52 wk range: 1.1959 – 1.3385

GBP/USD does not show a defined trend. Participants in financial markets are waiting for a vote in the UK parliament on the Brexit issue, due on December 12th. At the moment, the key support level is 1.31400. The key resistance level is 1.31800. We recommend opening positions from these marks.

The Economic News Feed for 09.12.2019 is calm.

GBP/USD

Indicators point to a bullish sentiment: the price is being traded above 50 MA and 100 MA.

The MACD histogram is in the positive zone, above the signal line, which gives a strong signal to buy GBP/USD.

The Stochastic Oscillator is near the overbought zone, the %K line crossed the %D line. There are no signals.

Trading recommendations
  • Support levels: 1.31400, 1.30900, 1.30500
  • Resistance levels: 1.31800, 1.32000

If the price consolidates above 1.31800, expect the quotes to rise toward 1.32000.

Alternatively, the quotes could fix below 1.31400 and the pair could decline toward 1.30900-1.30700.

The USD/CAD currency pair

Technical indicators of the currency pair:
  • Prev Open: 1.31781
  • Open: 1.32520
  • % chg. over the last day: +0.62
  • Day’s range: 1.32608 – 1.32650
  • 52 wk range: 1.2727 – 1.3664

During Friday’s trading, the USD/CAD quotes increased significantly. The trading instrument grew by almost 100 points. The USD was supported by optimistic economic reports. Quotes are currently being consolidated. Investors expect additional drivers. The local support and resistance levels are 1.32300 and 1.32700, respectively. We recommend paying attention to the dynamics of oil prices. Open positions from key levels.

The Economic News Feed for 09.12.2019 is calm.

USD/CAD

Indicators point to a bullish sentiment: the price is being traded above 50 MA and 100 MA.

The MACD histogram is in the positive zone, but below the signal line, which gives a weak signal to buy USD/CAD.

The Stochastic Oscillator is in the neutral zone, the %K line is above the %D line, which also gives a signal to buy USD/CAD.

Trading recommendations
  • Support levels: 1.32300, 1.31900, 1.31600
  • Resistance levels: 1.32700, 1.33000

If the price consolidates above 1.32700, expect further growth toward 1.33000.

Alternatively, the quotes could descend toward 1.32300-1.32100.

The USD/JPY currency pair

Technical indicators of the currency pair:
  • Prev Open: 108.748
  • Open: 108.360
  • % chg. over the last day: -0.14
  • Day’s range: 108.574 – 108.600
  • 52 wk range: 104.97 – 114.56

A variety of trends was observed on Friday on the USD/JPY currency pair. Investors are awaiting new information regarding US-China trade relations. Currently, the key support and resistance levels are 108.450 and 108.650, respectively. We also recommend that you pay attention to the dynamics of yield on US government bonds. Open positions from key levels.

During the Asian trading session, Japan published an optimistic GDP report.

USD/JPY

Indicators point to the strength of sellers: the price is being traded below 50 MA and 100 MA.

The MACD histogram is in the negative zone, below the signal line, which gives a strong signal to sell USD/JPY.

The Stochastic Oscillator is located near the oversold zone, the %K line crosses the %D line. There are no exact signals.

Trading recommendations
  • Support levels: 108.450, 108.250
  • Resistance levels: 108.650, 108.850, 109.150

If the price consolidates below the key support level of 108.450, expect the quotes to drop toward 108.250-108.100.

Alternatively, the quotes could grow toward 108.850-109.000.

by JustForex

DAX30 CFD bears have the advantage on their side below 13,200 points

By Admiral Markets

Economic Event 09 December 2019

Source: Economic Events 09 December 2019 – Admiral Markets’ Forex Calendar

With the economic calendar being thin into the start of the week, today we will look at the DAX30 CFD from a technical perspective.

After the drop below 13,000 points in the first half of last week, the German index recovered slightly into the weekly close. However, the bears have the advantage on their side as long as we trade below 13,180/200 points.

Below that level, another attempt to sustainably break below 13,000 points stays on the table, while a drop below the pre-weekly lows around 12,930 points activates the region around 12,800/830 points.

On the other hand: if bulls can recapture 13,180/200 (a move that may be induced by new trade dispute optimism), a move up to and above 13,300 points is an option, erasing most of the losses from last Monday.

DAX30 CFD - Hourly Chart

Source: Admiral Markets MT5 with MT5SE Add-on DAX30 CFD Hourly chart (between 19 November 2019 to 06 December 2019). Accessed: 06 December 2019 at 10:00 PM GMT

DAX30 CFD - Daily Chart

Source: Admiral Markets MT5 with MT5SE Add-on DAX30 CFD Daily chart (between 30 August 2018 to 06 December 2019). Accessed: 06 December 2019 at 10:00 PM GMT

Please note: Past performance is not a reliable indicator of future results, or future performance.

In 2014, the value of the DAX30 CFD increased by 2.65%, in 2015, it increased by 9.56%, in 2016 it increased by 6.87%, in 2017 it increased by 12.51%, in 2018 it fell by 18.26%, meaning that after five years, it was up by 10.5%.

Trade With MetaTrader 5

Disclaimer: The given data provides additional information regarding all analysis, estimates, prognosis, forecasts or other similar assessments or information (hereinafter “Analysis”) published on the website of Admiral Markets. Before making any investment decisions please pay close attention to the following:

  1. This is a marketing communication. The analysis is published for informative purposes only and are in no way to be construed as investment advice or recommendation. It has not been prepared in accordance with legal requirements designed to promote the independence of investment research, and that it is not subject to any prohibition on dealing ahead of the dissemination of investment research.
  2. Any investment decision is made by each client alone whereas Admiral Markets shall not be responsible for any loss or damage arising from any such decision, whether or not based on the Analysis.
  3. Each of the Analysis is prepared by an independent analyst (Jens Klatt, Professional Trader and Analyst, hereinafter “Author”) based on the Author’s personal estimations.
  4. To ensure that the interests of the clients would be protected and objectivity of the Analysis would not be damaged Admiral Markets has established relevant internal procedures for prevention and management of conflicts of interest.
  5. Whilst every reasonable effort is taken to ensure that all sources of the Analysis are reliable and that all information is presented, as much as possible, in an understandable, timely, precise and complete manner, Admiral Markets does not guarantee the accuracy or completeness of any information contained within the Analysis. The presented figures refer that refer to any past performance is not a reliable indicator of future results.
  6. The contents of the Analysis should not be construed as an express or implied promise, guarantee or implication by Admiral Markets that the client shall profit from the strategies therein or that losses in connection therewith may or shall be limited.
  7. Any kind of previous or modeled performance of financial instruments indicated within the Publication should not be construed as an express or implied promise, guarantee or implication by Admiral Markets for any future performance. The value of the financial instrument may both increase and decrease and the preservation of the asset value is not guaranteed.
  8. The projections included in the Analysis may be subject to additional fees, taxes or other charges, depending on the subject of the Publication. The price list applicable to the services provided by Admiral Markets is publicly available from the website of Admiral Markets.
  9. Leveraged products (including contracts for difference) are speculative in nature and may result in losses or profit. Before you start trading, you should make sure that you understand all the risks.

By Admiral Markets

OPEC+ Decisions Helped Oil Prices Reach Stability

By Dmitriy Gurkovskiy, Chief Analyst at RoboForex

On Monday, December 9th, Oil prices are correcting after skyrocketing last Friday. So far, Brent is trading at 64.18 USD, but earlier it tested the high at 64.87 reached on September 23rd.

OPEC and OPEC+ December meeting was over with a typical agreement signed by all parties to cut down the oil extraction in the first quarter of 2020. Most of all, it may influence Saudi Arabia and Russia. However, later Saudis announced that they were willingly ready to cut their share by additional 400 thousand barrels per day.

As a result, the total amount to be cut down by all members of OPEC+ is 2.1 million barrels.

Generally, these measures should make Oil prices more stable. The global economy is expected to continue slowing down early in 2020, while the oil production by the countries that aren’t members of the cartel will surely increase. This is exactly why these arrangements between OPEC+ countries will be helpful to avoid Oil oversupply.

The December agreement is expected to expire in March 2020, when the next meeting of OPEC+ is scheduled to take place.

As we can see in the H4 chart, Brent has broken 64.50 to the upside and may continue growing to reach 68.50 and form the third wave inside the uptrend. Today, the pair may reach 67.50 and then start another correction to return to 64.50. Later, the market may continue growing towards 68.00. From the technical point of view, this scenario is confirmed by MACD Oscillator: its signal line is moving upwards above 0, thus indicating further growth.

In the H1 chart, after breaking the consolidation range to the upside and expanding it towards 65.46 with a continuation pattern, Brent has returned to the breakout level; right now, it is still moving upwards. If later the price breaks 65.46, the instrument may continue growing to reach the short-term target at 66.80. From the technical point of view, this scenario is confirmed by Stochastic Oscillator: its signal line is moving above 50, thus directly indicating further growth.

Disclaimer

Any predictions contained herein are based on the authors’ particular opinion. This analysis shall not be treated as trading advice. RoboForex shall not be held liable for the results of the trades arising from relying upon trading recommendations and reviews contained herein.


EURUSD: support found around 67th degree

By Alpari.com

On Friday the 6th of December, the EURUSD price was down at the close of trading. The weakening of the single currency was the result of encouraging data being published, which concerned the US labour market. This reinforced the Fed’s position of maintaining the current level of interest rates at the upcoming meeting, scheduled to take place on Wednesday, December 11.

The number of jobs in the non-agricultural sector increased by 266,000 against the forecast of 180,000. The figure for September was revised from 180,000 to over 193,000, and October from 128,000 to 156,000. The revision totaled an increase of more than 41,000.

The unemployment rate dropped to 3.5% (forecast was 3.6%), wages decreased by 0.2% (forecast was 0.3% vs. the previous value of 0.4%). The proportion of economically active members of the population decreased to 63.2% from 63.3%. Once again, we note that there is no correlation between ADP and NFP.

The positive data regarding the US labour market was supported by the business activity index in Michigan, which was above the forecasted level. Statistics aroused optimism among stock market investors and supported the USD. The euro fell to 1.1040. The euro fell badly versus the Canadian dollar, because it was sold off across all crosses.

Day’s news (GMT+3):

  • 09:45 Switzerland: Unemployment Rate s.a (MoM) (Nov).
  • 10:00 Germany: Exports (MoM) (Oct).
  • 12:30 Eurozone: Sentix Investor Confidence (Dec).
  • 16:15 Canada: Housing Starts s.a (YoY) (Nov).
  • 16:30 Canada: Building Permits (MoM) (Oct).

091219

Current situation:

The fall stopped at around the 67th degree, after the currency fell 58 points. Similar data taken from the 2000s shows that back then, the price fluctuations were 250-300 points. At the time of writing, the euro is valued at 1.1061. According to the forecast, we are waiting for a correction to the balance line. If the price starts to wander around the area of ​​1.1068-1.1070, you need to look out for the activity of both the bulls and bears. If there is no quick recovery, then after 17:00 (GMT+3), we can expect the price to fall.

This week is full of important events. Britain and Japan will publish third quarter GDP data. The Fed, SNB and the ECB will hold meetings regarding interest rate levels. Then, after the meetings, ECB President K. Largad, SNB President T. Jordan and US Federal Reserve Chairman J. Powell will give press conferences.

Given that on Wednesday, the US Federal Reserve looks nailed on to maintain its current rates, and K. Largad generally adheres to a soft monetary policy, it can be assumed that by Thursday, the euro will still hit a new high. The 1.1025-1.1030 zone is a key support. If it holds up, we will see a sharp rebound upwards.

By Alpari.com

Ichimoku Cloud Analysis 06.12.2019 (AUDUSD, NZDUSD, USDCAD)

Article By RoboForex.com

AUDUSD, “Australian Dollar vs US Dollar”

AUDUSD is trading at 0.6842; the instrument is moving above Ichimoku Cloud, thus indicating an ascending tendency. The markets could indicate that the price may test Tenkan-Sen and Kijun-Sen at 0.6825 and then resume moving upwards to reach 0.6920. Another signal to confirm further ascending movement is the price’s rebounding from the support level. However, the scenario that implies further growth may be canceled if the price breaks the cloud’s downside border and fixes below 0.6755. In this case, the pair may continue falling towards 0.6695. After breaking Triangle’s upside border and fixing above 0.6865, the price may continue moving upwards.

AUDUSD
Risk Warning: the result of previous trading operations do not guarantee the same results in the future

NZDUSD, “New Zealand Dollar vs US Dollar”

NZDUSD is trading at 0.6557; the instrument is moving above Ichimoku Cloud, thus indicating an ascending tendency. The markets could indicate that the price may test Tenkan-Sen and Kijun-Sen at 0.6495 and then resume moving upwards to reach 0.6635. Another signal to confirm further ascending movement is the price’s rebounding from the support level. However, the scenario that implies further growth may be canceled if the price breaks the cloud’s downside border and fixes below 0.6425. In this case, the pair may continue falling towards 0.6335.

NZDUSD
Risk Warning: the result of previous trading operations do not guarantee the same results in the future

USDCAD, “US Dollar vs Canadian Dollar”

USDCAD is trading at 1.3181; the instrument is moving below Ichimoku Cloud, thus indicating a descending tendency. The markets could indicate that the price may test Tenkan-Sen and Kijun-Sen at 1.3225 and then resume moving downwards to reach 1.3105. Another signal to confirm further descending movement is the price’s rebounding from the descending channel’s upside border. However, the scenario that implies further decline may be canceled if the price breaks the cloud’s upside border and fixes above 1.3310. In this case, the pair may continue growing towards 1.3395.

USDCAD

Article By RoboForex.com

Attention!
Forecasts presented in this section only reflect the author’s private opinion and should not be considered as guidance for trading. RoboForex LP bears no responsibility for trading results based on trading recommendations described in these analytical reviews.

Fibonacci Retracements Analysis 06.12.2019 (BITCOIN, ETHEREUM)

Article By RoboForex.com

BTCUSD, “Bitcoin vs US Dollar”

As we can see in the daily chart, after finishing a quick correctional impulse, BTCUSD is forming a new descending wave, which has already reached 61.8% fibo and may start a new short-term correction to the upside. After completing it, the pair may resume falling towards the target at 76.0% (5700.00). At the same time, there is a convergence on MACD, which may indicate a more significant correction after the price reaches the target. The key mid-term downside target is the low at 3121.90. The resistance is 38.2% fibo at 9758.00.

BITCOIN
Risk Warning: the result of previous trading operations do not guarantee the same results in the future

The H4 chart shows more detailed structure of the current local correction. By now, the pair has managed to reach only 23.6% fibo, but may later continue growing towards 38.2% and 50.0% fibo at 8050.00 and 85.26.50 respectively. If the price breaks the local support at 6525.00, the correction will be over.

BTCUSD
Risk Warning: the result of previous trading operations do not guarantee the same results in the future

ETHUSD, “Ethereum vs. US Dollar”

As we can see in the daily chart, the downtrend has reached 76.0% fibo; right now, ETHUSD is expected to start a new correction. The resistance is 61.8% fibo at 189.00. After completing this short-term pullback, the instrument may continue falling towards the post-correctional extension area between 138.2 and 161.8% fibo at 134.50 and 123.70 respectively, and then the psychologically-crucial at 100.30.

ETHEREUM
Risk Warning: the result of previous trading operations do not guarantee the same results in the future

The H4 chart shows more detailed structure of the current correction, which has already reached 38.2% fibo. Later, the price may continue growing towards 50.0% fibo at 165.47. the support is the low at 132.02.

ETHUSD

Article By RoboForex.com

Attention!
Forecasts presented in this section only reflect the author’s private opinion and should not be considered as guidance for trading. RoboForex LP bears no responsibility for trading results based on trading recommendations described in these analytical reviews.

High Yield Bond and Transports Signal Gold Buy Signal

By TheTechnicalTraders.com

Technical Analysis is the theory that price relates all news, fundamental and correlative future expectations into current and recent price activity.  It is the theory that price is the ultimate indicator and that charts paint a very clear picture for those individuals that are capable of understanding the message that is being presented.

In this research article, we are going to highlight the technical analysis components that we believe are painting a very clear picture that an “early warning” signal is flashing very brightly in the US and Global markets right now.

Cross market analysis and methods of rationalizing true price rotation, valuation and trend become the foundation of most technical analysis.  Studies, technical indicators, advanced price theory and all the rest of the tools we use are ways for us to better understand what price is actually showing us.  Today, we are going to focus on Gold, High Yield Corporate Bonds, and the Transportation Index because combined they are telling us something big is close to happening.

Before you continue, take a second and join my free trend trade signals email list.

Gold is a safe-haven instrument that measures uncertainty, fear, greed and the future expectations related to a secure global market economy.  When a crisis, economic or other uncertainty fears are minimized, Gold tends to move lower or consolidate into a lower price range.  When fears, economic uncertainty or any type of crisis event is causing concerns for global investors, Gold then begins to move higher as a measure of protection from risk and fear of any type of crisis event.

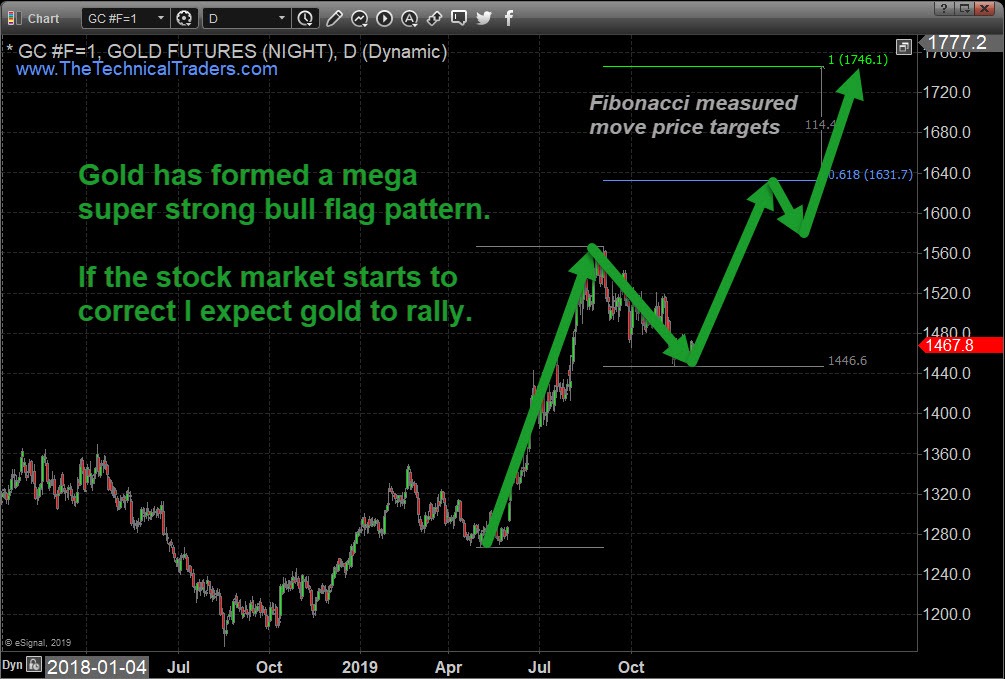
Price Of Gold – Bull Flag Within a Bull Market

Gold has recently rallied well above the $1400 level and formed a large Bullish Flag pattern.  The recent rally above $1400 confirmed the new Bullish Price Trend for Gold which indicates global investors are becoming more fearful of a crisis event or some other type of economic uncertainty.

We believe the next move high in Gold will push prices above the $1625 level, then above the $1745 level.  If that happens, we’ll know the fear of some type of crisis event is very real and that the Bullish major trend in Gold may continue for many years to come.

We just posted a much more detailed report on the new 7-year bull market starting for gold and mining stocks, which if you have not yet seen take a look at the charts.

As much as we like to think that Gold leads the market in terms of measuring fear and uncertainty, Corporate Bonds also share a role in the understanding and future expectations related to economic capacity.

If Corporate Bonds begin to sell-off before a major downside market trend begins, it represents a fear that future earnings and the ability to support/service corporate debt levels may be at risk.  The way I explain this to people is that it is like a ship “battening down the hatches” and securing the cargo before entering a major storm.

A Corporate Bond sell-off indicates that global investors believe the economy is grinding to a halt and that earnings going to decline – thus putting debt at risk of failure in the future and this is why investors sell their bonds, and they they typically move before the stock indexes do. Think of high yield bonds as a leading indicator by a few days.

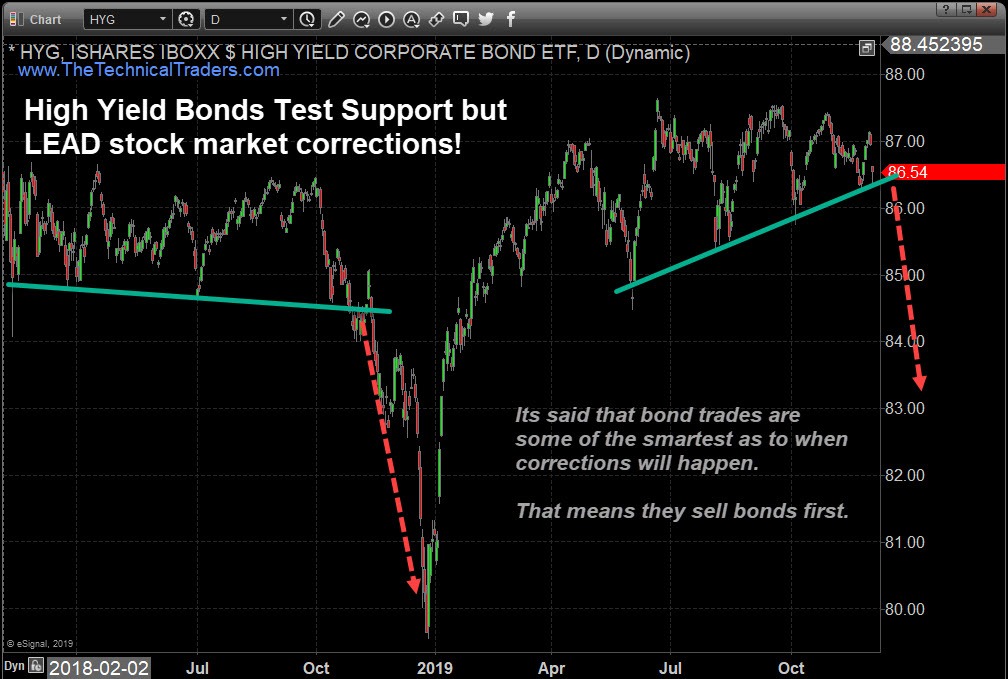
High Yield Corporate Bonds – Potential Major Breakdown

This HYG chart highlights the support channel in Corporate Bonds that appears to be at risk of being broken.  If a breakdown in price happens, this downside rotation in HYG would be a very clear warning that the US and global stock markets may be entering a serious price correction period.

If Bonds were to move dramatically lower while Gold rallied, we can only interpret this as fear has really begun to hit the markets and traders are panicking.

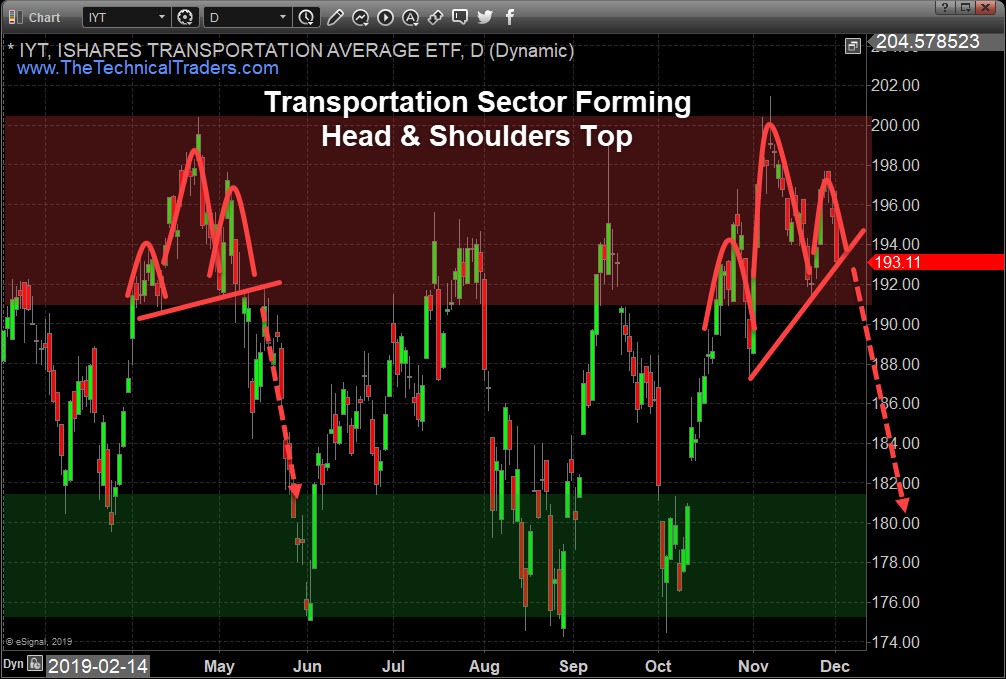
Transportation Index – Economic Leading Indicator

Lastly, take a look at this Transportation Index chart and pay very close attention to the Head-n-Shoulders pattern setup on the right side of the chart.  You’ll see a similar Head-n-Shoulders pattern in May 2019 – just before a moderate downside price rotation.

As we move into the end of this year with liquidity diminishing and volatility starting to increase, the potential for a dramatic price sell-off becomes even greater.  The lack of real market depth and liquidity, as well as this “early warning” set up in the charts, suggests a market breakdown event may be happening right before our eyes. It also may not happen, which is fine also.

As technical traders we do not require price to move in any one direction, we simply follow price and bet on the direction it’s moving. But if we do get a breakdown here it could be really exciting especially if you have a trade or two on the right side of the market.

The cross-market Technical Analysis and the chart patterns are suggesting that a peak has set up and that future expectations are much weaker than they were 14 to 18+ months ago.

We recently published this article highlighting some of our proprietary Indicators and Indexes suggesting this recent rally in the US stock market may have been a “euphoric zombie-land rally” with no real support behind it.

Dec 2, 2019: IS THE CURRENT RALLY A TRUE VALUATION RALLY OR EUPHORIA?

If our analysis is correct, and we get the drop in stocks, it could be a very big downside move.

We believe these charts confirm that price and Technical Analysis are screaming an “Early Warning” signal that price weakness is setting up in the US and global markets.  We believe the continued lack of liquidity throughout the Christmas holiday season may prompt a very big breakdown price move at any time in the near future.  When any one of these charts begins a price move to confirm these predicted setups, it won’t take long for the bigger major trends to follow-through.

As a technical analysis and trader since 1997, I have been through a few bull/bear market cycles. I believe I have a good pulse on the market and timing key turning points for both short-term swing trading and long-term investment capital. The opportunities are massive/life-changing if handled properly. This week we entered two new trades and it’s not too late to get into them before they run higher!

We’ll keep you informed as this plays out with Wealth Building & Global Financial Reset Newsletter if you like what I offer, join me with the 1 or 2-year subscription to lock in the lowest rate possible and ride my coattails as I navigate these financial market and build wealth while others lose nearly everything they own during the next financial crisis. Join Now and Get a Free 1oz Silver Round or Gold Bar Shipped To You!

Chris Vermeulen
Founder of Technical Traders Ltd.
TheTechnicalTraders.com


The US Dollar Is Declining due to Uncertainty in China-US Trade Relations

by JustForex

The US dollar is declining against a basket of major currencies during yesterday’s trading. The dollar index (#DX) closed yesterday in the red zone (-0.24%). The demand for “safe haven” currencies has grown due to the unclear situation concerning China-US trade relations. Financial market participants expect at least some news regarding the trade agreement between Beijing and Washington as on December 15 new tariffs on Chinese goods should come into force.

Yesterday, a positive report on the initial jobless claims was published in the US. So, the number of applications decreased to 203K, while experts expected 215K. Currently, financial market participants expect reports on the US labor market, which will be published today.

The British pound strengthened against the US dollar. Financial market participants expect elections in the UK Parliament on the Brexit issue to be held on December 12.

The “black gold” prices are consolidating. Currently, futures for the WTI crude oil are testing the $58.55 mark per barrel.

Market Indicators

Yesterday, there was the bullish sentiment in the US stock market: #SPY (+0.18%), #DIA (+0.11%), #QQQ (+0.20%).

The 10-year US government bonds yield is consolidating. At the moment, the indicator is at the level of 1.78-1.79%.

The Economic News Feed for 06.12.2019:
  • – Data on the US labor market at 15:30 (GMT+2:00);
  • – Data on the labor market in Canada at 15:30 (GMT+2:00).

by JustForex

The Analytical Overview of the Main Currency Pairs on 2019.12.06

by JustForex

The EUR/USD currency pair

Technical indicators of the currency pair:
  • Prev Open: 1.10773
  • Open: 1.11023
  • % chg. over the last day: +0.23
  • Day’s range: 1.11030 – 1.11055
  • 52 wk range: 1.0884 – 1.1623

During yesterday’s trading, the EUR/USD quotes went up. Yesterday a positive report was published on the number of initial applications for unemployment benefits in the United States. So, the number of applications decreased to 203K, while experts expected 215K. Currently, the key support and resistance levels are 1.10900 and 1.11200, respectively. Open positions from these marks. We recommend that you pay attention to the US labor market reports.

The Economic News Feed for 06.12.2019:

  • – Labour Market Report (US) – 15:30 (GMT+2:00);
EUR/USD

Indicators point to the strength of buyers: the price has fixed above 50 MA and 100 MA.

The MACD histogram is in the positive zone, but below the signal line, which gives a weak signal to buy EUR/USD.

Stochastic Oscillator is in the neutral zone, the %K line crossed the %D line. There are no signals.

Trading recommendations
  • Support levels: 1.10900, 1.10650, 1.10300
  • Resistance levels: 1.11200, 1.11500

If the price consolidates above the resistance level of 1.11200, expect further growth to 1.11500.

Alternatively, the quotes could consolidate below 1.10900 and descend toward 1.10650-1.10500.

The GBP/USD currency pair

Technical indicators of the currency pair:
  • Prev Open: 1.31032
  • Open: 1.31622
  • % chg. over the last day: +0.42
  • Day’s range: 1.31280 – 1.31600
  • 52 wk range: 1.1959 – 1.3385

During yesterday’s trading, the GBP/USD trading instrument increased slightly. Participants in financial markets expect a choice in the UK parliament on the Brexit issue, due on December 12th. At the moment, the key support level is 1.31000. The key resistance level is 1.30600. We recommend opening positions from these marks.

Today, we do not expect any news from UK.

GBP/USD

Indicators indicate bullish sentiment: the price is being traded above 50 MA and 100 MA.

The MACD histogram is in the positive zone, but below the signal line, which gives a weak signal to buy GBP/USD.

The Stochastic Oscillator is in the neutral zone, the %K line crossed the %D line. There are no signals.

Trading recommendations
  • Support levels: 1.31000, 1.30500, 1.30000
  • Resistance levels: 1.31600, 1.31800

If the price consolidates above 1.31600, expect further growth toward 1.32000.

Alternatively, the quotes will fix below 1.31000 and descend toward 1.30500-1.30300.

The USD/CAD currency pair

Technical indicators of the currency pair:
  • Prev Open: 1.32003
  • Open: 1.31781
  • % chg. over the last day: -0.20
  • Day’s range: 1.31716 – 1.31732
  • 52 wk range: 1.2727 – 1.3664

During yesterday’s trading, the trading tool USD/CAD slightly decreased. Canada released an optimistic economic reportyesterday, which supported the Canadian dollar. Thus, the Ivey business activity index (PMI) rose to 60.0 in November, although experts predicted a value of 53.8. At present, the local support and resistance levels are 1.31600 and 1.31900, respectively. We recommend paying attention to the dynamics of oil prices. Open positions from key levels.

Today at 15:30 (GMT+2:00) the data on the labor market of Canada will be published.

USD/CAD

Indicators point to a bearish sentiment: the price is trading below 50 MA and 100 MA.

The MACD histogram is in the negative zone, but above the signal line, which gives a weak signal to sell USD/CAD.

The Stochastic Oscillator is in the oversold zone, the %K line is below the %D line, which also gives a signal to sell USD/CAD.

Trading recommendations
  • Support levels: 1.31600, 1.31400
  • Resistance levels: 1.31900, 1.32300, 1.32700

If the price consolidates below 1.31600, expect further decline toward 1.31400-1.31200.

Alternatively, the quotes could grow toward 1.32300-1.32500.

The USD/JPY currency pair

Technical indicators of the currency pair:
  • Prev Open: 108.859
  • Open: 108.748
  • % chg. over the last day: -0.12
  • Day’s range: 108.574 – 108.600
  • 52 wk range: 104.97 – 114.56

The USD/JPY currency pair went down due to the uncertainty surrounding Sino-US trade relations. Investors are interested in buying a safe haven currency. Currently, the key support and resistance levels are 108.500 and 108.800, respectively. Participants in financial markets expect additional drivers. We also recommend that you pay attention to the dynamics of yield on US government bonds. The trading instrument has the potential to further decline. Open positions from key levels.

The Economic News Feed for 06.12.2019 is calm.

USD/JPY

Indicators point to the strength of sellers: the price is being traded below 50 MA and 100 MA.

The MACD histogram is in the negative zone, below the signal line, which gives a strong signal to sell USD/JPY.

The Stochastic Oscillator is in the oversold zone, the %K line crosses the %D line. There are no exact signals.

Trading recommendations
  • Support levels: 108.500, 108.250
  • Resistance levels: 108.800. 109.100, 109.500

If the price consolidates below the key support level of 108.500, expect the quotes to drop toward 108.250-108.100.

Alternatively, the quotes could grow toward 109.100-109.350.

by JustForex