Author Archive for InvestMacro – Page 128

Will today’s Non-Farm Payrolls follow ADP and push the USD/JPY below 108.00?

By Admiral Markets

Economic Event December

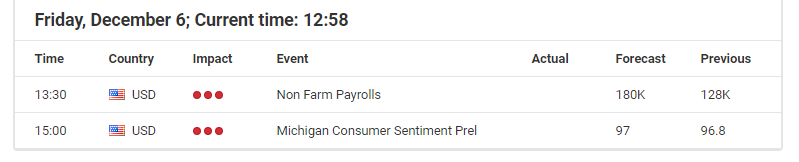
Source: Economic Events December 6, 2019 – Admiral Markets’ Forex Calendar

As we head towards the weekly close, our focus will be on the Non-Farm Payrolls, and by extension, the yield-sensitive currency pair, the USD/JPY.

After the drop back below 109.00, brought on by Monday’s announcement that US president Trump is to restore tariffs on steel and aluminium shipped from Brazil and Argentina, in addition to his administration proposing tariffs “up to 100%” on certain French goods (about $2.4 billion worth) in retaliation to France’s digital services tax, a risk-off kicked in and 10-year UST yields dropped alongside the USD/JPY.

In addition to that, mixed US data releases over the last days, such as the ADP (usually known as a solid indication of NFP performance) coming in at only 67,000 against an expected 140,000, made it likely for a disappointing NFP reading today, and a drop below 108.00 in the USD/JPY.

If Non-Farm Payrolls print below 150,000, the way that market participants priced the Fed to not move in regards to their interest rate level next week, could result in a sharper shift and bearish catalyst for the USD/JPY.

While we still don’t see the Fed shifting policy even if NFPs disappoint today, but increasingly dovish rhetoric becomes likely, and would drive the USD/JPY lower:

USDJPY-Daily Chart

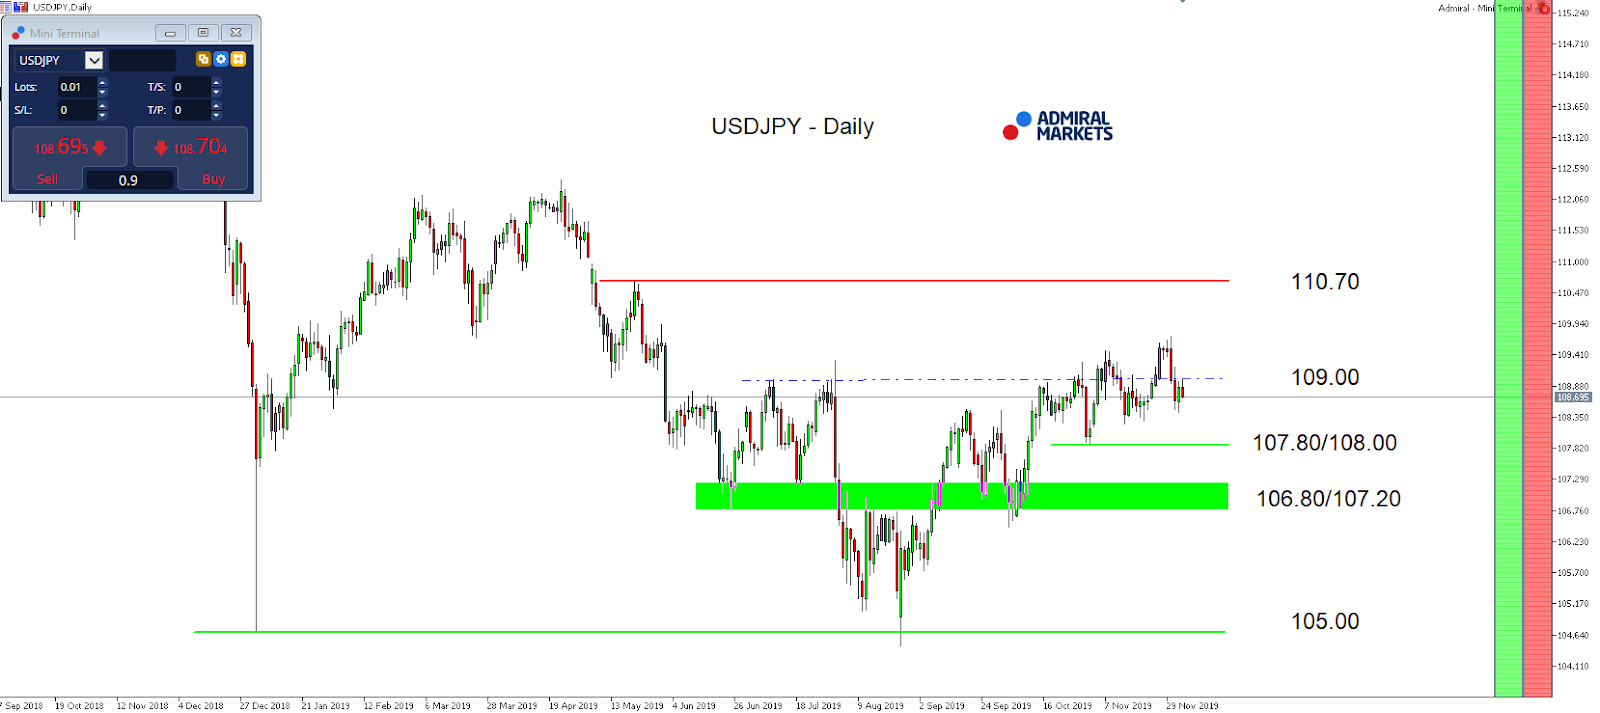
Source: Admiral Markets MT5 with MT5-SE Add-on USD/JPY Daily chart (between September 27, 2018, to December 5, 2019). Accessed: December 5, 2019, at 10:00pm GMT – Please note: Past performance is not a reliable indicator of future results, or future performance.

In 2014, the value of the USD/JPY increased by 13.7%, in 2015, it increased by 0.5%, in 2016, it fell by 2.8%, in 2017, it fell by 3.6%, in 2018, it fell by 2.7%, meaning that after five years, it was up by 4.1%.

Discover the world’s #1 multi-asset platform

Admiral Markets offers professional traders the ability to trade with a custom, upgraded version of MetaTrader 5, allowing you to experience trading at a significantly higher, more rewarding level. Experience benefits such as the addition of the Market Heat Map, so you can compare various currency pairs to see which ones might be lucrative investments, access real-time trading data, and so much more. Click the banner below to start your FREE download of MT5 Supreme Edition!

Download MetaTrader 5 and begin trading today!

Disclaimer: The given data provides additional information regarding all analysis, estimates, prognosis, forecasts or other similar assessments or information (hereinafter “Analysis”) published on the website of Admiral Markets. Before making any investment decisions please pay close attention to the following:

  1. This is a marketing communication. The analysis is published for informative purposes only and are in no way to be construed as investment advice or recommendation. It has not been prepared in accordance with legal requirements designed to promote the independence of investment research, and that it is not subject to any prohibition on dealing ahead of the dissemination of investment research.
  2. Any investment decision is made by each client alone whereas Admiral Markets shall not be responsible for any loss or damage arising from any such decision, whether or not based on the Analysis.
  3. Each of the Analysis is prepared by an independent analyst (Jens Klatt, Professional Trader and Analyst, hereinafter “Author”) based on the Author’s personal estimations.
  4. To ensure that the interests of the clients would be protected and objectivity of the Analysis would not be damaged Admiral Markets has established relevant internal procedures for prevention and management of conflicts of interest.
  5. Whilst every reasonable effort is taken to ensure that all sources of the Analysis are reliable and that all information is presented, as much as possible, in an understandable, timely, precise and complete manner, Admiral Markets does not guarantee the accuracy or completeness of any information contained within the Analysis. The presented figures refer that refer to any past performance is not a reliable indicator of future results.
  6. The contents of the Analysis should not be construed as an express or implied promise, guarantee or implication by Admiral Markets that the client shall profit from the strategies therein or that losses in connection therewith may or shall be limited.
  7. Any kind of previous or modeled performance of financial instruments indicated within the Publication should not be construed as an express or implied promise, guarantee or implication by Admiral Markets for any future performance. The value of the financial instrument may both increase and decrease and the preservation of the asset value is not guaranteed.
  8. The projections included in the Analysis may be subject to additional fees, taxes or other charges, depending on the subject of the Publication. The price list applicable to the services provided by Admiral Markets is publicly available from the website of Admiral Markets.
  9. Leveraged products (including contracts for difference) are speculative in nature and may result in losses or profit. Before you start trading, you should make sure that you understand all the risks.

By Admiral Markets

7 Year Cycles Can Be Powerful And Gold Just Started One

By TheTechnicalTraders.com

Our research and predictive modeling systems have nailed Gold over the past 15+ months.  We expected Gold to rally above $1750 before the end of this year, but the global trade wars and news cycles stalled the rally in Gold over the past 2 months.  Now, it appears Gold is poised for another rally pushing much higher.

But wait, if you’re thinking I’m just another one of those traders who is always bullish on gold, just know I have been telling the truth about where gold was headed (lower) for years, but finally, the tide has changed!

Gold broke down from a bull market in 2012/2013 – nearly 7 years ago.  Now, Gold has broken resistance near $1375 and is technically in a full-fledged Bull Market.  The importance of this is the 7-year cycle and how the rotation in Gold, between the high near $1923 and the low near $1045 represent an $878 price range.  The upside (expansion) rally in Gold may very well move in expanding Fibonacci price structures – just like it did in 2005 through 2012.  If this is the case, then we may expect to see an ultimate peak price in Gold well above $3500.

The rally that started in the last 2015 and ended in July 2016 totaled +$331.1 (+31.67%).  The next price rally that started in August 2018 and ended in September 2019 totaled +$399.4 (+34.22%).  If we take the current rally range (399.4) and divide it by the previous rally range (331.1), we end up with an expansion range of 121%.  The two unique rallies that happened just before the 2009 parabolic rally in Gold represented (+315.8: 2006) and (394.8: 2008).  The ratio of these two rallies is 125%.  Could Gold have already set up for another parabolic rally well beyond the $1923 target level?

Before finding out what is next quickly join our free trend signals email list.

Monthly Price Of Gold Chart – Bull and Bear Market Trends

Our research team believes Gold has already entered a technically valid Bullish Market trend.  We believe Gold miners will follow higher as Gold begins this next move higher.  The reason we have not engaged in Miners, yet, is because we have not received any technically valid signals related to the Gold miners indicating they have also entered a new Bullish Market trend.

Gold is the safe-haven for the global market.  It is a store of value and offers price appreciation when the global market risks are excessive.  Because of this, the sentiment across the global markets appears to be weakening in regards to forward expectations and valuation appreciation within the investment/asset classes.  If Gold continues to rally higher, consider it a strong indicator that the foundation of the global market valuation levels is weakening considerably.

US Dollar Will Start To Support Higher Gold Prices

Should the US Dollar retrace lower, Gold will see a price increase based on the renewed weakness of the US Dollar.  This would also assist in re-balancing global trade and economic issues with the US Dollar moving moderately lower as weakening global markets contract.

Gold Mining Stocks – Monthly Chart

Miners are set up much like Gold was in early 2018.  Resistance has been set up with multiple price tops and any momentum rally above this level would technically qualify as a new Bullish Market trend for miners.

At this point, we believe the bottom in miners has already formed and we are simply waiting for the qualifying technical confirmation of the bullish trend to begin.  Jumping into this trade too early could result in unwanted risks as the price could still waffle around within the Stage 1 Base range.

If you want to learn more about market stage analysis I will be covering it a new article shortly. Once you grasp the basic concept you will see these stages on every chart no matter the time frame and know when to focus on trading and when to ignore the charts.

If you like new fresh big trend trades then check out this real estate article I just posted and how the real estate ETF could allow your to profit from home prices but you don’t even need to own or buy a home!

Concluding Thoughts:

The recent weakness in the US and global markets has prompted a moderately solid upside move in Gold and Silver over the past few days.  We still need to see a Gold move above recent resistance to qualify as a new upside rally though.  Miners are set up for a breakout technical move which we must also wait for.  We believe these two may move somewhat in unison if the global markets continue to contract throughout the end of 2019 and into 2020.

Stay tuned for more updates and alerts when all these key sectors and asset classes start new trends because that is when you want to get involved for immediate oversized gains. See my stock, index, and commodity trade alerts here.

Chris Vermeulen
Found of Technical Traders Ltd. TheTechnicalTraders.com

Murrey Math Lines 05.12.2019 (USDCHF, GOLD)

Article By RoboForex.com

USDCHF, “US Dollar vs Swiss Franc”

As we can see in the H4 chart, USDCHF is consolidating below 4/8. In this case, the price is expected to break 3/8 and then continue falling to reach the support at 2/8. However, this scenario may no longer be valid if the price breaks 4/8 to the upside. After that, the instrument may continue growing towards the resistance at 6/8.

USDCHF_H4
Risk Warning: the result of previous trading operations do not guarantee the same results in the future

In the M15 chart, the pair may break the downside line of the VoltyChannel indicator and, as a result, continue trading downwards.

USDCHF_M15
Risk Warning: the result of previous trading operations do not guarantee the same results in the future

XAUUSD, “Gold vs US Dollar”

As we can see in the H4 chart, XAUUSD is moving above 5/8. In this case, the price may break 7/8 and continue trading upwards to reach the resistance at 8/8. However, this scenario may no longer be valid if the price breaks 6/8 to the downside. After that, the instrument may continue falling towards the support at 5/8.

GOLD_H4
Risk Warning: the result of previous trading operations do not guarantee the same results in the future

In the M15 chart, the pair may break the upside line of the VoltyChannel indicator and, as a result, continue trading upwards.

GOLD_M15

Article By RoboForex.com

Attention!
Forecasts presented in this section only reflect the author’s private opinion and should not be considered as guidance for trading. RoboForex LP bears no responsibility for trading results based on trading recommendations described in these analytical reviews.

Fibonacci Retracements Analysis 05.12.2019 (AUDUSD, USDCAD)

Article By RoboForex.com

AUDUSD, “Australian Dollar vs US Dollar”

As we can see in the H4 chart, the correctional downtrend seems to have completed a bit lower than 61.8% fibo, but one shouldn’t expect it to continue towards 76.0% fibo at 0.6732. After the convergence on MACD, the price is forming a new rising wave towards the high at 0.6929. if the pair breaks it, the instrument may continue the ascending tendency to reach the long-term target at 50.0% (0.6983).

AUDUSD_H4
Risk Warning: the result of previous trading operations do not guarantee the same results in the future

The H1 chart shows more detailed structure of the current correctional uptrend, which has already reached 61.8% fibo. Right now, the pair is forming a new pullback. The support is 23.6% fibo at 0.6794. After completing the pullback, the instrument may start another rising impulse to reach 76.0% fibo at 0.6887.

AUDUSD_H1
Risk Warning: the result of previous trading operations do not guarantee the same results in the future

USDCAD, “US Dollar vs Canadian Dollar”

As we can see in the H4 chart, the divergence made USDCAD finish its two-week sideways movement and start plunging. By now, it has already reached 50.0% and may later continue falling towards 61.8% and 76.0% fibo at 1.3151 and 1.3111 respectively. the key target is the low at 1.3042.

USDCAD_H4
Risk Warning: the result of previous trading operations do not guarantee the same results in the future

In the H1 chart, the pair has stopped its decline at 50.0% fibo. This may indicate a slowdown of the short-term tendency and a possible pullback in the nearest future.

USDCAD_H1

Article By RoboForex.com

Attention!
Forecasts presented in this section only reflect the author’s private opinion and should not be considered as guidance for trading. RoboForex LP bears no responsibility for trading results based on trading recommendations described in these analytical reviews.

How Much Crude Oil Do You Unknowingly Eat?

By OilPrice.com

You may think (or hope) that in your daily life you don’t need to worry about unknowingly eating or otherwise ingesting crude oil or any of its many, many petrochemical byproducts. But you would be wrong. And not just a little wrong–very, very wrong. Petroleum-based substances are in all kinds of innocuous-seeming things that we willingly put into our bodies. Even though petrochemicals are not technically (or really any other adverb you want to insert here) edible, we eat quite a lot of them.

Petrochemicals–substances that are essentially poisonous for human consumption–are even hiding in your medicine. Some of the most seemingly innocuous substances in your home are absolutely coated in it, in fact. “Petrochemicals cumene, phenol, benzene, and other aromatics are used to make not only aspirin, but also penicillin and cancer-fighting drugs,” reports Science Notes. “Ultimately, most drugs are organic molecules made using petrochemical polymer. Those that are not are often purified using petrochemical resins. Polymers are used to make pill capsules and coatings. Time-release drugs rely on a tartaric acid-based polymer that slowly dissolves, administering just the right dose of medication.” What’s more, according to the Petro Industry News, “they may not necessarily be classified as ‘edibles’ but painkillers and vitamins are often packed full of petrochemicals. They contain acetylsalicylic acid, the active ingredient in a multitude of over the counter painkillers such as aspirin.”

Common toiletries such as toothpaste are petrochemical-based as well. Even most people spit out their toothpaste, it’s inevitable that a fair bit of it gets ingested. Many prominent toothpaste brands use not just one petroleum-based ingredient, but two (and that’s without taking into account the petroleum-based plastic packaging). “Many of the most popular toothpastes available today are made with sodium lauryl sulfate, a product commonly made from petroleum. Sodium saccharin is another ingredient often found in toothpaste; it is a sweetener made from petroleum,” writes Portland State University’s Ecolife Project Blog. The average adult will use about 20 gallons of toothpaste over their lifetime.

We tend to look at drugs and toiletries as a category far away from food, even though we often ingest them orally and they end up in our stomachs along with everything else we eat. Because of this, maybe it doesn’t seem so crazy that petro-products that were once crude oil are in our medicine because we are aware that medicine is synthesized and created in laboratories full of all kinds of chemicals. But when it comes to actual food, most of us would never imagine that there is crude oil lurking in our fridges and pantries. But there is. And a lot more of it than you would expect.

Thought Co. reports that “petrochemicals are used to make most food preservatives that keep food fresh on the shelf or in a can. In addition, you’ll find petrochemicals listed as ingredients in many chocolates and candies. Food colorings made with petrochemicals are used in a surprising number of products including chips, packaged foods, and canned or jarred foods.” Chewing gum also includes crude oil as the basis for not just one but many of its primary ingredients. LiveScience reports that “People who enjoy the snap and long-lasting texture of their chewing gum can give a nod of thanks to petroleum-derived polymers. Today’s gum bases can consist of both natural latexes and petroleum products such as polyethylene and paraffin wax, which also means most gums are non-biodegradable. But the first chewing gums typically relied upon the natural latex known as chicle — still the gum base of choice for some upscale gum brands and certain regional markets.”

This is to say nothing of the synthetic petrochemical fertilizers that are used to grow nearly all of the produce that we consume (especially in more developed countries) and that give nitrogen, phosphorous, and potassium to our soils and the fruits and vegetables grown from them. As summed up by Thought Co., “More than a billion pounds of plastic, all made with petrochemicals, find use annually in U.S. agriculture. The chemicals are used to make everything from plastic sheeting and mulch to pesticides and fertilizers. Plastics are also used to make twine, silage, and tubing. Petroleum fuels are also used to transport foods (which are, of course, stored in plastic containers).” In fact, our entire food system is fueled by oil, and agriculture is responsible for a quarter of all greenhouse gas emissions, making it the second biggest greenhouse gas-emitting sector after the energy sector itself.

While we as consumers may not be aware of or mindful about the fact that so much of the things that we choose to consume contain some amount of crude oil in the form of petrochemicals, at least the petrochemicals were put there on purpose and are therefore almost certainly measured or regulated in some way. But there are also plenty of things that we consume that are full of petrochemicals that are not supposed to be there at all. And it’s no simple feat to avoid consuming these hidden petrochemicals, because one of the most common sources is something that we can’t live without: water.

We’re Literally Eating and Drinking Plastic. Fossil Fuels Are To Blame.” proclaims non-profit organization Food & Water Watch. “Everyone drinks water, and whether you drink tap water or bottled water, you are very likely ingesting some level of plastic pollution,” the article continues. This assertion is based on a study by Orb Media, which found that of 159 drinking water samples tested, sourced from cities and towns around the world, 83 percent contained microplastic fibers. “That means food prepared with plastic-contaminated water becomes contaminated as well.”

While consumers may think that the solution is in bottled water, they would be wrong. “Bottled water samples fared even worse than tap water—unsurprising because it is manufactured with plastic. Another recent study by the same organization found 90 percent of bottled water analyzed from around the world contained plastic microfibers. A single bottle of Nestlé Pure Life had concentrations of microfiber plastics up to 10,000 pieces per liter. The type of plastic used to make bottle caps was the most common type of microplastic fiber found in bottled water.” And it’s not just water that contains microplastics that are in no way supposed to be there. Microplastics have also been found in sea salt, seafood, beer, honey and sugar.

It is widely accepted that in order to avoid catastrophic climate change, the world needs to decarbonize in a serious and urgent manner. But while this may seem like a relatively simple goal on the surface, looking into the complex web of petrochemical tracing shows just how ubiquitous petrochemistry has become in our lives. Not even our food is carbon-free. Not even our water is without traces of crude oil. This article didn’t even touch the drastic quantity of crude oil’s carbon emissions that are in the very air we breathe. The oil industry’s control and saturation of the market has far-reaching implications that are unbelievably complex and simultaneously invisible. At the same time that we go through our lives without thinking in any serious way about crude oil and its place in our lives, it is already in our bodies. We carry the responsibility of decarbonization and its quite literal burden within us. There is no opting out.

Link to article: https://oilprice.com/Energy/Crude-Oil/How-Much-Crude-Oil-Do-You-Unknowingly-Eat.html

By Haley Zaremba for Oilprice.com


The US Currency Is Declining

by JustForex

The US dollar fell against a basket of major currencies during yesterday’s trading. The dollar index (#DX) closed yesterday in the red zone (-0.11%). Yesterday, weak economic data were published in the US. ADP nonfarm employment change grew only by 67K in November, while experts expected an increase by 140K. The ISM non-manufacturing PMI counted to 53.9 in November instead of 54.5.

Contradictory statements by the US President also put pressure on the US dollar. So, on Tuesday, the President said that negotiations with China were likely to be postponed until the US presidential election in 2020. However, an official said yesterday that the talks were going “very well.”

Yesterday, the Bank of Canada decided on a key interest rate. The indicator was left unchanged at the level of 1.75%. Today we expect the publication of Ivey PMI.

Today, weak economic data have been published in Australia during the Asian trading session. Retail sales did not change in October, while experts forecasted an increase by 0.3%. The trade balance counted to 4.502B instead of 6.100B.

The “black gold” prices are declining moderately. At the moment, futures for the WTI crude oil are testing the $58.50 mark per barrel.

Market Indicators

Yesterday, there was the bullish sentiment in the US stock market: #SPY (+0.62%), #DIA (+0.56%), #QQQ (+0.51%).

The 10-year US government bonds yield has been growing. At the moment, the indicator is at the level of 1.77-1.78%.

The Economic News Feed for 05.12.2019:
  • – Eurozone GDP data at 12:00 (GMT+2:00);
  • – Initial jobless claims in the US at 15:30 (GMT+2:00);
  • – Ivey PMI in Canada at 17:00 (GMT+2:00).

by JustForex

The Analytical Overview of the Main Currency Pairs on 2019.12.05

by JustForex

The EUR/USD currency pair

Technical indicators of the currency pair:
  • Prev Open: 1.10815
  • Open: 1.10773
  • % chg. over the last day: +0.00
  • Day’s range: 1.10806 – 1.10840
  • 52 wk range: 1.0884 – 1.1623

The EUR/USD currency pair is still sideways. Weak economic data from the US was published yesterday. The number of employees in the non-agricultural sector from ADP grew in November by only 67K, while experts expected an increase to 140K. The ISM Purchasing Managers Index for ISM in November was 53.9 instead of 54.5. Meanwhile, the Markit composite business activity index (PMI) in the EU in November was 50.6 and turned out to be better than the predicted value of 50.3. Currently, the key support and resistance levels are 1.10650 and 1.10900, respectively. Open positions from these marks. We recommend you to keep track of up-to-date information regarding US-China trade relations.

The Economic News Feed for 05.12.2019:

  • – GDP Report (EU) – 12:00 (GMT+2:00);
  • – Initial Jobless Claims (US) – 15:30 (GMT+2:00);
EUR/USD

Indicators do not give accurate signals: the price has crossed 50 MA.

The MACD histogram is near the 0 mark, which also indicates the absence of signals.

The Stochastic Oscillator is in the neutral zone, the %K line has crossed the %D line. There are no signals.

Trading recommendations
  • Support levels: 1.10650, 1.10300, 1.10000
  • Resistance levels: 1.10900, 1.11200

If the price consolidates above the resistance level of 1.10900, expect the quotes to rise toward 1.11200-1.11350.

Alternatively, the quotes could reduce toward 1.10300-1.10150.

The GBP/USD currency pair

Technical indicators of the currency pair:
  • Prev Open: 1.29925
  • Open: 1.31032
  • % chg. over the last day: +0.89
  • Day’s range: 1.31338 – 1.31474
  • 52 wk range: 1.1959 – 1.3385

The GBP/USD currency pair is showing aggressive purchases. Amid the weakness of the US dollar, the British pound moved up. During yesterday’s trading, GBP/USD quotes rose by more than 50 points. Investors are awaiting additional information regarding the Brexit process. The British pound was also supported by positive economic data from the UK. At the moment, the key support level is 1.31000. The key resistance level is 1.30600. We recommend opening positions from these marks.

Today, the publication of important news from the UK is not expected.

GBP/USD

Indicators point to a bullish sentiment: the price is being traded above 50 MA and 100 MA.

The MACD histogram is in the positive zone, but below the signal line, which gives a weak signal to buy GBP/USD.

The Stochastic Oscillator is in the neutral zone, the %K line crossed the %D line. There are no signals.

Trading recommendations
  • Support levels: 1.31000, 1.30500, 1.30000
  • Resistance levels: 1.31600, 1.31800

If the price consolidates above 1.31600, expect further growth toward 1.32000.

Alternatively, the quotes could fix below 1.31000 and descend toward 1.30500-1.30300.

The USD/CAD currency pair

Technical indicators of the currency pair:
  • Prev Open: 1.32941
  • Open: 1.32003
  • % chg. over the last day: -0.77
  • Day’s range: 1.31771 – 1.31889
  • 52 wk range: 1.2727 – 1.3664

During yesterday’s trading, the USD/CAD currency pair significantly decreased. Quotes fell by almost 100 points. The US dollar is under pressure from weak economic data and an unclear situation around US-China trade relations. Yesterday, the Bank of Canada left the interest rate unchanged at 1.75%. Currently, the local support and resistance levels are 1.31750 and 1.32000, respectively. We recommend paying attention to the dynamics of oil prices. Open positions from key levels.

Today at 17:00 (GMT+2:00) Ivey PMI Index for Canada will be published.

USD/CAD

Indicators point to a bearish sentiment: the price is being traded below 50 MA and 100 MA.

The MACD histogram is in the negative zone, but above the signal line, which gives a weak signal to sell USD/CAD.

The Stochastic Oscillator is in the neutral zone, the% K line crosses the% D line. There are no signals.

Trading recommendations
  • Support levels: 1.31750, 1.31500
  • Resistance levels: 1.32000, 1.32350, 1.32700

If the price consolidates below 1.31750, expect a further decline toward 1.31500-1.31400.

Alternatively, the quotes could grow toward 1.32350-1.32500.

The USD/JPY currency pair

Technical indicators of the currency pair:
  • Prev Open: 108.629
  • Open: 108.859
  • % chg. over the last day: +0.18
  • Day’s range: 108.915 – 108.951
  • 52 wk range: 104.97 – 114.56

During yesterday’s trading, the USD/JPY currency pair rose slightly. Currently, the key support and resistance levels are 108.700 and 109.000, respectively. Investors expect additional drivers. We also recommend you to pay attention to the dynamics of yield on US government bonds. Open positions from key levels.

The Economic News Feed for 05.12.2019 is calm.

USD/JPY

Indicators do not give accurate signals: the price is being traded between 50 MA and 100 MA.

The MACD histogram is in the positive zone, above the signal line, which gives a signal to buy USD/JPY.

The Stochastic Oscillator is in the neutral zone, the %K line is above the %D line, which indicates a bullish sentiment.

Trading recommendations
  • Support levels: 108.700, 108.450
  • Resistance levels: 109.000, 109.300, 109.600

If the price consolidates above the round level of 109,000, expect the quotes to grow toward 109.300-109.450.

Alternatively, the quotes could descend toward 108.450-108.300.

by JustForex

EURUSD: price touches down at the balance line

By Alpari.com

On Wednesday the 4th of December, the euro was down by four points at the end of trading. In the American session, bulls pushed the price to a new high of 1.1116. This was made possible due to three main factors: the Bloomberg report, weak ADP and ISM indices.

Bloomberg reported that the United States and China are close to an agreement on the amount of tariffs that will be cancelled as part of the first phase of the trade deal. Investors inferred from this report that there is still a real chance for the trade agreement to be signed before December 15.

In November, the private sector added only 67 thousand new jobs (the forecast was 110,000 (the previous figure was 121,000)). The ISM service index in November fell to 53.9 from 54.7.

As the price rose above 1.11, bulls began to turn a profit, which eventually led to the fall to 1.1067.

Day’s news (GMT+3):

  • 13:00 Eurozone: Gross Domestic Product s.a. (QoQ) (Q3), Retail Sales (MoM) (Oct).
  • 16:30 Canada: Exports (Oct).
  • 16:30 USA: Trade Balance (Oct), Initial Jobless Claims 4-week average (Nov 29).
  • 18:00 Canada: Ivey Purchasing Managers Index (Nov).
  • 18:00 USA: Factory Orders (MoM) (Oct).

051219

Current situation:

The target forecast for December 3 was never realised. The unexpected release of Bloomberg’s report and the publishing of weak statistics out of the US supported the “eurobulls”. The balance point shifted from 1.1050 to 1.1080.

US President Donald Trump said that the signing of a trade agreement with China may be delayed until after the US presidential election, which will be held in November next year. Yet after the Bloomberg report, there was talk that the deal would be concluded before December 15, 2019. Today, the market is optimistic about the UK general election in the UK and Brexit. In Europe, the pound hit a new high.

A candlestick with a long vertical shadow formed on the daily TF. A reversal pattern on the bell, but the background news was more significant. Following the pound, bulls can easily block an evening fall of the pair. The key support area is now located between 1.1070-1.1080. We can probably expect a flat formation according to the template laid out by the events of December 3-4. If the support of 1.1065 is maintained up to the release of the payroll report, and the results disappoint market players, then the euro is nailed on to soar to 1.1135. There is no correlation between ADP and NFP, but nevertheless, market players consider them and if there are technical factors, they will use the moment to exit the market and take up positions in preparation of the release of further important news.

By Alpari.com

Amazon Repricing: How it works and why your business needs it

Getting ahead of the game as an Amazon seller is quite difficult, but at least Amazon repricing software makes it somewhat easier.

Photo by Henry & Co.

Success on Amazon begins with understanding your competitors. Another one of your competitors includes the same hungry and skilled sellers in the market as you. Sometimes they sell identical products to you, which means that your product visibility and pricing are important to ensure maximum profitability.

Unfortunately, the more products you sell, the more it becomes impossible to keep up with your handiwork. Imagine how tedious it would be to keep up to date with the prices of your competitors, not to mention the need to manually update your prices in response to every change that is tracked.

Pricing software, also known as a “repricer”, is the best way to overcome this otherwise and impossible management of prices.

The repricer allows Amazon sellers to automatically compare and adjust prices for their products with those of competitors, regardless of who they are. Here is more in depth information on what an Amazon repricer actually is.

Some Amazon sellers are still unsure of how the software works in order to reduce risk and drive sales.

Let’s take a quick look at the repricing software, how it works, how long it takes to update the pricing information, and how it fits into the overall your sales process.

What is Automated Repricing Software?

Auto-repricing software is a technology where sellers can program price changes in their own name. To make this software work, sellers should set strategies with specific goals, such as owning a Buy Box or selling multiple units over a period of time.

Once these strategies have been developed, Automated Repricing Software will evaluate market data (such as competitor prices, vendor performance, such as feedback ratings, execution type, etc.) and make appropriate changes to the vendor’s prices.

One of the goals is to maximize the time your offers stay in the Amazon Buy Box. The automatic repricing software will compare market data, including the seller’s figures, with those of competitors and make suitable price changes on your behalf.

If you have goals that go beyond just owning a Buy Box, you can also install other pricing software to help you achieve these goals. For example, if you want to maximize profits, your pricing software may raise prices after you purchase ownership of the Buy Box. If you lose your Buy Box, your software will restart the process by lowering prices again.

How Amazon repricing software works

When you set up your repricer, your ads are automatically filled in by the software through reports provided by Amazon’s Subscriptions API.

The repricer then reviews your products and analyzes offers from all sellers on a particular listing to identify a competitor.

Repricing software usually allows users to narrow down their competition only by competing with:

– specific types of performance

– sellers who have the right to Buy Boxes

– competitors with a seller’s rating above a certain level

– Sellers with specific indicators, such as number of days of processing, not exceeding or below a certain amount.

The copyist will receive updates from Amazon when the competition changes on the listing, and will respond to changes in the price of your products in accordance to your strategy settings.

Any price change always occurs in relation to the minimum price you have provided, ensuring that your products will never be sold at a price lower than the one you prefer.

As an option, you can set the maximum price to ensure that your products will never be more expensive than MSRP. It is well known that Amazon has consequences for users who set excessively high prices, therefore, you should not lose sight of the maximum price setting.

Price updates from Amazon – timing

One of the most important reasons for using software for repricing is its ability to register changes from competition and react almost instantly.

The software reacts as quickly as Amazon allows – usually between 5-15 minutes.

Certain repricers aren’t capable of anything better than hourly adjustments, so it’s worth doing research before you start developing repricing software for your business.

Once you’ve set the parameters for your ads, including specifying minimum and maximum price points, and deciding on specific pricing strategies, you’ll be ready to start pricing, and the software will constantly work to promote your ads in the Buy Box as well as increase sales.

How it works with regards to the selling process

One of the reasons why repricing software is so efficient is because its model is repeated all the time. Even if sellers change the details of their ads, the software catches them and will adjust them in order to keep your ads competitive. Of course, you can keep and remove ads through this process. Repricing software will not include inactive, fixed prices or items that are not in stock.

The Bottom Line on Amazon Repricing Software

The Amazon repricer makes a permanent price war on Amazon easy and manageable.

Your ads remain competitive, without having to constantly spy on competitors and make your price changes manually, saving you from countless hours of work and unnecessary stress.

The software also ensures that more potential buyers will see your ads, putting them at a better place on the listing pages.

Basically you are in a much better position – and perhaps the only viable position – to compete effectively and win a Buy Box.

How Does Amazon Repricing Help Sellers?

Everything sold on Amazon has its own page in the listing, so if the same product is sold by more than one supplier, several offers will be attached to the ad. One winning bid will take the attention-grabbing “Buy Box”.

Source

All other offers will be visible, but hidden in the section “Other Amazon Sellers”:

The way Amazon decides which seller owns the Box is a secret. However, price competitiveness is one of the key factors that has a significant impact on the situation. Winning a Buy Box is not an easy task for sellers, but the ROI can be huge, because more than 80% of sales on Amazon pass through the Buy Box.

Every day, often every hour, sellers will resell goods in an attempt to obtain (or regain) ownership of the Buy Box. One can try to do this manually, but most use sophisticated software to do it for them.

Is Repricing a Race to the Bottom?

Many sellers fear that repricing strategies will lead to a race to a lower price, also known as the minimum amount for which they are willing to sell. However, with Automated Repricing Software, you can set the minimum and maximum prices for the software that you will be working with when seeking for the best Buy Box price.

Does My Business Need Repricing Software?

Sellers around the world want to know if they should buy repricing software. Does it cost money? Do I need other software?

Yes, it’s true that you can log onto the Amazon system and manually reprice your products.

However, it is worth paying attention to the time and complexity involved in using automated repricing software. Automatic repricers take into account many different factors, and do so accurately and quickly. If you have more important things to do than analyzing and updating ads, you can be helped by software that offers better repricing options.

Conclusion

Success on Amazon begins with understanding your competitors. Part of your competition comes from Amazon itself, who can constantly adjust prices and stay at the top of the listings.

Another one of your competitors comes from similar sellers as you. Sometimes they sell identical products to you, which means that product visibility and pricing are equally important to ensure profitability.

Therefore, as an online business, it has become necessary to use Amazon repricing software.

About the Author:

Dmitrii B. is the founder of GRIN tech – a full-cycle white label agency delivering design, development and marketing solutions.


Japanese Candlesticks Analysis 04.12.2019 (GOLD, NZDUSD)

Article By RoboForex.com

XAUUSD, “Gold vs US Dollar”

As we can see in the H4 chart, the ascending tendency continues. By now, after completing several reversal patterns, including Hammer, close to the support level, XAUUSD has reversed. At the moment, the pair is correcting. After completing this slight pullback, the price may grow towards 1491.50. At the same time, we shouldn’t exclude an opposite scenario, which implies that the instrument may continue falling towards 1455.50.

GOLD
Risk Warning: the result of previous trading operations do not guarantee the same results in the future

NZDUSD, “New Zealand vs. US Dollar”

As we can see in the H4 chart, the ascending channel continues. After forming several reversal patterns, including Harami, near the resistance level, NZDUSD is reversing. Later, the market may start a new decline to reach the support level at 0.6455. At the same time, one shouldn’t exclude an opposite scenario, according to which the instrument may grow towards 0.6555 and break the channel’s upside border.

NZDUSD

Article By RoboForex.com

Attention!
Forecasts presented in this section only reflect the author’s private opinion and should not be considered as guidance for trading. RoboForex LP bears no responsibility for trading results based on trading recommendations described in these analytical reviews.