Author Archive for InvestMacro – Page 126

Lumber is about to rally and how to play it with this ETF

By TheTechnicalTraders.com

WOOD, one of the Ishares ETF symbols related to the Real Estate and Construction sectors may become the next hottest instrument for skilled technical traders.  Over the past three years, Wood has rallied over 110% between a $40 to $84 range and the trading volume of WOOD has been relatively consistent near an average of about 140k shares per week.  Let’s dig into the opportunities that may present themselves over the next 6 to 12+ months in WOOD.

First, you can get more information about this iShares ETF here.

Second, the WOOD ETF is relatively closely correlated to the US Real Estate and Construction sectors. Thus, when economic data is announced that supports growing Real Estate and Construction activity, traders can easily translate that into forward expectations in price in the WOOD ETF.  For the purposed of this article, we’ll stick with a simple example of New Private Housing Unit Building Permits data from the St. Louis Federal Reserve.

Before you continue, take a couple of seconds and join our free trend signals email list.

New Housing Building Permits

As you can see from the chart below, since the bottom of the housing market crisis in 2009, an extended bottom to place between 2009 and 2011.  Early in 2012, the housing market began to uptick with an increase in housing permits.

This increase continued until a peak in 2015 rattled the markets (right before the 2016 Elections).  The post-2016 recovery and rotation in housing permits are very clear to see through the end of 2018 and we can see an uptick in new building permits in 2019 as the US Federal Reserve change focus fairly early in 2019 to reduce the Fed Funds Rate and ease economic concerns globally.

This uptick in the housing permit data presents a fairly clear picture that builders are expecting a moderate increase in activity over the next 12+ months related to new home sales, inventory, and activity.  How can you learn to profit from these trends?

WOOD Weekly Price Chart

This Weekly WOOD chart highlights the trends that correlate to the housing permit chart above.  Notice how the growth from 2013 to 2015 was more moderate compared to the growth between 2017 and 2018?  This reflects the investor sentiment related to real economic activity and expectations.

In the 2014/2015 period, housing prices were still recovering well, yet the US Fed was also starting to raise interest rates from extreme lows and the US was headed into a very contentious election cycle.

You can see how WOOD contracted in 2016 as rates crept higher and the US election took hold of the markets – causing uncertainty and fear in the consumer market.  This fear translated to a slowdown of activity and expectations in the housing market that reflected a price decline in WOOD in 2016.

The rally, after the November 2016 US presidential elections, clearly illustrates that investors and consumers believed the new US President would usher in an economic boom cycle – no matter what the US Fed did (for the most part).

Currently, WOOD has retraced from $84 to levels near $54.  The current uptick in housing permits suggests builders and construction are ramping up expecting a bump in housing activity over the next 12+ months.  It could be that builders are expecting the US Fed to continue easing or a more positive business/political climate for consumers and wages.  Either way, the uptick in building permits suggests forward expectations are positive at this time.  If WOOD breaks above the $67/68 level, a new price rally may continue towards the $76 level.

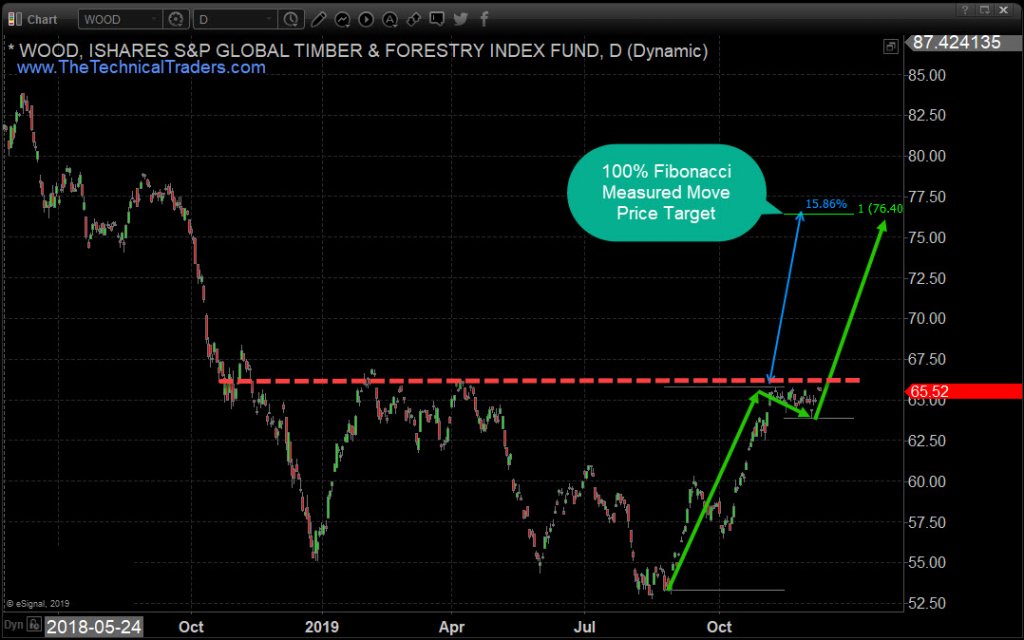
Daily WOOD Price Target Chart

One of our favorite measures of price activity is the “100% Fibonacci Measured Move”.  This Fibonacci price theory suggests that price typically legs higher or lower in 100% (or near 100%) legs/moves.  By taking a look at a previous price advance/leg, we measure that move and apply that range to a recent pullback to determine where the next 100% Measured Move may target.

In this case, the $76.40 level becomes the new 100% Fibonacci Measure Move target if the upside breakout happens as we expect.  This represents a 15%+ upside price move potential for skilled technical traders.

If wood starts to collapse in price, it could be the start of the next real estate crash we explain here.

We’ve been warning our followers and members that 2019 and 2020 are going to be excellent environments for technical traders.  Price rotation, trends and volatility should continue throughout the next 12+ months and well past the 2020 US elections.

Following wood/lumber may be new to you and that’s great because its another angle to profit from an asset class, not many traders talk about. We will also go into more detail in a future article on how we use the wood to gold ratio to help predict stock market direction. This may sound strange but, but this ratio plays a powerful roll in knowing when the big and smart money is rotating into the risk on/off asset classes.

In fact, both WOOD and Gold have bullish price patterns and one of them will fail, the question is which one? A couple of days ago we posted our analysis about what is happening in gold right now.

In short, rotations in ETFs, such as this potential move in WOOD, will continue to set up and rotate throughout the 2020 election event and beyond we’ll keep you informed as this plays out with Wealth Building & Global Financial Reset Newsletter. Join us with the 1 or 2-year subscription to lock in the lowest rate possible and ride my coattails as I navigate these financial markets and build wealth while others lose nearly everything they own during the next financial crisis. Get a Free 1oz Silver Round or Gold Bar Shipped To You as a Bonus!

As a technical analysis and trader since 1997, I have been through a few bull/bear market cycles. I believe I have a good pulse on the market and timing key turning points for both short-term swing trading and long-term investment capital. The opportunities are massive/life-changing if handled properly.

Chris Vermeulen
Founder of Technical Traders Ltd.

TheTechnicalTraders.com

Murrey Math Lines 10.12.2019 (AUDUSD, NZDUSD)

Article By RoboForex.com

AUDUSD, “Australian Dollar vs US Dollar”

As we can see in the H4 chart, AUDUSD is consolidating. In this case, the pair is expected to break 4/8 and continue growing towards the resistance at 5/8. However, this scenario may no longer be valid if the price breaks 3/8 to the downside. After that, the instrument may continue falling to reach the support at 2/8.

AUDUSD_H4
Risk Warning: the result of previous trading operations do not guarantee the same results in the future

In the M15 chart, the pair may break the upside line of the VoltyChannel indicator and, as a result, continue trading upwards to reach 5/8 from the H4 chart.

AUDUSD_M15
Risk Warning: the result of previous trading operations do not guarantee the same results in the future

NZDUSD, “New Zealand Dollar vs US Dollar”

In the H4 chart, NZDUSD is expected to test the resistance at 8/8. According to the main scenario, the pair may rebound from this level and resume falling to reach the support at 5/8. However, this scenario may no longer be valid if the price breaks 8/8. After that, the instrument may start a new growth towards the resistance at +2/8.

NZDUSD_H4
Risk Warning: the result of previous trading operations do not guarantee the same results in the future

In the M15 chart, the pair may break the downside line of the VoltyChannel indicator and, as a result, continue moving downwards.

NZDUSD_M15

Article By RoboForex.com

Attention!
Forecasts presented in this section only reflect the author’s private opinion and should not be considered as guidance for trading. RoboForex LP bears no responsibility for trading results based on trading recommendations described in these analytical reviews.

Japanese Candlesticks Analysis 10.12.2019 (USDCAD, AUDUSD)

Article By RoboForex.com

USDCAD, “US Dollar vs Canadian Dollar”

As we can see in the H4 chart, the pair is forming another descending wave. By now, it has completed Engulfing reversal pattern. The current situation implies that USDCAD may reverse to continue falling towards 1.3171. However, we shouldn’t ignore an alternative scenario, according to which the instrument may continue growing to reach 1.3300 and get back inside the rising channel.

USDCAD
Risk Warning: the result of previous trading operations do not guarantee the same results in the future

AUDUSD, “Australian Dollar vs US Dollar”

As we can see in the H4 chart, the pair continues forming the ascending tendency. After forming several reversal patterns, such as Engulfing, close to the support level and reversing, AUDUSD is moving in the middle of the rising channel. By now, it has completed Engulfing reversal pattern along with the correction and may later continue trading upwards. In this case, the upside target may be at 0.6888. However, we shouldn’t ignore an alternative scenario, which implies that the instrument may resume falling to return to 0.6760 and update its closest lows.

AUDUSD

Article By RoboForex.com

Attention!
Forecasts presented in this section only reflect the author’s private opinion and should not be considered as guidance for trading. RoboForex LP bears no responsibility for trading results based on trading recommendations described in these analytical reviews.

The Analytical Overview of the Main Currency Pairs on 2019.12.10

by JustForex

The EUR/USD currency pair

Technical indicators of the currency pair:
  • Prev Open: 1.10582
  • Open: 1.10638
  • % chg. over the last day: +0.05
  • Day’s range: 1.10694 – 1.10750
  • 52 wk range: 1.0884 – 1.1623

During yesterday’s trading, the EUR/USD currency pair remained virtually unchanged. Investors took a wait and see attitude before the Fed meeting, which will take place tomorrow. At the meeting, the regulator will decide on the key interest rate. The interest rate is expected to remain unchanged at 1.75-2.00%. At the moment, the key support and resistance levels are 1.106000 and 1.10800, respectively. Open positions from these marks.

The Economic News Feed for 10.12.2019:

  • – ZEW economic sentiment index (GER) – 12:00 (GMT+2:00);
EUR/USD

The indicators do not give accurate signals: the price has crossed 50 MA.

The MACD histogram is near the 0 mark, which also does not give signals.

The Stochastic Oscillator is in the neutral zone, the %K line crossed the %D line. There are no signals.

Trading recommendations
  • Support levels: 1.10600, 1.10350, 1.10000
  • Resistance levels: 1.10800, 1.11050

If the price consolidates below the level of 1.10600, expect a descend to the level of 1.10350-1.10200.

If the price consolidates above the resistance level of 1.10800, the growth of the EUR/USD currency pair is expected. The potential movement is to 1.11050-1.11300.

The GBP/USD currency pair

Technical indicators of the currency pair:
  • Prev Open: 1.31350
  • Open: 1.31391
  • % chg. over the last day: +0.05
  • Day’s range: 1.31327 – 1.31521
  • 52 wk range: 1.1959 – 1.3385

The trading instrument GBP/USD is consolidating. The technical picture is ambiguous. Investors expect additional drivers. Today UK will be publish a report on GDP. At the moment, the key support level is 1.31350. The key resistance level is 1.31700. We recommend opening positions from these marks.

The Economic News Feed for 10.12.2019:

  • – GDP Report (UK) – 11:30 (GMT+2:00);
  • – UK Manufacturing Production (UK) – 11:30 (GMT+2:00);
GBP/USD

Indicators do not provide accurate signals: the price crossed 50 MA.

The MACD histogram is near the 0 mark, there are no signals.

The Stochastic Oscillator is in the neutral zone, the %K line crosses the %D line. There are no signals.

Trading recommendations
  • Support levels: 1.31350, 1.31000, 1.30650
  • Resistance levels: 1.31700, 1.32000

If the price consolidates above 1.31700, expect the quotes to rise toward 1.32000.

Alternatively, the quotes could decline toward 1.31000.

The USD/CAD currency pair

Technical indicators of the currency pair:
  • Prev Open: 1.32520
  • Open: 1.32366
  • % chg. over the last day: -0.10
  • Day’s range: 1.32259 – 1.32322
  • 52 wk range: 1.2727 – 1.3664

The USD/CAD currency pair has an ambiguous technical picture. The trading instrument is in lateral movement. Investors expect additional drivers. The local support and resistance levels are 1.32150 and 1.32500, respectively. We recommend paying attention to the dynamics of oil prices. Open positions from key levels.

The Economic News Feed for 10.12.2019 is calm.

USD/CAD

Indicators of accurate signals do not provide accurate signals: 50 MA crossed 100 MA.

The MACD histogram is near the 0 mark, there are no signals.

The Stochastic Oscillator is in the neutral zone, the %K line is above the %D line, which also gives a signal to buy USD/CAD.

Trading recommendations
  • Support levels: 1.32150, 1.31800, 1.31500
  • Resistance levels: 1.32500, 1.32850

If the price consolidates above 1.32500, expect the quotes to rise toward 1.32850-1.33000.

Alternatively, the quotes could descend toward 1.31800-1.31650.

The USD/JPY currency pair

Technical indicators of the currency pair:
  • Prev Open: 108.748
  • Open: 108.553
  • % chg. over the last day: -0.06
  • Day’s range: 108.567 – 108.597
  • 52 wk range: 104.97 – 114.56

The USD/JPY currency pair has an ambiguous technical picture. Quotes are moving in a flat. At the moment, the key support and resistance levels are still 108.450 and 108.650, respectively. We recommend that you pay attention to the dynamics of yield on US government bonds. Open positions from key levels.

The Economic News Feed for 10.12.2019 is calm.

USD/JPY

Indicatorsdo not give accurate signals: the price has crossed 50 MA.

The MACD histogram is near the 0 mark, which also does not provide signals.

The Stochastic Oscillator is in the neutral zone, the %K line is below the %D line, which indicates a bearish mood.

Trading recommendations
  • Support levels: 108.450, 108.250
  • Resistance levels: 108.650, 108.850, 109.150

f the price consolidates below 108.450, expect the quotes to fall toward 108.250-108.100.

Alternatively, the quotes could grow toward 108.850-109.000.

by JustForex

The US Dollar Is Consolidating

by JustForex

The US dollar is consolidating against a basket of major currencies. The dollar index (#DX) closed yesterday in the negative zone (-0.05%). Investors expect the Fed meeting, which will be held tomorrow on December 11. At the meeting, the regulator will decide on the key interest rate. The interest rate is expected to remain unchanged at 1.75-2.00%. In addition, financial markets continue to follow the news regarding trade negotiations between the US and China.

Today, important economic data will be published in the UK. In general, investors have taken a wait-and-see attitude before the parliamentary elections on December 12. UK elections will be a decisive factor for the British pound.

The “black gold” prices are falling amid uncertainty in the trade conflict between China and the US. Currently, futures for the WTI crude oil are testing the $59.15 mark per barrel. At 23:30 (GMT+2:00), API weekly crude oil stock will be published.

Market Indicators

Yesterday, there was the bearish sentiment in the US stock market: #SPY (-0.31%), #DIA (-0.33%), #QQQ (-0.45%).

The 10-year US government bonds yield has decreased slightly. At the moment, the indicator is at the level of 1.81-1.82%.

The Economic News Feed for 10.12.2019:
  • – UK GDP data at 11:30 (GMT+2:00);
  • – Manufacturing production in the UK at 11:30 (GMT+2:00);
  • – German ZEW economic sentiment index at 12:00 (GMT+2:00).

by JustForex

EURUSD: downwards trend continues

By Alpari.com

On Monday the 9th of December, the euro was up four points at the closing time. After Friday’s NFP, Forex activity was low at the beginning of the week. In the first half of the European session, the EURUSD pair recovered to 1.1078, in the second half it fell to 1.1055. At the time of writing, the price is consolidating at 1.1066.

Today’s news (GMT+3):

  • 12:30 UK: Gross Domestic Product (MoM) (Oct), Manufacturing Production (MoM) (Oct), Goods Trade Balance (Oct), Industrial Production (MoM) (Oct).
  • 13:00 Germany & Eurozone: ZEW Survey – Economic Sentiment (Dec)
  • 16:00 UK: NIESR GDP Estimate (3M) (Nov).

101219

Current situation:

Bears did not realise their targeted increase of 13 points, and their aim of reaching the 1.1042-level. The fall from 1.1040 and subsequent rise to 1.1078 amount to 61.8%. A rebound from the Fibo level is the first sign that the flat may drag on until Thursday.

On Wednesday, the US regulator will announce its decision as regards the national interest rate. On Thursday, the ECB meeting takes place, as well as voting in the UK general election. It is expected that the current US rate will be maintained, so the focus of speculators will shift towards the press conference of the heads of the Central Bank.

The Conservative Party looks likely to win the election comfortably. As a result, poll results have started to have less and less influence over the price of the pound.

December 15 is the deadline for the next increase in US tariffs on Chinese goods. Chinese authorities said they would like to conclude a trade agreement with the US as soon as possible. It is not known whether they will actually conclude any deal at all.

The euro is near the balance line. A lot of information is set to be published regarding the UK economy today. We believe that it will have a strong impact on all currencies paired with the British pound. Accordingly, the lack of dynamism regarding USD should trigger an echo effect in the EURUSD pair via the main EURGBP cross currency. According to the forecast, we are sticking with the likelihood of a weakening euro. If bears are able to lock down the 1.1030-1.1035 area then according to the price pattern, it will be possible to expect to see some sort of recovery resulting from the Christine Lagarde press conference scheduled for later in the day.

By Alpari.com

Boris Johnson’s Brexit plans mean short-term gain, long-term pain for the pound

By George Prior

The British pound and UK financial assets will surge on a Boris Johnson victory – but the relief for the Brexit-ravaged UK currency will be short-lived, warns the CEO of one of the world’s largest independent financial advisory organizations.

The warning from Nigel Green, founder and chief executive of deVere Group, comes as sterling hits its highest level since April as Mr Johnson’s Conservatives hold polling leads ahead of Thursday’s general election.

In early Monday trading, the pound was recently up 0.25 per cent on the U.S. dollar, reaching a high of $1.318. It jumped by a similar margin against the euro, with one pound buying 1.1902.

Mr Green notes: “The bounce in the pound is caused by the increasing certainty of a Conservative majority being delivered by Thursday election.

“Should Mr Johnson be returned as PM, the pound can be expected to reach $1.35.

“A hung parliament would intensify current uncertainty – due to there being the possibility of another EU referendum and another Scottish independence referendum.

“The uncertainty would not only weigh on the pound but it would continue to dampen business investment which, of course, will drag on economic growth.”

However, the deVere CEO’s message does come with a warning.

“The pound’s relief rally will be short-lived.  In the medium to long-term Boris Johnson’s Brexit agenda could come back to deliver another bloody nose to the currency,” he says.

“The serious work of negotiating a trade deal only begins on January 31.  There is then only 11 months to achieve this. It will be a race against the clock. Should this mammoth and complex deal not be struck before the December 2020 deadline, the UK will be forced into adopting unfavourable World Trade Organization terms.”

He continues: “This uncertainty will be a large dark cloud looming over the pound throughout 2020, dampening any bounce.

“And should Mr Johnson ultimately fail to meet the tight deadline, the pound, UK financial assets and economic growth will be seriously impacted.”

Mr Green concludes: “Boris Johnson’s approach is likely to produce short-term gain but long-term pain for the pound.

“Investors can help shield themselves from the risks of market uncertainty and position themselves to capitalise on the opportunities through exposure to a broad range of assets, currencies and geographic regions.”

About:

deVere Group is one of the world’s largest independent advisors of specialist global financial solutions to international, local mass affluent, and high-net-worth clients.  It has a network of more than 70 offices across the world, over 80,000 clients and $12bn under advisement


Forex Technical Analysis & Forecast 09.12.2019 (EURUSD, GBPUSD, USDCHF, USDJPY, AUDUSD, USDRUB, USDCAD, GOLD, BRENT, BTCUSD)

Article By RoboForex.com

EURUSD, “Euro vs US Dollar”

EURUSD is forming the third descending wave towards 1.1026. After that, the instrument may correct to reach 1.1067 and then resume trading inside the downtrend with the first target at 1.1019.

EURUSD
Risk Warning: the result of previous trading operations do not guarantee the same results in the future

GBPUSD, “Great Britain Pound vs US Dollar”

After finishing the ascending wave at 1.3166, GBPUSD has completed the descending impulse towards 1.3100; right now, it is consolidating around 1.3138. According to the main scenario, the pair is expected to break 1.3100 to the downside and then continue moving inside the downtrend with the short-term target at 1.3000.

GBPUSD
Risk Warning: the result of previous trading operations do not guarantee the same results in the future

USDCHF, “US Dollar vs Swiss Franc”

After reaching the short-term target at 0.9855, USDCHF has completed the correction towards 0.916; right now, it is moving downwards. Possibly, today the pair may form a new descending structure towards 0.9880 and then consolidate around this level. If later the price breaks this range to the downside, the market may start a new decline to reach 0.9835; if to the upside – form one more ascending structure with the target at 0.9990.

USDCHF
Risk Warning: the result of previous trading operations do not guarantee the same results in the future

USDJPY, “US Dollar vs Japanese Yen”

USDJPY is still consolidating around 108.66. Today, the pair may fall to break 108.27 and then start a new correction with the short-term target at 107.05.

USDJPY
Risk Warning: the result of previous trading operations do not guarantee the same results in the future

AUDUSD, “Australian Dollar vs US Dollar”

AUDUSD is correcting inside Flag pattern to reach 0.6806. After that, the pair may grow towards 0.6834, thus forming a new consolidation range. If later the price breaks this range to the upside, the market may start another growth to reach 0.6860; if to the downside – resume trading downwards with the target at 0.6700.

AUDUSD
Risk Warning: the result of previous trading operations do not guarantee the same results in the future

USDRUB, “US Dollar vs Russian Ruble”

USDRUB is moving downwards. Possibly, the pair may break 63.61 and then continue trading inside the downtrend with the short-term target at 63.15. After that, the instrument may form one more ascending structure to return o 63.61 and test it from below.

USDRUB
Risk Warning: the result of previous trading operations do not guarantee the same results in the future

USDCAD, “US Dollar vs Canadian Dollar”

USDCAD is moving upwards. Possibly, the pair may reach 1.3282 and then form a new descending structure to break 1.3188. Later, the market may continue trading inside the downtrend with the first target at 1.3100.

USDCAD
Risk Warning: the result of previous trading operations do not guarantee the same results in the future

XAUUSD, “Gold vs US Dollar”

Gold is falling with the target at 1457.87. After that, the instrument may start a new correction towards 1468.46 and then resume moving downwards with the short-term target at 1448.45.

GOLD
Risk Warning: the result of previous trading operations do not guarantee the same results in the future

BRENT

After breaking 64.50 to the upside, Brent is trading to test this level from above. The main scenario implies that the price may continue trading inside the uptrend with the short-term target at 68.00.

BRENT
Risk Warning: the result of previous trading operations do not guarantee the same results in the future

BTCUSD, “Bitcoin vs US Dollar”

BTCUSD is consolidating around 7330.00. Possibly, the pair may break this range to the upside and reach the first target at 8165.00, at least. Later, the market may start another correction towards 7400.00.

BTCUSD

Article By RoboForex.com

Attention!
Forecasts presented in this section only reflect the author’s private opinion and should not be considered as guidance for trading. RoboForex LP bears no responsibility for trading results based on trading recommendations described in these analytical reviews.

Fibonacci Retracements Analysis 09.12.2019 (GOLD, USDCHF)

Article By RoboForex.com

XAUUSD, “Gold vs US Dollar”

As we can see in the H4 chart, after finishing the descending wave at 38.2% fibo, XAUUSD is correcting. The first correctional wave reached 23.6% fibo, while the second one tried to reach 38.2% fibo at 1488.16, but failed and the pair fell instead. The next wave may break the above-mentioned level and then continue growing towards 50.0% and 61.8% fibo at 1501.30 and 1514.30 respectively. After completing the correctional uptrend, the instrument may break the local low at 1445.60 and continue falling towards its mid-term target, which is 50.0% fibo at 1413.85.

GOLD_H4
Risk Warning: the result of previous trading operations do not guarantee the same results in the future

In the H1 chart, the divergence made the pair start a new descending correctional wave, which has reached 76.0% fibo, thus indicating a new wave to the upside to reach the local high at 1486.05.

GOLD_H1
Risk Warning: the result of previous trading operations do not guarantee the same results in the future

USDCHF, “US Dollar vs Swiss Franc”

As we can see in the H4 chart, the divergence made the pair stop growing at the mid-term high at start a new descending wave, which has almost reached 50.0% fibo. After breaking this level and fixing below it, the price may continue falling towards 61.8% and 76.0% fibo at 0.9800 and 0.9748 respectively.

USDCHF_H4
Risk Warning: the result of previous trading operations do not guarantee the same results in the future

In the H1 chart, after finishing a quick descending wave, USDCHF is correcting and has almost reached 38.2% fibo at 0.9919. The next correctional targets may be 50.0% and 61.8% fibo at 0.9939 and 0.9959 respectively. The support is the low at 0.9855.

USDCHF_H1

Article By RoboForex.com

Attention!
Forecasts presented in this section only reflect the author’s private opinion and should not be considered as guidance for trading. RoboForex LP bears no responsibility for trading results based on trading recommendations described in these analytical reviews.

Trader predicts Assets direction with this forward-looking indicator

By TheTechnicalTraders.com

Great traders are often the result of dedication to principle, theory, price study, and a solid understanding of Intermarket market dynamics.  The one thing that can’t be taught, though, is experience behind the screens and with the markets.

The longer a trader spends working with the charts, trading the markets and studying the trends/indicators, the more knowledge, experience, and capability that trader has in being able to see and predict future price moves.

We believe it is the same way with other professions in life – a professional race car driver, a professional pilot or ship captain.  Any profession where an individual is “at the helm” of some vehicle, instrument or live-action event, that individual will, over time, hone his/her skills to be able to foresee and manage certain aspects of the live operation better than someone without the experience.

One might want to call this a “sixth-sense”, but we believe it is simply applied knowledge and experience.  These individuals see and feel things that others simply miss or brush off as unimportant.

Trading is the same way and traders will become better and more skilled by following the charts very closely and watching how price reacts to geopolitical and regional economic events.

One of our primary price modeling tools is what we call the V10.  It has gone through a number of revisions over the years and is capable of running on almost any chart, in any time-frame.

What we learn from using this tool is when and how price rotates, confirms trend changes, sets up new triggers and more.  It also helps us to identify price cycles, when we should add-to positions, trim profits or expect a new market rally or correction.

Before you continue, take a second and join my free trend trade signals email list.

V10 Trend Trading Strategy – Average Trade 45 Days

As we expand the use of the V10 price modeling system into other markets, you’ll see how changes in price trends can assist us in seeing into the future and preparing for price rotation that others may miss completely.

Natural Gas V10 Chart Analysis

This NG chart highlights a number of price trend rotations (from RED to ORANGE to GREEN, or from GREEN to ORANGE to RED).  Each time the color leaves a primary trend color (GREEN OR RED) we have an early warning signal that price rotation is setting up.

You can see the initial uptrend in late August we set up by a RED to ORANGE trend change.  The same thing happened in late October.  Now, a GREEN to ORANGE trend change setup near mid-November warning us that NG was going to move lower in the future.

These types of setups appear in all types of charts, asset classes, and time-frames and soon we will make different versions available so we have long term investing, trend trading, swing trading, and momentum trader signals.

The Power of Cycles Within Price Action

When attempting to interpret price modeling systems or indicators with cycle analysis utilities, it is important to understand that cycles don’t drive price moves.  Price moves drive cycle rotations.  Knowing when price cycles are topping or bottoming can assist traders in understanding where and when new trade setups are viable and when to trim profits off existing trades.

If we know when the most active and relevant cycle is trending, topping or bottoming and the expected cycle length for a potential price trend, then we can make a more informed determination about the viability of the trade setup and risk factors.

We are also able to use the price modeling systems and cycle modeling systems to better understand how far price may move, when we may begin to see price weakness in the trend and other important factors to help us manage our trade properly and reduce risks.  This is where things get really interesting and exciting.

Example SP500 Predicted Price Move

How I Predict Future Price Movement

This last chart shows you the price of Natural Gas futures.  We have overlaid our proprietary Cycle Modeling tool onto it so you can clearly see how the price has moved in alignment with the cycles.  Follow the LIGHT BLUE cycle line on the chart and try to understand that the range/height of the cycle lines does not correlate to price levels.  They represent the “intensity” of the cycle peak or trough.

A higher peak on the cycle line suggests this upside cycle peak has a higher intensity/probability than a lower cycle peak.  We gauge these rotations as a measure of intensity or amplitude.  Lower cycle troughs suggest a price bottom may have more intensity/amplitude in price than a moderately higher cycle trough.

Follow the three-cycle lows starting near early October on this chart.  Each of them resulted in deeper Cycle troughs on our Cycle modeling tool.  Yet, the real price reaction was to set up a small inverted Head-n-Shoulders bottom pattern.  The last cycle trough low didn’t result in a deeper price level, but it did result in the completion of the bottom pattern that prompted an immediate upside price rally – more intensity.

We’ve also highlighted some of our most recent trades related to our analysis using the V10 and our Cycle modeling tool.  +35% over the past 4 months on three successful trades – we’re pretty happy about that.

Also, keep in mind that we are not showing you what the cycle modeling tool or the V10 is predicting for the future.  We reserve that for our valued subscribers/members.  We know where the cycle and other predictive modeling systems are telling us the price will go, but we can’t share it with you (yet).

Concluding Thoughts:

Since 2001, our focus has been on learning and mastering the tools we have developed and use as well as the Cycle Modeling tools so that we can follow the markets more closely, learn to provide better opportunities and attempt to identify the highest probability trades for our members.

What we never expected was that our efforts to study, learn and apply these tools would provide us with that “sixth-sense” ability to attempt to see into the future and to attempt to predict 10 to 20+ days into the future.

Our modeling tools share opportunities with us all over the markets and across multiple instruments and time-frames.  We recently posted our gold and gold miners price/cycle forecast here. We focus on Daily and 30-minute intervals for our members, but we see these opportunities across all levels intervals – from 1 minute all the way to monthly/quarterly.

The one thing we are certain of is that our members continually write to us about how important it is to them to have us explain the setups, trends, cycles and future market implications to them in our daily market videos.  They don’t have to try to learn to do this type of cycle research on their own, we give them the details every morning before the markets open and any trade signal we have for SP500, gold, oil, nat gas, bonds, and more.

Visit my website at TheTechnicalTraders.com

Chris Vermeulen
Found of Technical Traders Ltd.