Author Archive for InvestMacro – Page 125

High US Retail Sales expectations – The USD/JPY set to test 108?

By Admiral Markets

Economic Event

Source: Economic Events December 13, 2019 – Admiral Markets’ Forex Calendar

After the Fed rate decision last Wednesday, we want to concentrate on the USD/JPY and the upcoming release of US Retail Sales data into the weekly close.

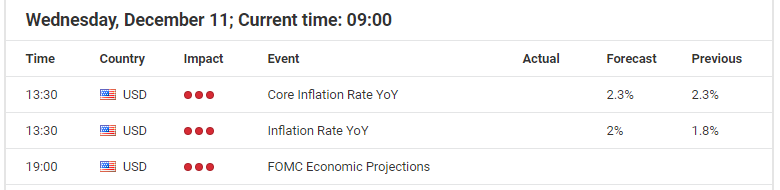
The Fed, as expected, didn’t announce a rate cut, and presented a ‘balanced’ statement, the Fed dot plot likewise signalled no interest rate changes in 2020, and the Fed Watch Tool remained at an expectation of around 60% of at least one 25 basis point cut for 2020, which resulted in subdued volatility in the USD/JPY, US Retail Sales could change that today.

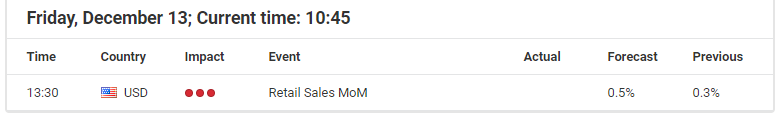
Last month, US retail trade rose 0.3 percent from a month earlier, reversing a 0.3 percent drop in September and beating market expectations of 0.2 percent. The rebound in trade was driven by motor vehicle sales and higher gasoline prices, but expectations of 0.5% seem a little too optimistic and any disappointment could push the Greenback lower.

In addition to that, comments from the BoJ on Wednesday stated that it expects a sizable impact from the economic package from prime minister Shinzo Abe and that the BoJ could, as a result, modify its GDP forecast in January.

That said, we remain cautious in regards to an overly bearish USD/JPY outlook into the weekly, but also yearly close (probably especially with the current erratic developments around the trade ‘deal’ between the US and China and open question whether and how US tariffs on Chinese goods from December 15, will go into effect), but still consider the USD/JPY an attractive Short candidate with a first target on the downside around 108.00 where a break lower activates 106.80/107.00:

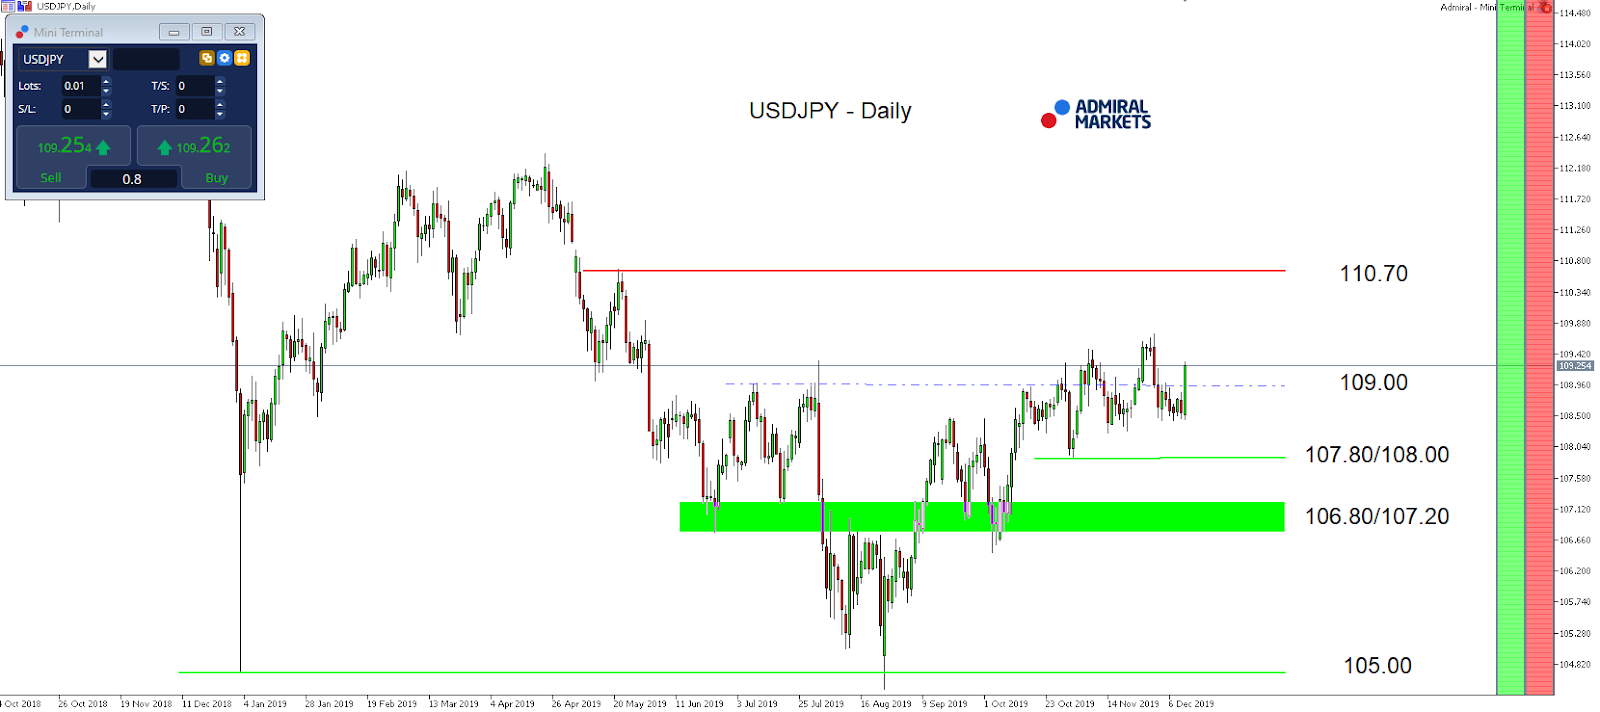
Source: Admiral Markets MT5 with MT5-SE Add-on USD/JPY Daily chart (between 04 October 2018 to 12 December 2019). Accessed: 12 December 2019 at 10:00 PM GMT – Please note: Past performance is not a reliable indicator of future results, or future performance.

In 2014, the value of the USD/JPY increased by 13.7%, in 2015, it increased by 0.5%, in 2016, it fell by 2.8%, in 2017, it fell by 3.6%, in 2018, it fell by 2.7%, meaning that after five years, it was up by 4.1%.

Discover the world’s #1 multi-asset platform

Admiral Markets offers professional traders the ability to trade with a custom, upgraded version of MetaTrader 5, allowing you to experience trading at a significantly higher, more rewarding level. Experience benefits such as the addition of the Market Heat Map, so you can compare various currency pairs to see which ones might be lucrative investments, access real-time trading data, and so much more. Click the banner below to start your FREE download of MT5 Supreme Edition!

Download MetaTrader 5 and begin trading today!

Disclaimer: The given data provides additional information regarding all analysis, estimates, prognosis, forecasts or other similar assessments or information (hereinafter “Analysis”) published on the website of Admiral Markets. Before making any investment decisions please pay close attention to the following:

  1. This is a marketing communication. The analysis is published for informative purposes only and are in no way to be construed as investment advice or recommendation. It has not been prepared in accordance with legal requirements designed to promote the independence of investment research, and that it is not subject to any prohibition on dealing ahead of the dissemination of investment research.
  2. Any investment decision is made by each client alone whereas Admiral Markets shall not be responsible for any loss or damage arising from any such decision, whether or not based on the Analysis.
  3. Each of the Analysis is prepared by an independent analyst (Jens Klatt, Professional Trader and Analyst, hereinafter “Author”) based on the Author’s personal estimations.
  4. To ensure that the interests of the clients would be protected and objectivity of the Analysis would not be damaged Admiral Markets has established relevant internal procedures for prevention and management of conflicts of interest.
  5. Whilst every reasonable effort is taken to ensure that all sources of the Analysis are reliable and that all information is presented, as much as possible, in an understandable, timely, precise and complete manner, Admiral Markets does not guarantee the accuracy or completeness of any information contained within the Analysis. The presented figures refer that refer to any past performance is not a reliable indicator of future results.
  6. The contents of the Analysis should not be construed as an express or implied promise, guarantee or implication by Admiral Markets that the client shall profit from the strategies therein or that losses in connection therewith may or shall be limited.
  7. Any kind of previous or modeled performance of financial instruments indicated within the Publication should not be construed as an express or implied promise, guarantee or implication by Admiral Markets for any future performance. The value of the financial instrument may both increase and decrease and the preservation of the asset value is not guaranteed.
  8. The projections included in the Analysis may be subject to additional fees, taxes or other charges, depending on the subject of the Publication. The price list applicable to the services provided by Admiral Markets is publicly available from the website of Admiral Markets.
  9. Leveraged products (including contracts for difference) are speculative in nature and may result in losses or profit. Before you start trading, you should make sure that you understand all the risks.

By Admiral Markets

Japanese Candlesticks Analysis 12.12.2019 (GOLD, NZDUSD)

Article By RoboForex.com

XAUUSD, “Gold vs US Dollar”

As we can see in the H4 chart, the ascending tendency continues. After completing several reversal patterns, including Inverted Hammer, close to the channel’s downside, XAUUSD is trying to reverse. In this case, the price may form a slight correction and resume growing with the upside target at 1488.88. At the same time, we shouldn’t exclude an opposite scenario, which implies that the instrument may continue falling towards 1455.55.

GOLD
Risk Warning: the result of previous trading operations do not guarantee the same results in the future

NZDUSD, “New Zealand vs. US Dollar”

As we can see in the H4 chart, the ascending tendency continues. After forming several reversal patterns, including Shooting Star, near the channel’s upside border, NZDUSD is trying to reverse. Later, the market may start a new decline to reach the closest support level at 0.6515. At the same time, one shouldn’t exclude an opposite scenario, according to which the instrument may update its highs and grow towards 0.6610.

NZDUSD

Article By RoboForex.com

Attention!
Forecasts presented in this section only reflect the author’s private opinion and should not be considered as guidance for trading. RoboForex LP bears no responsibility for trading results based on trading recommendations described in these analytical reviews.

Murrey Math Lines 12.12.2019 (USDCHF, GOLD)

Article By RoboForex.com

USDCHF, “US Dollar vs Swiss Franc”

In the H4 chart, USDCHF is moving below 3/8. In this case, the price is expected to continue falling to reach the support at 0/8. However, this scenario may no longer be valid if the price breaks 3/8 to the upside. After that, the instrument may continue growing towards the resistance at 5/8.

USDCHF_H4
Risk Warning: the result of previous trading operations do not guarantee the same results in the future

As we can see in the M15 chart, the pair has broken the downside line of the VoltyChannel indicator and, as a result, may continue trading downwards.

USDCHF_M15
Risk Warning: the result of previous trading operations do not guarantee the same results in the future

XAUUSD, “Gold vs US Dollar”

In the H4 chart, XAUUSD is moving above 5/8. In this case, the price may break 7/8 and continue trading upwards to reach the resistance at 8/8. However, this scenario may no longer be valid if the price breaks 6/8 to the downside. After that, the instrument may continue falling towards the support at 5/8.

GOLD_H4
Risk Warning: the result of previous trading operations do not guarantee the same results in the future

As we can see in the M15 chart, the pair has broken the upside line of the VoltyChannel indicator and, as a result, may continue the ascending tendency.

GOLD_M15

Article By RoboForex.com

Attention!
Forecasts presented in this section only reflect the author’s private opinion and should not be considered as guidance for trading. RoboForex LP bears no responsibility for trading results based on trading recommendations described in these analytical reviews.

The Analytical Overview of the Main Currency Pairs on 2019.12.12

by JustForex

The EUR/USD currency pair

Technical indicators of the currency pair:
  • Prev Open: 1.10885
  • Open: 1.11289
  • % chg. over the last day: +0.36
  • Day’s range: 1.10818 – 1.10848
  • 52 wk range: 1.0884 – 1.1623

The EUR/USD currency pair rose during yesterday’s trading. The US dollar weakened after the Fed meeting. The regulator kept interest rates unchanged at 1.75% and gave a signal that they are likely to remain unchanged until the end of 2020, while it is expected that moderate economic growth and low unemployment will continue until the next year’s presidential election . At the moment, the key support and resistance levels are 1.11200 and 1.11500, respectively. Open positions from these marks.

The Economic News Feed for 12.12.2019:

  • – ECB decision on interest rate – 14:45 (GMT+2:00);
  • – US manufacturer price index – 15:30 (GMT+2:00).
EUR/USD

Indicators point to the strength of buyers: the price is being traded above 50 MA and 100 MA.

The MACD histogram is in the positive zone, but below the signal line, which gives a weak signal to buy EUR/USD.

The Stochastic Oscillator is near the oversold zone, the% K line is below the% D line, which indicates a bearish sentiment.

Trading recommendations
  • Support levels: 1.11200, 1.10900, 1.10600
  • Resistance levels: 1.11500, 1.11800

If the price consolidates above 1.11500, expect further growth toward 1.11800.

Alternatively, the quotes could fix below 1.11200 and descend toward 1.10900-1.10750.

The GBP/USD currency pair

Technical indicators of the currency pair:
  • Prev Open: 1.31546
  • Open: 1.31964
  • % chg. over the last day: -0.12
  • Day’s range: 1.32074 – 1.32097
  • 52 wk range: 1.1959 – 1.3385

The GBP/USD currency pair has also moved up. Today, investors will look into the early parliamentary elections. Prime Minister Boris Johnson has decided to hold early parliamentary elections, as he hopes that the new parliament will support his Brexit deal. At the moment, the key support level is 1.31900. The key resistance level is 1.32250. We recommend opening positions from these marks.

The news background on the UK economy is calm. Today, parliamentary elections will be held.

GBP/USD

Indicators point to the strength of buyers: the price has fixed above 50 MA and 100 MA.

The MACD histogram is in the positive zone, but below the signal line, which gives a weak signal to buy GBP/USD.

The Stochastic Oscillator is in the neutral zone, the %K line crossed the %D line. There are no signals.

Trading recommendations
  • Support levels: 1.31900, 1.31600, 1.31200
  • Resistance levels: 1.32250, 1.32600

If the price consolidates above 1.32250, expect further growth toward 1.32600-1.32800.

Alternatively, the quotes could fix below 1.31900 and descend toward 1.31600-1.31500.

The USD/CAD currency pair

Technical indicators of the currency pair:
  • Prev Open: 1.32300
  • Open: 1.31723
  • % chg. over the last day: -0.40
  • Day’s range: 1.31667 – 1.31694
  • 52 wk range: 1.2727 – 1.3664

During yesterday’s trading, the USD/CAD quotes fell significantly due to Fed forecasts. The currency pair fell by more than 60 points. At the moment, the trading instrument is in lateral movement. The local support and resistance levels are still 1.31550 and 1.31800, respectively. We recommend paying attention to the dynamics of oil prices. Open positions from key levels.

Today, the publication of important news from Canada is not expected. We recommend you to pay attention to the speech of the head of the Bank of Canada.

USD/CAD

Indicators point to the strength of sellers: the price is being traded below 50 MA and 100 MA.

The MACD histogram is in the negative zone, but above the signal line, which gives a weak signal to sell USD/CAD.

The Stochastic Oscillator is in the neutral zone, the %K line crossed the %D line. There are no exact signals.

Trading recommendations
  • Support levels: 1.31550, 1.31200
  • Resistance levels: 1.31800, 1.32150, 1.32500

If the price consolidates below 1.31550, expect the quotes to descend toward 1.31550 and eventually reach 1.31200-1.31000.

Alternatively, the quotes could correct toward 1.32150-1.32300.

The USD/JPY currency pair

Technical indicators of the currency pair:
  • Prev Open: 108.716
  • Open: 108.550
  • % chg. over the last day: -0.14
  • Day’s range: 108.608 – 108.656
  • 52 wk range: 104.97 – 114.56

Quotes USD/JPY also fell during yesterday’s trading. Today, during the Asian trading session, the USD/JPY currency pair has moved into recovery. Currently, the key support and resistance levels are 108.600 and 108.800, respectively. We recommend you to pay attention to the dynamics of yield on US government bonds and open positions from key levels.

The Economic News Feed for 12.12.2019 is calm.

USD/JPY

Indicators do not give accurate signals: the price is crossing 50 MA and 100 MA.

The MACD histogram is in the negative zone, but above the signal line, which gives a weak signal to sell USD/JPY.

The Stochastic Oscillator is in the overbought zone, the %K line crosses the %D line. There are no exact signals.

Trading recommendations
  • Support levels: 108.600, 108.400

by JustForex

EURUSD: price settles at 90th degree ahead of ECB meeting

By Alpari.com

On Wednesday the 11th of December, the EURUSD pair closed up by 0.34% or 37 points (4 digits). The euro rose sharply after a US Federal Reserve meeting. The Federal Open Market Committee (FOMC) kept interest rates in the 1.5%-1.75% range, and also made it clear that it intends to take a break in 2020. Most committee members expect the base interest rate to remain unchanged until at least 2021.

The forecast for the US GDP index in 2019 remained unchanged at +2.2%, and +2.0% in 2020. The forecast for the unemployment rate in 2019 was reduced from 3.7% to 3.6%, and from 3.7% to 3.5% in 2020. The forecast for the personal consumption expenditures (PCE) index was reduced from 1.8% to 1.6% in 2019, and remained unchanged for 2020 at 1.9%.

Today’s news (GMT+3):

  • 10:00 Eurozone: Industrial Production s.a. (MoM) (Oct).
  • 11:30 Switzerland: SNB Interest Rate Decision, SNB Press Conference.
  • 15:45 Eurozone: ECB Interest Rate Decision.
  • 16:30 ECB Monetary Policy Statement and Press Conference.
  • 16:30 USA: Producer Price Index (MoM) (Nov), Initial Jobless Claims (Dec 6).
  • 20:45 Canada: BoC’s Governor Poloz speech.
  • The UK general election is being held today. The results will have a strong impact on the British pound, the euro and protective assets.

Рис. 1Current situation:

Speculators were not at all enthralled with the US Federal Reserve’s decision to freeze interest rates, although the situation in 2020 may change. The price jumped up to the 90th degree, with the 112th degree reversal located at 1.1171.

Traders’ attention is primarily focused on the UK general election results and ECB meetings. Since the market does not expect changes in rates from the regulator, Christine Lagarde’s speech is of the greatest interest at the press conference. Traders will closely monitor her performance in order to understand in which direction the bank will operate under her leadership.

As yesterday, there is no forecast. This is Lagarde’s first meeting, and how her speech and answers to questions from journalists will influence the price in euro pairs cannot be accurately predicted. However, we believe that market volatility will be no less than after the meeting of the US Federal Reserve. The first support is at 1.1092, the second at 1.1080. If we add the UK elections into the mix, it’s even harder to imagine where the euro and the pound will be at the end of the day.

By Alpari.com

Forex Technical Analysis & Forecast 11.12.2019 (EURUSD, GBPUSD, USDCHF, USDJPY, AUDUSD, USDRUB, USDCAD, GOLD, BRENT, BTCUSD)

Article By RoboForex.com

EURUSD, “Euro vs US Dollar”

EURUSD has completed the ascending wave at 1.1097; right now, it is consolidating at the top. Possibly, the pair may expand this range downwards and upwards, 1.1074 and 1.1084 respectively. If later the price breaks this range to the upside, the market may choose an alternative scenario and continue moving upwards to reach 1.1114; if to the downside – resume trading inside the downtrend with the first target at 1.1065.

EURUSD
Risk Warning: the result of previous trading operations do not guarantee the same results in the future

GBPUSD, “Great Britain Pound vs US Dollar”

After reaching 1.3200, GBPUSD is quickly falling and has already formed two descending impulses. Today, the pair may correct towards 1.3154 and then start a new decline with the first target at 1.3090.

GBPUSD
Risk Warning: the result of previous trading operations do not guarantee the same results in the future

USDCHF, “US Dollar vs Swiss Franc”

USDCHF has reached the downside target at 0.9835; right now, it is growing towards 0.9880. Later, the market may start a new decline to reach 0.9855 and then form one more ascending structure with the first target at 0.9970.

USDCHF
Risk Warning: the result of previous trading operations do not guarantee the same results in the future

USDJPY, “US Dollar vs Japanese Yen”

USDJPY has reached 108.75. Possibly, today the pair may fall to break 108.50 and then continue moving downwards with the target at 108.27.

USDJPY
Risk Warning: the result of previous trading operations do not guarantee the same results in the future

AUDUSD, “Australian Dollar vs US Dollar”

AUDUSD has reached the target of Flag pattern at 0.6807; right now, it is growing towards 0.6834. Possibly, the pair may reach this level and then resume trading inside the downtrend with the target at 0.6817.

AUDUSD
Risk Warning: the result of previous trading operations do not guarantee the same results in the future

USDRUB, “US Dollar vs Russian Ruble”

USDRUB is moving downwards. Possibly, today the pair may test 63.64 from below and then form a new descending structure with the short-term target at 63.04.

USDRUB
Risk Warning: the result of previous trading operations do not guarantee the same results in the future

USDCAD, “US Dollar vs Canadian Dollar”

USDCAD is moving downwards to reach 1.3217. Later, the market may form one more ascending structure towards 1.3274, thus forming a new consolidation range between these levels. If later the price breaks this range to the downside, the market may resume trading downwards to reach 1.3108; if to the upside – continue the uptrend with the target at 1.3282.

USDCAD
Risk Warning: the result of previous trading operations do not guarantee the same results in the future

XAUUSD, “Gold vs US Dollar”

Gold has completed the ascending structure at 1468.62; right now, it is falling towards 1457.21. After that, the instrument may form onу more ascending structure to return to 1468.60 and then resume moving downwards with the target at 1444.00.

GOLD
Risk Warning: the result of previous trading operations do not guarantee the same results in the future

BRENT

Brent is still consolidating around 64.60. Possibly, today the pair may fall towards 63.74 and then grow to reach 68.46. After that, the market may start a new decline towards 64.60. If later the price breaks this range to the upside, the market may form one more ascending structure with the short-term target at 68.00; if to the downside – start another correction to reach 62.55.

BRENT
Risk Warning: the result of previous trading operations do not guarantee the same results in the future

BTCUSD, “Bitcoin vs US Dollar”

BTCUSD has broken 7340.00; right now, it is still moving downwards to reach 7030.00. After that, the instrument may resume moving upwards to break 7600.00 and then continue growing with the first target at 8165.00.

BTCUSD

Article By RoboForex.com

Attention!
Forecasts presented in this section only reflect the author’s private opinion and should not be considered as guidance for trading. RoboForex LP bears no responsibility for trading results based on trading recommendations described in these analytical reviews.

Fibonacci Retracements Analysis 11.12.2019 (GBPUSD, EURJPY)

Article By RoboForex.com

GBPUSD, “Great Britain Pound vs US Dollar”

As we can see in the daily chart, the uptrend has reached 50.0% fibo. At the same time, there is a divergence on MACD, which may indicate a new pullback. However, the pair may yet continue growing towards 61.8% fibo at 1.3453. The short-term target of the above-mentioned pullback is the local support at 38.2% fibo (1.2883); the key support is the low at 1.1958.

GBPUSD_D1
Risk Warning: the result of previous trading operations do not guarantee the same results in the future

In the H4 chart, the divergence made GBPUSD start a new correction to the downside; the targets at are 23.6%, 38.2%, and 50.0% fibo at 1.2974, 1.2825, and 1.2706 respectively. The resistance is the high at 1.3215.

GBPUSD_H4
Risk Warning: the result of previous trading operations do not guarantee the same results in the future

EURJPY, “Euro vs. Japanese Yen”

As we can see in the H4 chart, EURJPY continues the uptrend towards 76.0% fibo at 121.55. After breaking this level and fixing above it, the instrument may continue growing towards the high at 123.36. The support is at 38.2% fibo (118.73).

EURJPY_H4
Risk Warning: the result of previous trading operations do not guarantee the same results in the future

In the H1 chart, the divergence on MACD made the pair start a new decline towards the support. If the price breaks it, the decline may continue to reach 61.8% fibo at 118.75. The local resistance is the high at 121.47.

EURJPY_H1

Article By RoboForex.com

Attention!
Forecasts presented in this section only reflect the author’s private opinion and should not be considered as guidance for trading. RoboForex LP bears no responsibility for trading results based on trading recommendations described in these analytical reviews.

The Analytical Overview of the Main Currency Pairs on 2019.12.11

by JustForex

The EUR/USD currency pair

Technical indicators of the currency pair:
  • Prev Open: 1.10638
  • Open: 1.10885
  • % chg. over the last day: +0.26
  • Day’s range: 1.10818 – 1.10848
  • 52 wk range: 1.0884 – 1.1623

The EUR/USD currency pair slightly increased during yesterday’s trading. At the moment, the technical pattern is ambiguous. Investors took a wait and see attitude before the Fed meeting, which will begin today and end tomorrow. Currently, the key support and resistance levels are 1.10700 and 1.10900, respectively. Open positions from these marks. We also recommend you to pay attention to the publication of important economic reports from the United States.

The Economic News Feed for 11.12.2019:

  • – Basis Consumer Price Index (US) – 15:30 (GMT+2:00);
  • – Fed Interest Rate Decision (US) – 21:00 (GMT+2:00);
EUR/USD

Indicators point to the strength of buyers: the price is being traded above 50 MA and 100 MA.

The MACD histogram is in the positive zone, but below the signal line, which gives a weak signal to buy EUR/USD.

The Stochastic Oscillator is near the oversold zone, the %K line is above the %D line, which indicates bullish sentiment.

Trading recommendations
  • Support levels: 1.10700, 1.10500, 1.10200
  • Resistance levels: 1.10900, 1.11100

If the price consolidates below the level of 1.10700, expect a decrease to 1.10500-1.10400.

If the price consolidates above the resistance level of 1.10900, expect an uprising toward 1.11100-1.11300.

The GBP/USD currency pair

Technical indicators of the currency pair:
  • Prev Open: 1.31391
  • Open: 1.31546
  • % chg. over the last day: -0.12
  • Day’s range: 1.31357 – 1.31475
  • 52 wk range: 1.1959 – 1.3385

In the course of yesterday’s trading on the GBP/USD currency pair, multidirectional dynamics was observed. The British pound was supported by optimistic economic data from the UK. So, GDP (q / q) did not change in the third quarter, although experts expected a decrease of 0.2%. GDP (YoY) grew in the third quarter by 0.7%, which coincided with the expectations of experts. The volume of production in the manufacturing industry grew in October by 0.2% instead of 0.1%. At the moment, the key support level is 1.31200. The key resistance level is 1.31600. We recommend opening positions from these marks.

The Economic News Feed for 11.12.2019 is calm.

GBP/USD

Indicators do not provide accurate signals: the price has crossed 50 MA and 100 MA.

The MACD histogram is in the negative zone, but above the signal line, which gives a weak signal to sell GBP/USD.

The Stochastic Oscillator is in the neutral zone, the %K line crossed %D. There are no signals.

Trading recommendations
  • Support levels: 1.31200, 1.31000, 1.30650
  • Resistance levels: 1.31600, 1.32000, 1.32250

If the price consolidates above 1.31600, expect the quotes to rise toward 1.32000.

Alternatively, the quotes could descend toward 1.31000.

The USD/CAD currency pair

Technical indicators of the currency pair:
  • Prev Open: 1.32366
  • Open: 1.32300
  • % chg. over the last day: -0.03
  • Day’s range: 1.32266 – 1.32384
  • 52 wk range: 1.2727 – 1.3664

The USD/CAD currency pair retains an ambiguous technical pattern. The trading instrument is in a flat. Investors expect additional drivers. The local support and resistance levels are still 1.32150 and 1.32500, respectively. We recommend paying attention to the dynamics of oil prices. Open positions from key levels.

The Canadian Economic News Feed for 11.12.2019 is calm. Pay attention to the US News Feed.

USD/CAD

Indicators do not give accurate signals: the price has crossed 50 MA.

The MACD histogram is near the 0 mark, there are no signals.

The Stochastic Oscillator is in the neutral zone, the %K line is above the %D line, which also gives a signal to buy USD/CAD.

Trading recommendations
  • Support levels: 1.32150, 1.31800, 1.31500
  • Resistance levels: 1.32500, 1.32850

If the price consolidates above 1.32500, expect the quotes to rise 1.32850-1.33000.

Alternatively, the quotes could descend toward 1.31800-1.31650.

The USD/JPY currency pair

Technical indicators of the currency pair:
  • Prev Open: 108.553
  • Open: 108.716
  • % chg. over the last day: +0.19
  • Day’s range: 108.698 – 108.716
  • 52 wk range: 104.97 – 114.56

The USD/JPY quotes slightly rose yesterday. Currently, the key support and resistance levels are 108.600 and 108.800, respectively. We recommend that you pay attention to the dynamics of yield on US government bonds. Open positions from key levels and pay attention to the US news background.

The Economic News Feed for 11.12.2019 is calm.

USD/JPY

Indicators do not give accurate signals: the price is crossing 100 MA.

The MACD histogram is in the positive zone, but below the signal line, which gives a weak signal to buy USD/JPY.

The Stochastic Oscillator is in the oversold zone, the %K line is below the %D line, which indicates a bearish sentiment.

Trading recommendations
  • Support levels: 108.600, 108.400
  • Resistance levels: 108.800, 109.00

If the price consolidates above 108.800, expect further growth toward 109.000.

Alternatively, the quotes could descend toward 108.400-108.200.

by JustForex

Gold bulls in a sweet spot for today’s Fed rate decision?

By Admiral Markets

Source: Economic Events December 11, 2019 – Admiral Markets’ Forex Calendar

On Wednesday the main event and focus will be on the Fed Rate Decision.

Last week, after US president Trump announced a plan to restore tariffs on steel and aluminium shipped from Brazil and Argentina, in addition to proposed tariffs “up to 100%” on certain French goods (about $2.4 billion worth) in retaliation for France’s digital services tax, risk-off in financial markets kicked in, initiating a drop in 10-year US-Treasuries yields.

As a result, Gold pushed higher, but gave back most of its gains by the weekly close, after Non-Farm Payrolls beat expectations with 266,000.

While we doubt the sustainability of the strong employment print, what will certainly be of high interest now is the Fed rate decision today.

If Trump’s statements last week are to be believed, indicating no sign of urgency for a trade deal with China and the intention to wait until after the Presidential election in 2020, then they suggest that there is a very real possibility that the next set of US tariffs, due December 15,could go into effect.

Having that in mind, this seems especially true if the Fed doesn’t deliver a dovish stance today, as Trump suggested in his tweets last Monday.

As a result, it could be in a very bullish spot with either a very dovish Fed or a risk-off mode from Trump escalating the trade war with China in the second half of the week.

In addition to that, we also want already to keep an eye on the seasonal bullish window in Gold between December 18 and January 10, where Gold saw an average gain of 47 USD for 12 of the past 15 years, while in the remaining three years, it dropped on average only 19.65 USD, while the maximum loss and the maximum drawdown of 31.03 USD.

With that in mind, technically our picture switches to Long again with Gold breaking back above 1,520 USD which would level the path up to the current yearly highs around 1,557 USD:

Source: Admiral Markets MT5 with MT5-SE Add-on Gold Daily chart (between September 11, 2018, to December 11, 2019). Accessed: December 10, 2019, at 10:00pm GMT – Please note: Past performance is not a reliable indicator of future results, or future performance.

In 2014, the value of Gold fell by 1.7%, in 2015, it fell by 10.4%, in 2016, it increased by 8.1%, in 2017, it increased by 13.1%, in 2018, it fell by 1.6%, meaning that after five years, it was up by 6.4%.

Discover the world’s #1 multi-asset platform

Admiral Markets offers professional traders the ability to trade with a custom, upgraded version of MetaTrader 5, allowing you to experience trading at a significantly higher, more rewarding level. Experience benefits such as the addition of the Market Heat Map, so you can compare various currency pairs to see which ones might be lucrative investments, access real-time trading data, and so much more. Click the banner below to start your FREE download of MT5 Supreme Edition!

Trade With MetaTrader 5

Disclaimer: The given data provides additional information regarding all analysis, estimates, prognosis, forecasts or other similar assessments or information (hereinafter “Analysis”) published on the website of Admiral Markets. Before making any investment decisions please pay close attention to the following:

  1. This is a marketing communication. The analysis is published for informative purposes only and are in no way to be construed as investment advice or recommendation. It has not been prepared in accordance with legal requirements designed to promote the independence of investment research, and that it is not subject to any prohibition on dealing ahead of the dissemination of investment research.
  2. Any investment decision is made by each client alone whereas Admiral Markets shall not be responsible for any loss or damage arising from any such decision, whether or not based on the Analysis.
  3. Each of the Analysis is prepared by an independent analyst (Jens Klatt, Professional Trader and Analyst, hereinafter “Author”) based on the Author’s personal estimations.
  4. To ensure that the interests of the clients would be protected and objectivity of the Analysis would not be damaged Admiral Markets has established relevant internal procedures for prevention and management of conflicts of interest.
  5. Whilst every reasonable effort is taken to ensure that all sources of the Analysis are reliable and that all information is presented, as much as possible, in an understandable, timely, precise and complete manner, Admiral Markets does not guarantee the accuracy or completeness of any information contained within the Analysis. The presented figures refer that refer to any past performance is not a reliable indicator of future results.
  6. The contents of the Analysis should not be construed as an express or implied promise, guarantee or implication by Admiral Markets that the client shall profit from the strategies therein or that losses in connection therewith may or shall be limited.
  7. Any kind of previous or modeled performance of financial instruments indicated within the Publication should not be construed as an express or implied promise, guarantee or implication by Admiral Markets for any future performance. The value of the financial instrument may both increase and decrease and the preservation of the asset value is not guaranteed.
  8. The projections included in the Analysis may be subject to additional fees, taxes or other charges, depending on the subject of the Publication. The price list applicable to the services provided by Admiral Markets is publicly available from the website of Admiral Markets.
  9. Leveraged products (including contracts for difference) are speculative in nature and may result in losses or profit. Before you start trading, you should make sure that you understand all the risks.

By Admiral Markets

EURUSD: euro rebounds to 1.11 ahead of US Federal Reserve meeting

By Alpari.com

On Tuesday the 10th of December, the euro was up at the close of trading. Strong ZEW data sparked a recovery to 1.1085 in European trading. In the US session, growth accelerated to 1.1098 on the back of the message from WSJ which broke the news that the US and China remain optimistic about making progress in their trade-deal negotiations. Also revealed, was that the countries have opened talks regarding the possibility of postponing the punitive hike in tariffs on a wide range of Chinese goods, which the US plans to bring into force on December 15. “Bearish” technical signals were levelled out as a result of other events reported in the news and bulls were able to claw back Friday’s losses.

Today’s news (GMT+3):

  • 16:30 USA: Consumer Price Index (MoM) (Nov).
  • 18:30 USA: EIA Crude Oil Stocks Change (Dec 6).
  • 22:00 USA: Fed Interest Rate Decision, FOMC Economic Projections.
  • 22:00 USA: Monthly Budget Statement (Nov).
  • 22:30 USA: FOMC Press Conference.

111219

Current situation:

In the end, the drop in value we expected to see did not materialise. This was down to the news backdrop working against the USD.

In Asian trading, the EURUSD pair is trading in the red, and at the time of writing, the euro is valued at 1.1088. It is also worth noting that in the early morning, GBP fell 90 points. This was down to the publication of a new YouGov poll ahead of the UK general election. According to the poll, the Conservatives Party now looks set to win 339 seats instead of the 359 predicted on November 27th. Meanwhile, the Labour Party stands to win 231 seats, which is 20 more than previously thought.

Both traders and investors are playing it safe in anticipation of the meetings of the US Federal Reserve, the ECB and the UK general election.

The next scheduled two-day meeting of the US Federal Reserve Open Market Committee began on Tuesday. The base rate of interest is expected to remain unchanged. At the end of the meeting, the bank’s management will present its forecasts as regards the development of the US economy for the next calendar year.

Today’s review comes without a forecast as we await Jerome Powell’s press conference after the FOMC meeting later in the day.

By Alpari.com