by JustForex
The EUR/USD currency pair
- Prev Open: 1.11033
- Open: 1.11020
- % chg. over the last day: -0.01
- Day’s range: 1.11020 – 1.11111
- 52 wk range: 1.0879 – 1.1572
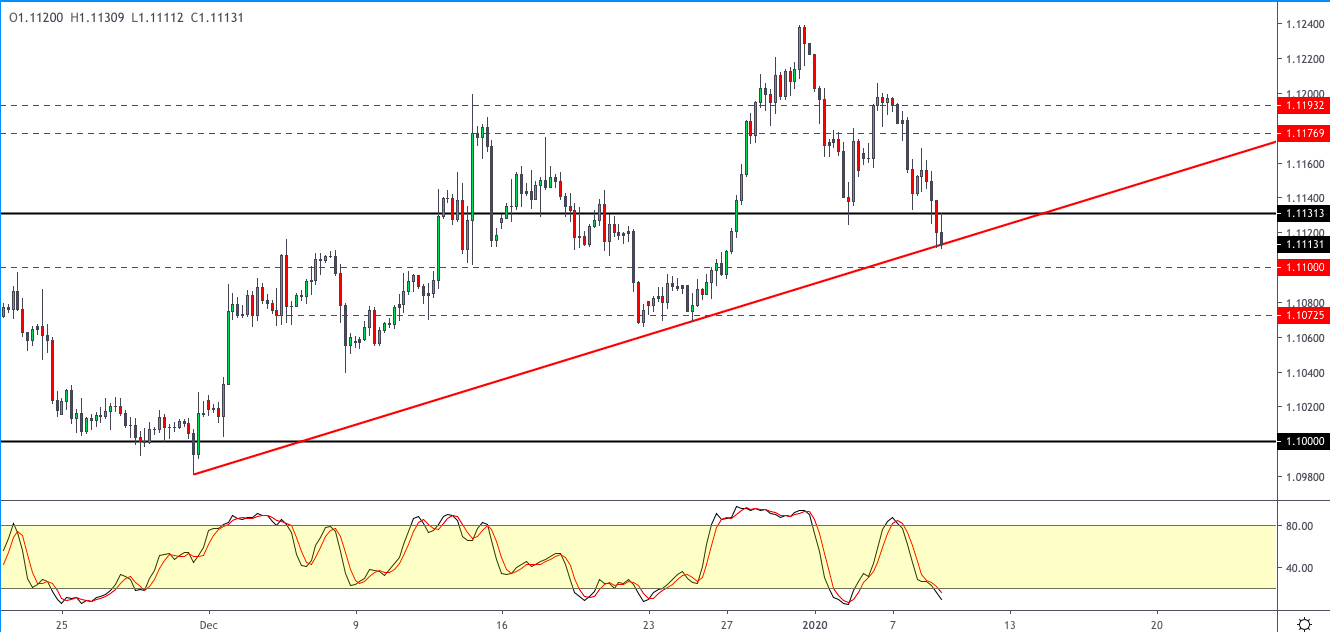
The single currency is trading stably against the USD. EUR/USD quotes are testing local support and resistance levels at 1.10950 and 1.11200, respectively. Participants in financial markets took a wait-and-see attitude before the publication of labor statistics from the USA for December. We recommend that you pay attention to the difference between the actual and forecast values of the indicators. The trade conflict between the US and China has again come to the fore. Vice Premier Liu He will leave for the United States next week to sign the first phase of the agreement. Open positions from key levels.
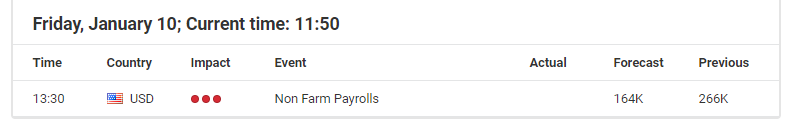
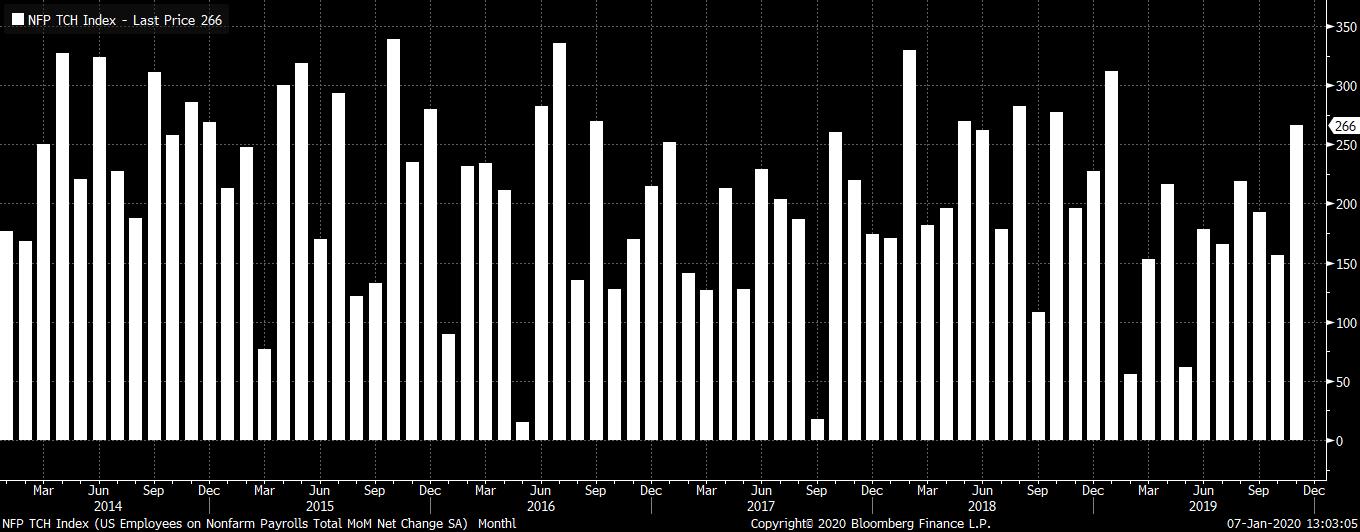
At 15:30 (GMT+2:00) the US will publish a report on the labor market.

Indicators do not give accurate signals: the price is consolidating near 50 MA.
The MACD histogram is in the negative zone, but above the signal line, which gives a weak signal to sell EUR/USD.
Stochastic Oscillator is in the neutral zone, the %K line has crossed the %D line. There are no signals at the moment.
- Support levels: 1.10950, 1.10500
- Resistance levels: 1.11200, 1.11350, 1.11650
If the price consolidates below expect a fall toward 1.10600-1.10400.
Alternatively, the quotes could grow toward 1.11500-1.11700.
The GBP/USD currency pair
- Prev Open: 1.30963
- Open: 1.30660
- % chg. over the last day: -0.22
- Day’s range: 1.30604 – 1.30916
- 52 wk range: 1.1959 – 1.3516
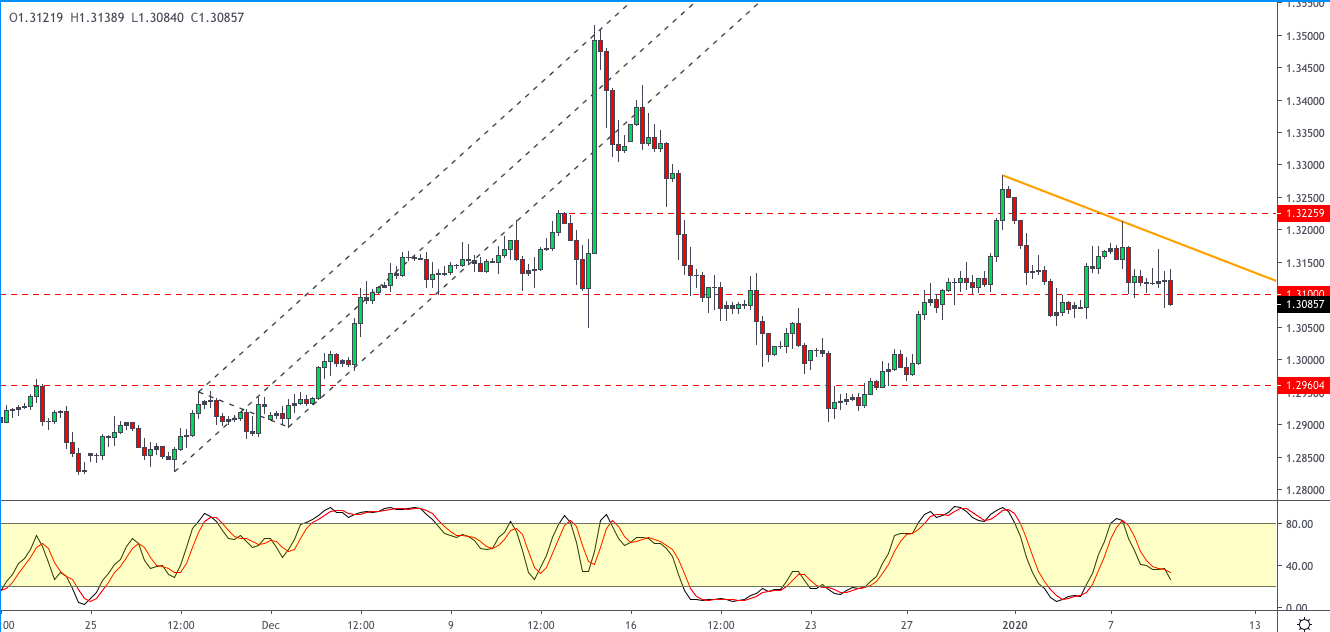
The technical pattern on the GBP/USD currency pair is still ambiguous. Sterling is trading in a flat. At the moment, the local support and resistance levels can be distinguished at 1.30550 and 1.31000, respectively. Investors expect important statistics from the United States. GBP/USD quotes have the potential to decline. We recommend keeping track of current information on the Brexit issue. Open positions from key levels.
Today, the news background on the UK economy is calm.

Indicators do not give accurate signals: the price has crossed 50 MA.
The MACD histogram is close to the 0 mark.
The Stochastic Oscillator is near the overbought zone, the %K line crossed the %D line. There are no signals at the moment.
- Support levels: 1.30550, 1.30150
- Resistance levels: 1.31000, 1.31600, 1.32000
If the price consolidates below 1.30550, expect the quotes to fall toward 1.30000.
Alternatively, the quotes could rise toward 1.31400-1.31600.
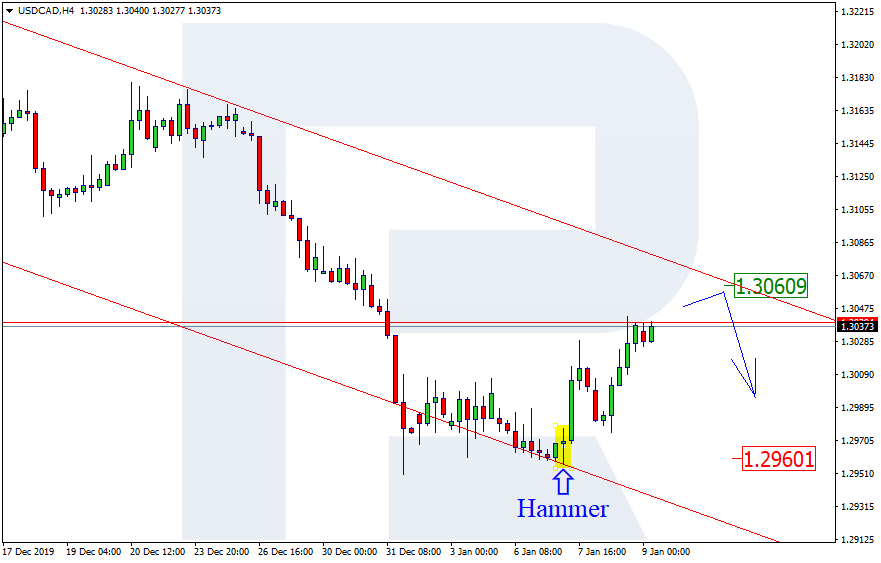
The USD/CAD currency pair
- Prev Open: 1.30386
- Open: 1.30569
- % chg. over the last day: +0.19
- Day’s range: 1.30533 – 1.30689
- 52 wk range: 1.2949 – 1.3566
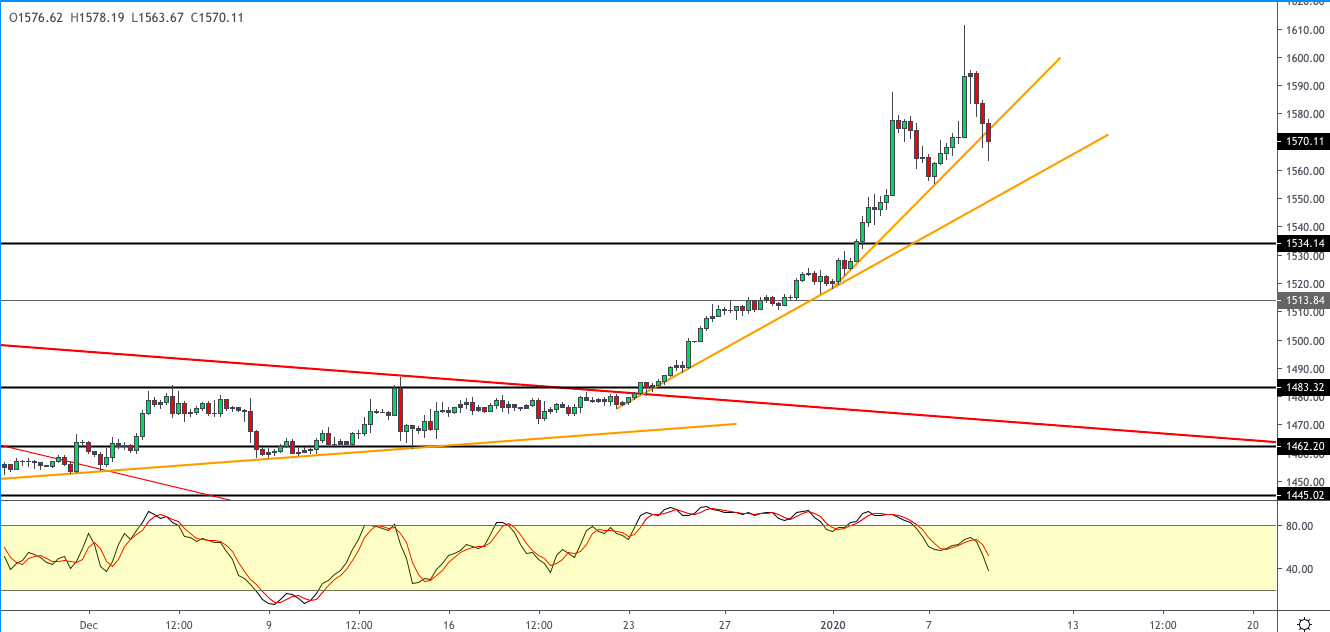
On the USD/CAD currency pair, a bullish sentiment prevails. The trading instrument has set new local highs. CAD is currently consolidating around 1.30500-1.30800. USD/CAD quotes can grow further. Investors are waiting the publication of a report on the labor market in Canada. We also recommend you to pay attention to statistical data from the United States and the dynamics of prices for oil. Open positions from key levels.
At 15:30 (GMT+2:00), labor statistics from Canada will be published.

The signals of the indicators are varied. The price has fixed above 50 MA and 100 MA, which signals the strength of buyers.
The MACD histogram is in the positive zone, but below the signal line, which gives a weak signal to buy USD/CAD.
Stochastic Oscillator is located near the oversold zone, the %K line is below the %D line, which indicates a bearish sentiment.
- Support levels: 1.30500, 1.30250, 1.30000
- Resistance levels: 1.30800, 1.31000
If the price consolidates above 1.30800, expect further growth toward 1.31200-1.31400.
Alternatively, the quotes could descend toward 1.30250-1.30000.
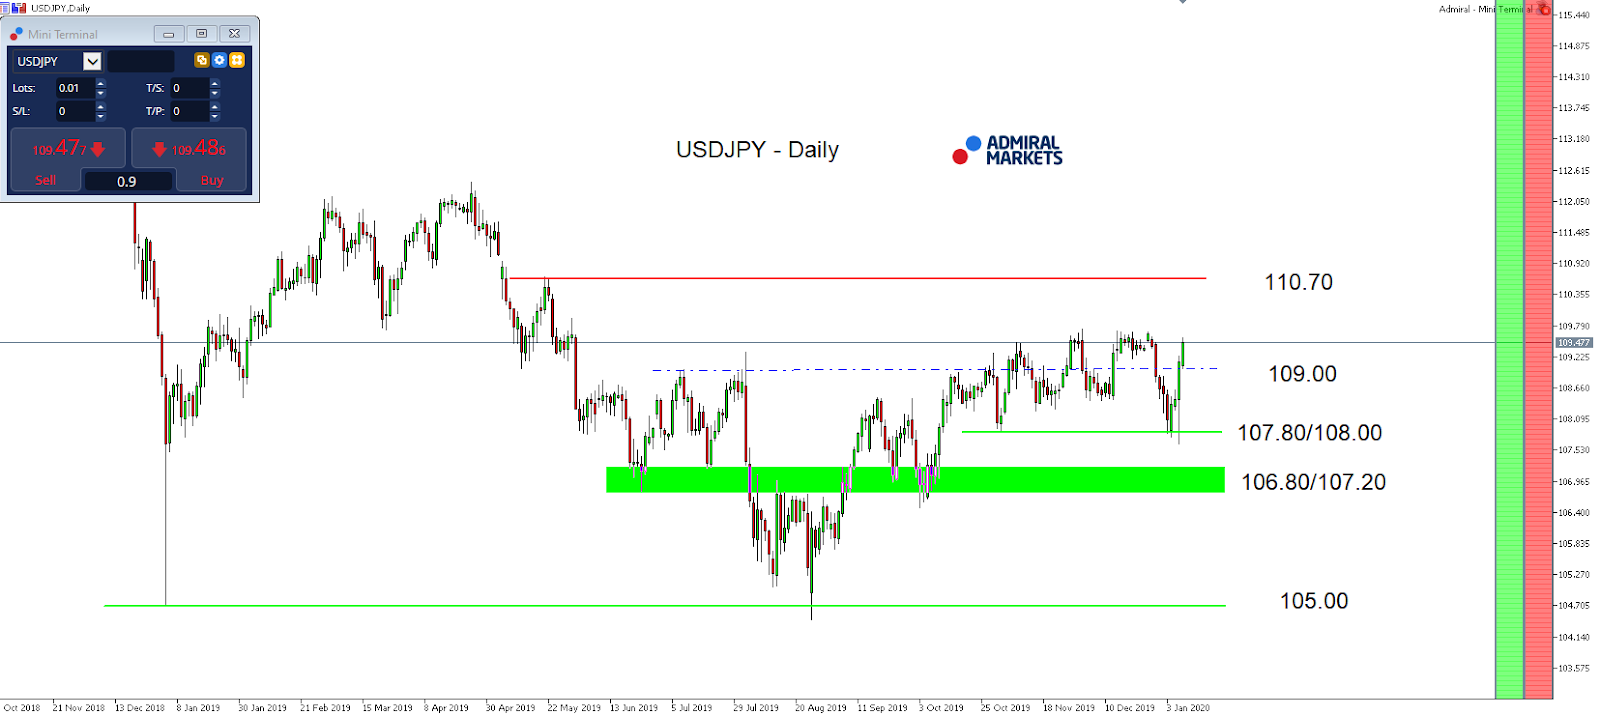
The USD/JPY currency pair
- Prev Open: 109.083
- Open: 109.510
- % chg. over the last day: +0.33
- Day’s range: 109.450 – 109.597
- 52 wk range: 104.45 – 113.53
The USD/JPY currency pair is showing aggressive purchases. Since the beginning of this week, quotes growth exceeded 170 points. The trading tool has reached key extremes. At the moment, the USD/JPY currency pair is testing the supply zone 109.600-109.700. Mark 109.250 is the immediate support. Demand for the safe haven currencies weakened amid declining fears of further escalation of the conflict in the Middle East. Today we recommend paying attention to economic data from the USA. Open positions from key levels.
The Economic News Feed for 10.01.2020 is calm.

Indicators point to the strength of buyers: the price has fixed above 50 MA and 100 MA.
The MACD histogram is in the positive zone but below the signal line, which gives a weak signal to buy USD/JPY.
The Stochastic Oscillator is in the neutral zone, the %K line crossed the %D line. There are no signals at the moment.
- Support levels: 109.250, 108.850, 108.600
- Resistance levels: 109.700, 110.000
If the price consolidates above 109.700, expect further growth toward 110.000-110.200.
Alternatively, the quotes could descend toward 108.900-108.700.
by JustForex