On Friday, January 10, the dollar index moved away from local highs. The US has published rather weak labor market statistics for December. 145K new jobs were created in the nonfarm sector of the country, which is below market expectations at 164K. Average hourly earnings growth slowed down from 3.1% (yoy) to 2.9% (yoy). The unemployment rate remained unchanged at 3.5%. At the moment, EUR/USD quotes are consolidating in the range of 1.11100-1.11350. The single currency has the potential for further recovery. Investors expect the conclusion of the phase-one trade deal between Washington and Beijing, which is scheduled for January 15. We recommend opening positions from key levels.
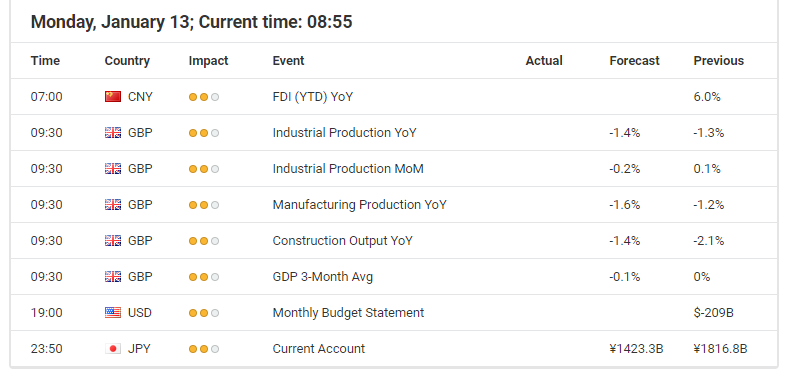
The Economic News Feed for 13.01.2020:
Today, the publication of important economic releases is not planned.
Indicators do not give accurate signals: the price has crossed 100 MA.
The MACD histogram has moved into the positive zone, indicating the bullish sentiment.
Stochastic Oscillator is in the overbought zone, the %K line has crossed the %D line. There are no signals at the moment.
Trading recommendations
Support levels: 1.11100, 1.10900
Resistance levels: 1.11350, 1.11650, 1.12000
If the price fixes above 1.11350, further growth of EUR/USD quotes is expected. The movement is tending to 1.11600-1.11800.
An alternative could be a decrease in the EUR/USD currency pair to 1.10900-1.10700.
The GBP/USD currency pair
Technical indicators of the currency pair:
Prev Open: 1.30660
Open: 1.30345
% chg. over the last day: -0.13
Day’s range: 1.30154 – 1.30450
52 wk range: 1.1959 – 1.3516
The bearish sentiment is prevailing on the GBP/USD currency pair. Currently, the British pound is testing the local support level of 1.30150. The 1.30550 mark is already a “mirror” resistance. The technical pattern signals a further fall in GBP/USD quotes. Today, financial market participants will assess important statistics on the UK economy. Positions should be opened from key levels.
News Feed on the UK Economy 13.01.2020:
– Data on the country’s GDP at 11:30 (GMT+2:00);
– Manufacturing production at 11:30 (GMT+2:00).
Indicators signal the power of sellers: the price has fixed below 50 MA and 100 MA.
The MACD histogram is in the negative zone and continues to decline, which gives a strong signal to sell GBP/USD.
Stochastic Oscillator is in the neutral zone, the %K line is below the %D line, which also indicates the bearish sentiment.
Trading recommendations
Support levels: 1.30150, 1.29700
Resistance levels: 1.30550, 1.31000, 1.31600
If the price fixes below 1.30150, a further drop in GBP/USD quotes is expected. The movement is tending to 1.29800-1.29600.
An alternative could be the growth of the GBP/USD currency pair to 1.30900-1.31200.
The USD/CAD currency pair
Technical indicators of the currency pair:
Prev Open: 1.30569
Open: 1.30500
% chg. over the last day: -0.03
Day’s range: 1.30459 – 1.30675
52 wk range: 1.2949 – 1.3566
An ambiguous technical pattern has been developed on the USD/CAD currency pair. The loonie is in a sideways trend. Unidirectional trends are not observed. At the moment, the following local support and resistance levels can be distinguished: 1.30400 and 1.30750. Investors expect additional drivers. We recommend paying attention to the dynamics of oil quotes. Positions should be opened from key levels.
The news feed on Canada’s economy is calm.
Indicators do not give accurate signals: the price has fixed between 50 MA and 100 MA.
The MACD histogram is near the 0 mark.
Stochastic Oscillator is leaving the oversold zone, the %K line is above the %D line, which indicates the bullish sentiment.
Trading recommendations
Support levels: 1.30400, 1.30200, 1.30000
Resistance levels: 1.30750, 1.31000
If the price fixes above 1.30750, USD/CAD quotes are expected to rise. The movement is tending to 1.31000-1.31200.
An alternative could be a decrease in the USD/CAD currency pair to 1.30200-1.30000.
The USD/JPY currency pair
Technical indicators of the currency pair:
Prev Open: 109.510
Open: 109.530
% chg. over the last day: +0.01
Day’s range: 109.503 – 109.648
52 wk range: 104.45 – 113.53
The USD/JPY currency pair has become stable after a significant rally last week. The trading instrument is currently consolidating. The local support and resistance levels are 109.350 and 109.700, respectively. In the near future, the technical correction of USD/JPY quotes is not excluded. We recommend following current information regarding resolving the conflict in the Middle East, as well as concluding a trade deal between the US and China. Positions should be opened from key levels.
Today, Japan’s financial markets are closed due to the holiday.
The price has fixed above 50 MA and 100 MA, which signals the power of buyers.
The MACD histogram is in the positive zone, which also gives a signal to buy USD/JPY.
Stochastic Oscillator is in the overbought zone, the %K line has crossed the %D line. There are no signals at the moment.
Trading recommendations
Support levels: 109.350, 109.000, 108.850
Resistance levels: 109.700, 110.000
If the price fixes above 109.700, further growth of the USD/JPY quotes is expected. The movement is tending to 110.000-110.200.
An alternative could be the correction of the USD/JPY currency pair to 109.000-108.800.
Everyone seems to be focused on Gold recently and seems to be ignoring the real upside potential in Silver. With all the global economic issues, military tensions, geopolitical issues, and other items continually pushed into the news cycles, it is easy to understand why traders and investors may be ignoring Silver.
Silver has really not started to move like the other precious metals. Gold is up over 45% since 2016. Palladium is up over 350% since 2016. Silver is up only 29% since 2016. The Gold to Silver ratio is currently at 86.7 – very near to the highest level on record going back over 25 years.
Historically, Silver rallies 6 to 12+ months after Gold begins a price rally. The big break in the Gold to Silver ratio comes at a time when Gold rallies by more than 30% to 60% faster than the price of Silver. In other words, when a major disparity sets up in the price of Gold compared to the price of Silver, then Silver explodes higher – which results in a drop in the Gold to Silver ratio.
Currently, the relative price of Gold to Silver is over 200%. Considering this fact and considering the under-performance of Silver recently, our researchers believe Silver is setting up a massive basing pattern in preparation for an explosive upside move.
Our research team put together this chart to help illustrate the real upside potential in Silver. This Monthly chart highlights the Gold to the Silver ratio (Darker BLUE), the price of Gold (Gold) and the price of Silver (light BLUE) over the past 20 years.
Every time Gold broke a sideways Flag formation and began to rally substantially higher, Silver followed Gold higher 5 to 12 months after with an incredible upside price rally. In 2005, Silver rallied over 100%. In 2009, Silver rallied almost 400%. Now, in 2020, could Silver rally 100%, 200%, 300% or more?
In the recent past, we’ve authored numerous articles about Gold, Silver and precious metals highlighting our expectations going forward. Our incredible research from October 8, 2018, floored many institutional traders and researchers because we were able to accurately predict the future price moves in Gold 9+ months into the future. Take a little time to read some of our earlier research posts
We believe the current setup in Gold and Silver is almost identical to previous setups where Gold rallied on economic or global concerns, prompting a massive disparity ratio between Gold and Silver. We believe Silver is setting up in a massive basing pattern that may be an incredible opportunity for skilled traders.
In Part II of this research post, we’ll highlight why we believe all skilled traders and investors should be paying very close attention to the metals markets, Miners and, in particular, Silver.
As a technical analysis and trader since 1997 I have been through a few bull/bear market cycles, I have a good pulse on the market and timing key turning points for both short-term swing trading and long-term investment capital. The opportunities are massive/life-changing if handled properly.
I urge you visit my Wealth Building Newsletter and if you like what I offer, join me with the 1 or 2-year subscription to lock in the lowest rate possible and ride my coattails as I navigate these financial markets and build wealth while others lose nearly everything they own.
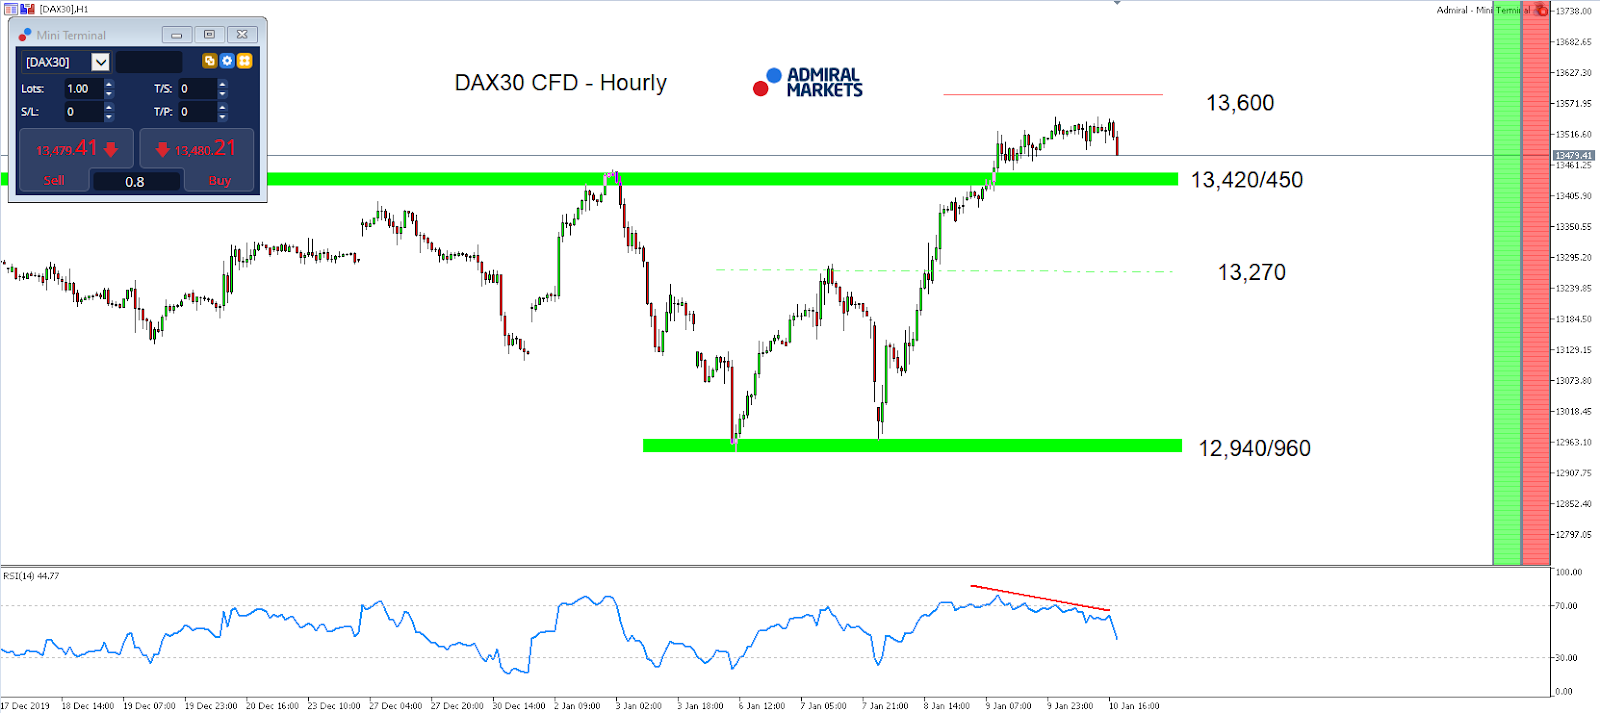
With a light economic calendar – and no further geopolitical tensions, relevant to the markets, between the US and Iran over the weekend – and the upcoming sign off the Phase 1 trade deal between the US and China coming this Wednesday, volatility in the DAX30 CFD should stay subdued.
In fact, this market environment seems very favourable for a bullish push higher, and we could potentially see the German index once again attack its current all-time highs of around 13,600 points.
In our opinion, such an upwards move seems very likely, and the region around 13,600 points acts as stop-over up to the next target, which will be around 13,800 points.
The region around 13,800 points is of higher interest, with focus on the expiration of DAX options at the EUREX next Friday, and the elevated Open Interest at the strike price of 13,800 points.
Still, bulls should be at least aware of the forming bearish divergence in the RSI(14) on H1 which points from a purely technical perspective to diminishing bullish momentum and could trigger, if bears gain at least short-term control, a bearish stint down to 13,380/400 points:
Source: Admiral Markets MT5 with MT5-SE Add-on DAX30 CFD Hourly chart (between December 17, 2019, to January 10, 2020). Accessed: January 10, 2020, at 10:00pm GMT
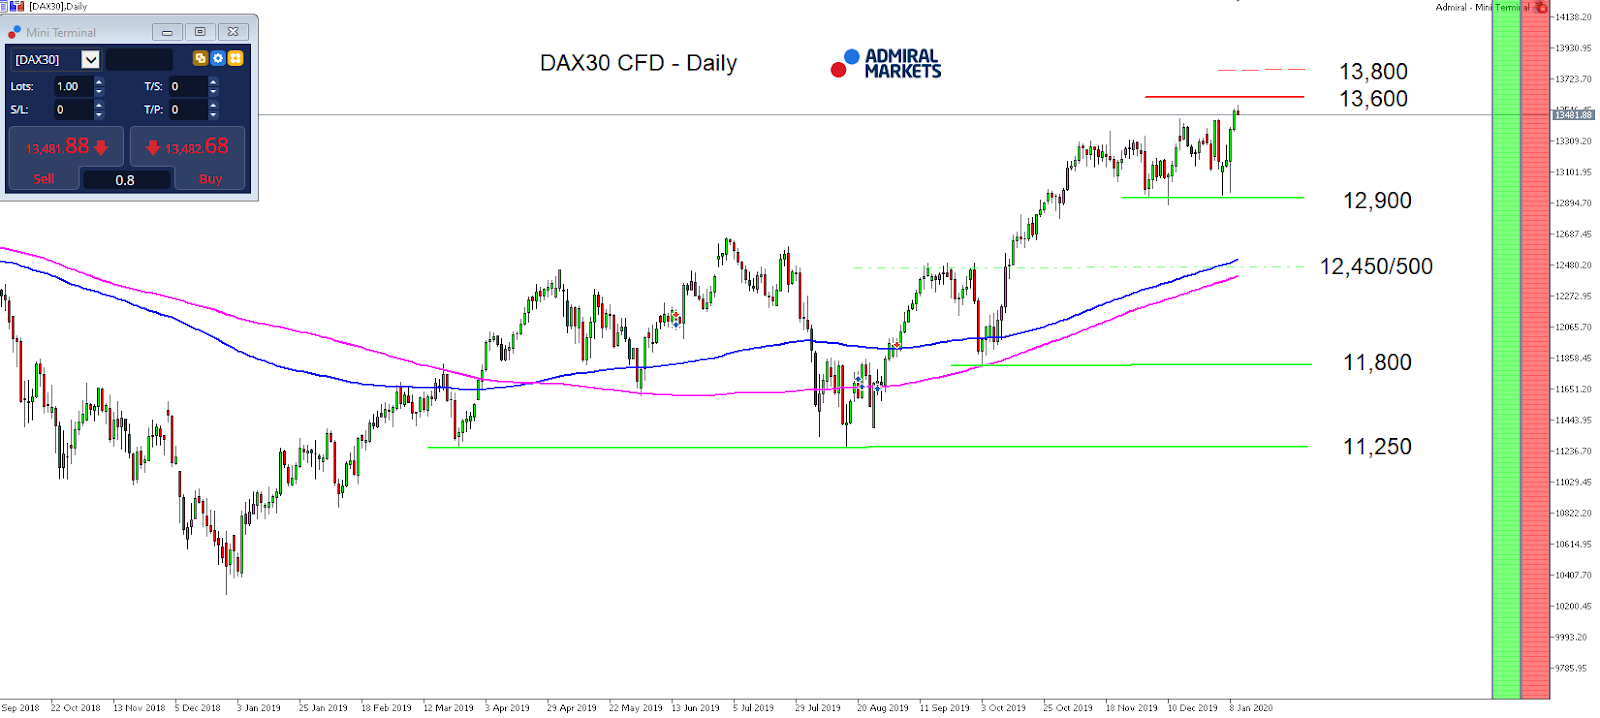
Source: Admiral Markets MT5 with MT5-SE Add-on DAX30 CFD Daily chart (between September 20, 2018, to January 10, 2020). Accessed: January 10, 2020, at 10:00pm GMT – Please note: Past performance is not a reliable indicator of future results, or future performance.
In 2015, the value of the DAX30 CFD increased by 9.56%, in 2016, it increased by 6.87%, in 2017, it increased by 12.51%, in 2018, it fell by 18.26%, in 2019, it increased by 26.44% meaning that after five years, it was up by 34.2%.
Discover the world’s #1 multi-asset platform
Admiral Markets offers professional traders the ability to trade with a custom, upgraded version of MetaTrader 5, allowing you to experience trading at a significantly higher, more rewarding level. Experience benefits such as the addition of the Market Heat Map, so you can compare various currency pairs to see which ones might be lucrative investments, access real-time trading data, and so much more. Click the banner below to start your FREE download of MT5 Supreme Edition!
Disclaimer: The given data provides additional information regarding all analysis, estimates, prognosis, forecasts or other similar assessments or information (hereinafter “Analysis”) published on the website of Admiral Markets. Before making any investment decisions please pay close attention to the following:
This is a marketing communication. The analysis is published for informative purposes only and are in no way to be construed as investment advice or recommendation. It has not been prepared in accordance with legal requirements designed to promote the independence of investment research, and that it is not subject to any prohibition on dealing ahead of the dissemination of investment research.
Any investment decision is made by each client alone whereas Admiral Markets shall not be responsible for any loss or damage arising from any such decision, whether or not based on the Analysis.
Each of the Analysis is prepared by an independent analyst (Jens Klatt, Professional Trader and Analyst, hereinafter “Author”) based on the Author’s personal estimations.
To ensure that the interests of the clients would be protected and objectivity of the Analysis would not be damaged Admiral Markets has established relevant internal procedures for prevention and management of conflicts of interest.
Whilst every reasonable effort is taken to ensure that all sources of the Analysis are reliable and that all information is presented, as much as possible, in an understandable, timely, precise and complete manner, Admiral Markets does not guarantee the accuracy or completeness of any information contained within the Analysis. The presented figures refer that refer to any past performance is not a reliable indicator of future results.
The contents of the Analysis should not be construed as an express or implied promise, guarantee or implication by Admiral Markets that the client shall profit from the strategies therein or that losses in connection therewith may or shall be limited.
Any kind of previous or modeled performance of financial instruments indicated within the Publication should not be construed as an express or implied promise, guarantee or implication by Admiral Markets for any future performance. The value of the financial instrument may both increase and decrease and the preservation of the asset value is not guaranteed.
The projections included in the Analysis may be subject to additional fees, taxes or other charges, depending on the subject of the Publication. The price list applicable to the services provided by Admiral Markets is publicly available from the website of Admiral Markets.
Leveraged products (including contracts for difference) are speculative in nature and may result in losses or profit. Before you start trading, you should make sure that you understand all the risks.
This is a trick question because it depends on who you ask.
To someone who has a good strategy and risk management scheme, Forex trading is definitely worth it. They do it consistently, and in many cases, live off of it.
If you ask someone who has tried to get rich quick through Forex trading and migrated from broker to broker because each of them is playing some kind of scam, they’ll probably say it’s not worth it.
The fact of the matter is, banks, hedge funds, and even multinational corporations engage in some form of Forex trading. And they wouldn’t be doing it, if it wasn’t worth it.
What If I’m Not a Multinational Corporation?
The real question for the (potential) retail FX trader is whether Forex trading is worth it for them. And that’s a bit like asking whether being a lawyer or a plumber is worth it.
If you can learn how to do it, and it’s something you enjoy, then Forex, like any other form of making money, is definitely worth it.
You might see warnings on reputable FX broker sites that show high percentages of people losing money. That’s usually because people get into Forex trading without doing their homework, and spending enough time on a demo account to get enough experience.
The fact you are reading this shows you are doing at least some research, so you’re on the right track.
The key is to think of Forex trading as a consistent, long-term investment activity, and not as a one-off, get-rich-quick scheme. The latter is where all the people who think Forex isn’t worth it come from.
How Much Can I Make?
In order to evaluate whether something is worth the effort, you have to have a realistic grasp of what the gain is.
How much gain you get depends on several personal factors, such as the FX strategy used, the type of trading, how often you trade, what kind of trade psychology you have, your discipline and your ability to manage risk… among others.
See? Forex isn’t something you can just jump into.
That being said, it is possible to make relatively large returns on your investment (compared to, for example, a standard safe investment such as indexed mutual funds). However, the higher the return, the less likely it is that you will be able to achieve it.
What to Expect
For reference, the median return on investment (that is, half of FX traders make more than this, half make less than this) is around 10% per month.
That means that if you have $15,000 in your account, as a median successful you’d make around $1,500 per month. Of course, that’s just a rough estimate, and how much you could make depends on your decisions. And almost all of those Forex traders took at least a couple of years to get enough experience to get to that level.
Like all things, Forex requires practice to get good at it; and can be very rewarding for those who like it.
This is what the bears don’t get about oil stocks: These are no longer the reckless, wasteful, binge years of the shale boom. The smart companies have adapted to a new reality.
Now, it’s about dramatic new offshore discoveries that are being brought online in record speed.
It’s about brilliant new well-completion designs that enhance productivity.
It’s about integrated giants who win, either way.
It’s about extremely ambitious small-caps that slip into new venues and scoop up massive basins when no one’s looking.
It’s about ingenuity on multiple levels that translates into something for every investor appetite.
Here are 6 stocks to watch in 2020, and between them they cover every sort of risk-vs-reward level out there:
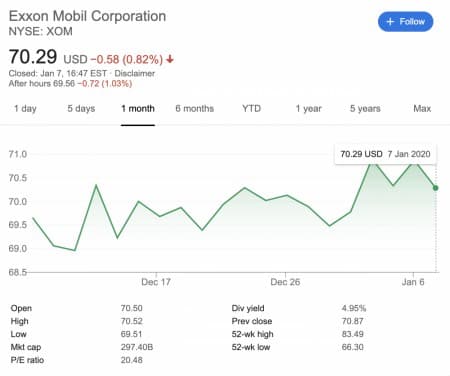
If dividends are what you’re after, look no further on the oilfield. Even the volatility of the oil and gas market over the past years have failed to disrupt Exxon’s dividend payouts.
First, the supergiant’s Q3 earnings report last week was better than expected, with earnings of 75 cents per share–compared to analyst estimates of 67 cents. Sales, at $65.05 billion, also beat estimates. And it’s planning to double its cash flow through 2025.
One of the most exciting things is the new oil that will come online from the superstar Guyana-Suriname Basin and Exxon’s 14 finds that just put Guyana on the oil map.
It’s also got new production and infrastructure coming online in the Permian basin, not to mention a major LNG project in Mozambique.
Our assessment is that Exxon is recovering nicely, and 2020 should see much better performance, particularly following the divestment of its North Sea assets for a cool $3.5 billion.
But overall, the great thing about Exxon is that no matter how oil prices fluctuate, this integrated giant is covered. Lower oil prices help its upstream assets, while higher prices boost the downstream.
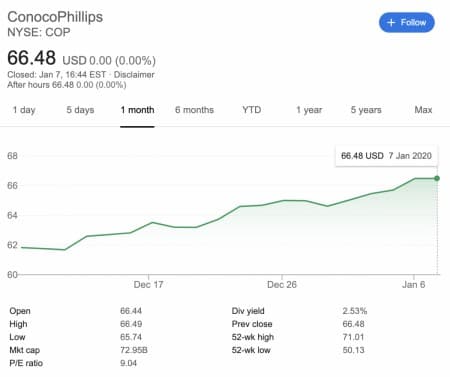
Few oil stocks shared in as much glory as COP when it comes to Q3 earnings. Not only did COP report a net income increase to $2.74 share, or $3.056 billion, but it also managed adjusted earnings of $914 million, or $0.82 per share.
Earlier in October, it also announced a 38% increase in its quarterly dividend, along with plans to repurchase $3 billion of shares next year.
COP has had lots of ups and downs this year, but this is what we like: It’s refocusing more narrowly on US shale, and on the Permian in particular. It’s spent the last year cutting costs and getting slimmer and trimmer, including a deal to sell its Australian assets for $1.4 billion. It’s likely that US shale expansion plans are in the works here, so this is a bet on that.
Recon Africa has just received an exploration license for a huge area for a tiny company with a market cap of only around $28 million and shares selling for under $0.50. Yet, it’s got 90% of the exploration rights to a shale basin of 25,000 square kilometers, that’s the same size as the Eagle Ford. It acquired the oil and gas rights for the entire 6.3-million-acre Kavango Basin in Namibia— with Africa’s oil production friendly government.
It’s pretty unique for a company this small to have a basin this big, so when it happens, we take note. We’ve also taken note of the CEO, Jay Park QC, who is the former director of Caracal Energy, which was acquired by giant Glencore in 2014 for $1.3 billion. That puts RECO squarely on our radar. So does anything that goes through Bill Cathey, well known geoscientist. We’ve heard that Cathey examined the Kavango Basin magnetic data and said it’s comprised of a 30,000-foot sedimentary basin. That’s when RECO licensed rights to the rest of the massive basin.
They have a 90% interest in a 4-year exploration license leading to a 25-year production license on commercial discovery, and the first test wells are slated to be drilled in Q2 2020–just a few months away.
The Kavango Basin is part of the Karoo Supergroup of geology, and it’s also been shown to have the same depositional environment as Shell’s Whitehill Permian shale play, part of the Karoo Supergroup in South Africa.
Sproule – a tier 1 resource assessment company – estimated that Kavango has a potential 12 billion barrels of oil or 119 trillion cubic feet of natural gas. That’s just for the shale. It doesn’t include any conventional potential.
Namibia is one of the up-and-coming oil venues in the frontier of Africa. Ask Shell or Exxon, both of whom are acquiring a lot of assets here, making Recon a natural acquisition target if a commercial discovery is made.
Not only is HESS sharing in the future wealth of the outsized oil discoveries with Exxon in Guyana at the Stabroek Block, but it will also be getting a boost from the block’s ahead-of-schedule first production in December.
Right now, HESS is doing well enough as it is on its position in US shale, in the Bakken, and when it adds its Guyana production to its portfolio by the end of this year, that will outshine the Bakken. So, what’s good becomes even better.
This stock is looking great going into 2020, and it exceeded its Q3 output guidance based on the Bakken alone. In fact, Hess’ Bakken production got a 38% boost year-on-year–way past expectations–and thanks in part to a new well-completion design to enhance productivity. That’s really what we like to see.
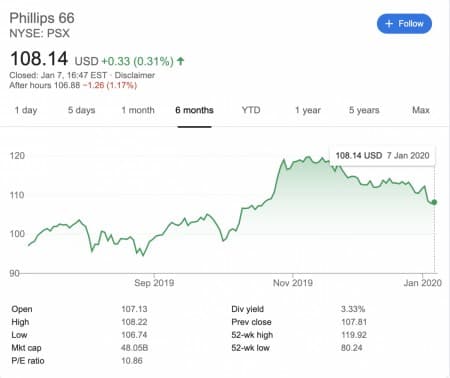
PSX soared more than 15% in October. It’s loving the low oil prices for its refineries, and now it’s busy building up pipelines, too, to carry all that Permian largesse to the refiners.
It’s targeted over $4 billion in pipelines. The next big pipeline in the … pipeline is one that leads from the Permian Basin to the Gulf Coast–meeting a major demand and allowing Phillips 66 to rake in more cash on more cheap North American oil.
This company is a bet on low oil prices–bottom line.
Fairly confident in the knowledge that nothing short of WWIII will result in a surge in oil prices at this point, this is Phillips 66’s playground through the rest of this year and presumably into 2020.
That’s refining + roaring midstream businesses that are doing much more than thriving in this atmosphere.
Halliburton is one of the largest oilfield services companies in the world. The company has secured its place as a giant in the oil and gas industry. But it didn’t happen overnight.
Over the past month, Halliburton has jumped by 12% on a string of positive news.
The oilfield services sector is highly competitive and ripe with innovation. In order to stay ahead, companies must be on the absolute cutting edge of technology. And that’s exactly what Halliburton has done.
And recently, Halliburton increased the heat for its competition. Partnering with Microsoft, Halliburton has become one of the most exciting “tech” plays in the industry.
This partnership is significant. Microsoft, a leader in the tech world, is looking to bring machine learning, augmented reality, and the Industrial Internet of Things to the oil and gas industry, and Halliburton is welcoming the new take on the resource realm with open arms.
In addition to its forward looking approach with regards to technology, Halliburton is also wheeling and dealing in the traditional oil world.
In its efforts to expand outside of the U.S. shale boom, the oilfield services behemoth has secured major deals in the Middle East, including a $597 million contract with Kuwait Oil Company to help develop its offshore program.
**IMPORTANT! BY READING OUR CONTENT YOU EXPLICITLY AGREE TO THE FOLLOWING. PLEASE READ CAREFULLY**
Forward-Looking Statements. Statements contained in this document that are not historical facts are forward-looking statements that involve various risks and uncertainty affecting the business of Recon. All estimates and statements with respect to Recon’s operations, its plans and projections, oil prices, recoverable oil, production targets, production and other operating costs and likelihood of oil recoverability are forward-looking statements under applicable securities laws and necessarily involve risks and uncertainties including, without limitation: risks associated with oil and gas exploration, development, exploitation and production, geological risks, marketing and transportation, availability of adequate funding, volatility of commodity prices, imprecision of reserve and resource estimates, environmental risks, competition from other producers, government regulation, dates of commencement of production and changes in the regulatory and taxation environment. Actual results may vary materially from the information provided in this document, and there is no representation that the actual results realized in the future will be the same in whole or in part as those presented herein. Other factors that could cause actual results to differ from those contained in the forward-looking statements are also set forth in filings that Recon and its technical analysts have made, We undertake no obligation, except as otherwise required by law, to update these forward-looking statements except as required by law.
Exploration for hydrocarbons is a speculative venture necessarily involving substantial risk. Recon’s future success will depend on its ability to develop its current properties and on its ability to discover resources that are capable of commercial production. However, there is no assurance that Recon’s future exploration and development efforts will result in the discovery or development of commercial accumulations of oil and natural gas. In addition, even if hydrocarbons are discovered, the costs of extracting and delivering the hydrocarbons to market and variations in the market price may render uneconomic any discovered deposit. Geological conditions are variable and unpredictable. Even if production is commenced from a well, the quantity of hydrocarbons produced inevitably will decline over time, and production may be adversely affected or may have to be terminated altogether if Recon encounters unforeseen geological conditions. Adverse climatic conditions at such properties may also hinder Recon’s ability to carry on exploration or production activities continuously throughout any given year.
DISCLAIMERS
ADVERTISEMENT. This communication is not a recommendation to buy or sell securities. Oilprice.com, Advanced Media Solutions Ltd, and their owners, managers, employees, and assigns (collectively “the Company”) may in the future be paid by Recon to disseminate future communications if this communication proves effective. In this case the Company has not been paid for this article. But the potential for future compensation is a major conflict with our ability to be unbiased, more specifically:
This communication is for entertainment purposes only. Never invest purely based on our communication. We have not been compensated but may in the future be compensated to conduct investor awareness advertising and marketing for TSXV:RECO. Therefore, this communication should be viewed as a commercial advertisement only. We have not investigated the background of the company. Frequently companies profiled in our alerts experience a large increase in volume and share price during the course of investor awareness marketing, which often end as soon as the investor awareness marketing ceases. The information in our communications and on our website has not been independently verified and is not guaranteed to be correct.
SHARE OWNERSHIP. The owner of Oilprice.com owns shares of this featured company and therefore has an additional incentive to see the featured company’s stock perform well. The owner of Oilprice.com will not notify the market when it decides to buy more or sell shares of this issuer in the market. The owner of Oilprice.com will be buying and selling shares of this issuer for its own profit. This is why we stress that you conduct extensive due diligence as well as seek the advice of your financial advisor or a registered broker-dealer before investing in any securities.
NOT AN INVESTMENT ADVISOR. The Company is not registered or licensed by any governing body in any jurisdiction to give investing advice or provide investment recommendation. ALWAYS DO YOUR OWN RESEARCH and consult with a licensed investment professional before making an investment. This communication should not be used as a basis for making any investment.
PAST PERFORMANCE IS NOT INDICATIVE OF FUTURE RESULTS. Investing is inherently risky. Don’t trade with money you can’t afford to lose. This is neither a solicitation nor an offer to Buy/Sell securities. No representation is being made that any account will or is likely to achieve profits similar to those discussed.
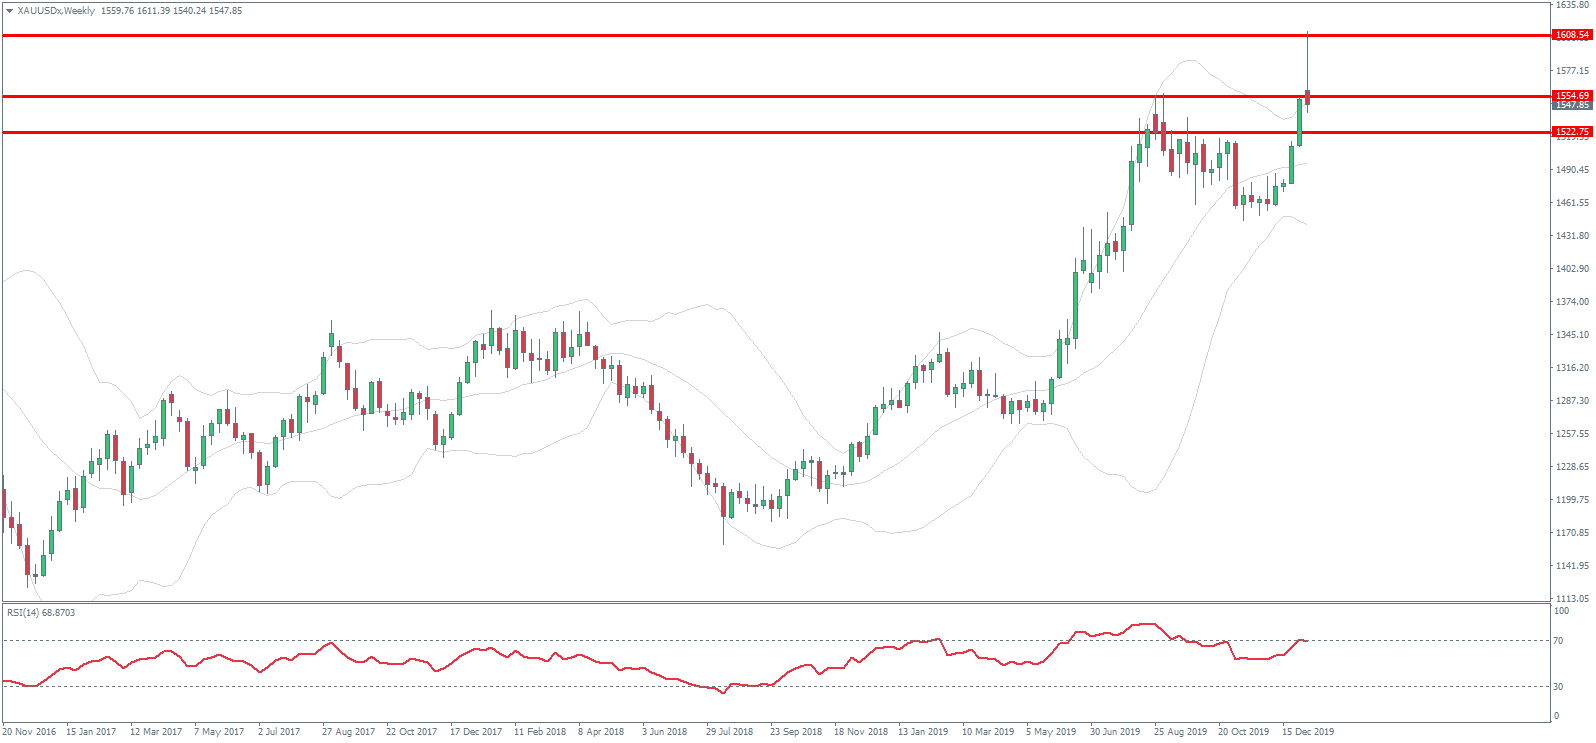
It’s been a volatile week for gold. After breaking out to its highest levels since April 2013, the yellow metal has since reversed sharply. As of writing, it is ending the week back below the 2019 high.
The initial upside in gold was driven by a wave of risk-off trading in reaction to news of escalating tensions between the US and Iran. Following the state funeral of Iranian general Soleimani, who was killed by a US airstrike last week, Iran retaliated for the attack by launching ballistic missiles at two US army bases in Iraq.
As news of the rocket attack broke, equities collapsed. Traders feared the move might push the US and Iran into war. However, Trump downplayed the significance of the attack.
He addressed the nation saying that according to intelligence, Iran was stepping down and as such, the US would not be entering a military conflict with it.
As quickly as gold had rallied, the reversal saw prices cascading lower. Equities traders cheered the news and drove index prices higher. However, given the hostile nature of relations between the two countries, further attacks cannot be ruled out. Therefore, upside risks remain for gold.
Technical Perspective
The rally in gold this week saw price trading up to test the 1608.54 resistance level which saw strong selling. Price has since declined back below the 1554.69 2019 high, putting focus on a move back down to test next support at the 1522.75 level. Bulls will need to see price stay above this level to keep focus on further upside. However, the weekly candle here suggests the risk of a deeper correction lower in the coming sessions.
Silver
Silver prices tracked the moves in gold this week, trading higher initially as safe-haven demand for gold drove buying. However, the subsequent reversal in gold has taken silver prices lower on the week.
As with gold, however, the residual risk of further conflict between the US and Iran poses upside risks for silver in the near term. Should the situation remain, focus will then shift back onto the progress of US/China trade talks. The two sides are due to sign off on the phase one trade deal
Technical Perspective
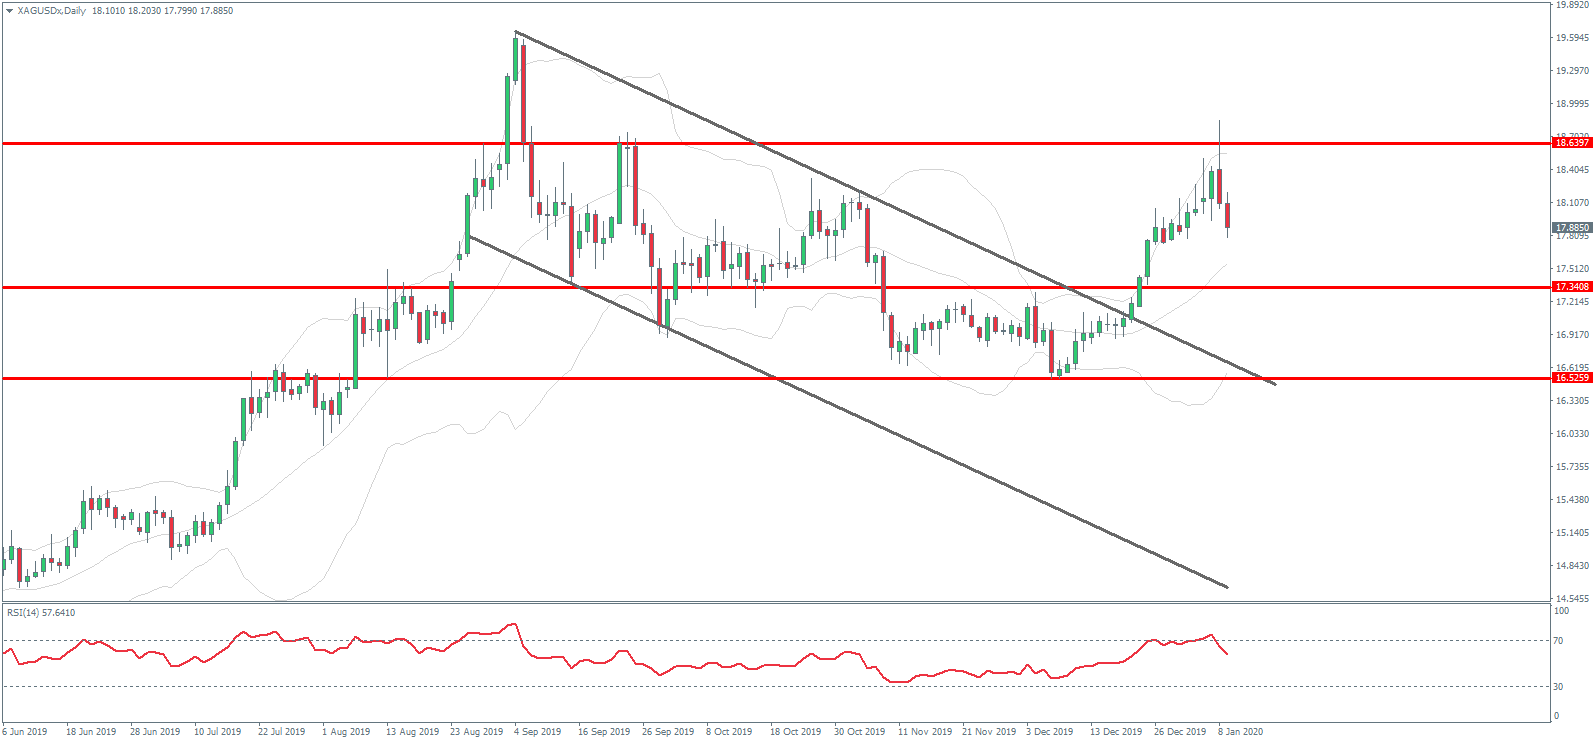
Silver prices traded up to test the 18.6397 level resistance this week though, as with gold, strong selling kicked in at the level, taking price lower. For now, price is still above the 17.3408 level, keeping focus on further upside in the near term. Should we move back below this level, however, focus will be on a test of the 16.52 level next.
The US dollar has ended the week firmly higher as a string of better data has lifted sentiment. The ISM non-manufacturing reading came in well above expectations, followed by a stronger than expected ADP print which has fuelled expectations of a strong NFP release later today. The USD index trades 97.26 last.
Euro Lower
EURUSD has been lower over the week, weighed on by the recovery in the US dollar. Earlier in the week, the CPI flash reading came in at 1.3% as expected, marking a 0.3% improvement on the prior month.
However, amidst the recent slew of weak data, it failed to provide any support for EURUSD which trades down at 1.1095 as of writing.
GBP Lower on Carney Comments
GBPUSD has been a little weaker over the week despite news that UK parliament has now officially approved the PM’s Withdrawal Agreement Bill, meaning the UK will leave the EU on January 31st.
However, comments from BOE Governor Carney have weighed on GBP. Carney said that an interest rate cut could still be needed as the projected rebound following Brexit was not a certainty and growth is still below potential. GBPUSD trades 1.2970 last.
SPX500 Hits New Highs
Risk assets have ended the week firmly higher as the calming of tensions between the US and Iran as met with a relief rally across the markets. The SPX500 has broken out to new all-time highs as of today, trading 3282.43.
With the US and China due to sign off on the phase one trade deal next week, equities are likely to remain supported.
JPY & Gold Lower
Safe havens have been lower today in light of the rally in equities and in the USD which has seen both JPY and gold trading lower. USDJPY trades 109.63 last, trading back up to test recent highs which now look vulnerable to breaking.
XAUUSD trades 1548.63 last, back below the 1522.75 level.
Crude Heavily Lower
Oil prices have been sharply lower into the end of the week. Following the initial upside in response to US/Iran tensions, the calming of that situation has seen price reversing lower. The EIA then added further pressure to the move, reporting an inventory surplus for the first time in four weeks. Crude trades 59.31 last.
Loonie Recovering
USDCAD has been higher today, with price trading back above the 1.3068 level in response to the weakness in crude which has weighed on CAD. Along with US labour market data due later today, the market also receives the Canadian employment reports which could cause further volatility.
Aussie Ends The Week lower
AUDUSD has bee a little higher today, boosted by the general improvement in risk appetite. AUD ends the week heavily lower, however, as the market now anticipates that the RBA will be forced to cut rates in February in response to the economic damage caused by the wildfires there. AUDUSD trades .6874 last.
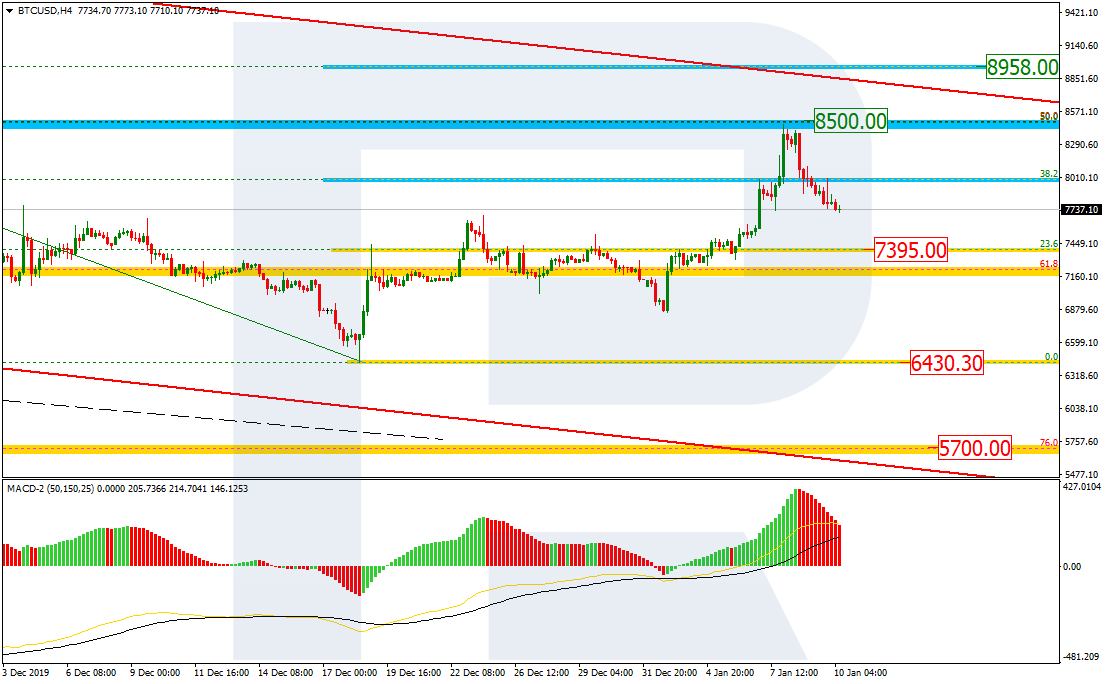
As we can see in the daily chart, BTCUSD has finished the correctional uptrend at the long-term resistance, which is 50.0% fibo at 8500.00. However, we shouldn’t exclude further growth towards 61.8% at 8958.00, but only after a short-term decline, because “Golden Cross” on MACD has been formed very recently. Still, the main scenario implies that the instrument is expected to start a new descending wave to reach the low at 6430.30 and then mid-term 76.0% fibo at 5700.00.
In the H4 chart, the pair is correcting towards the local support, which is 23.6% fibo at 7395.00. If the price rebounds, it may start a new impulse to reach 61.8% fibo at 8958.00. Later, BTCUSD may break this level and fix below it. In this case, the instrument may continue falling to attack the low.
ETHUSD, “Ethereum vs. US Dollar”
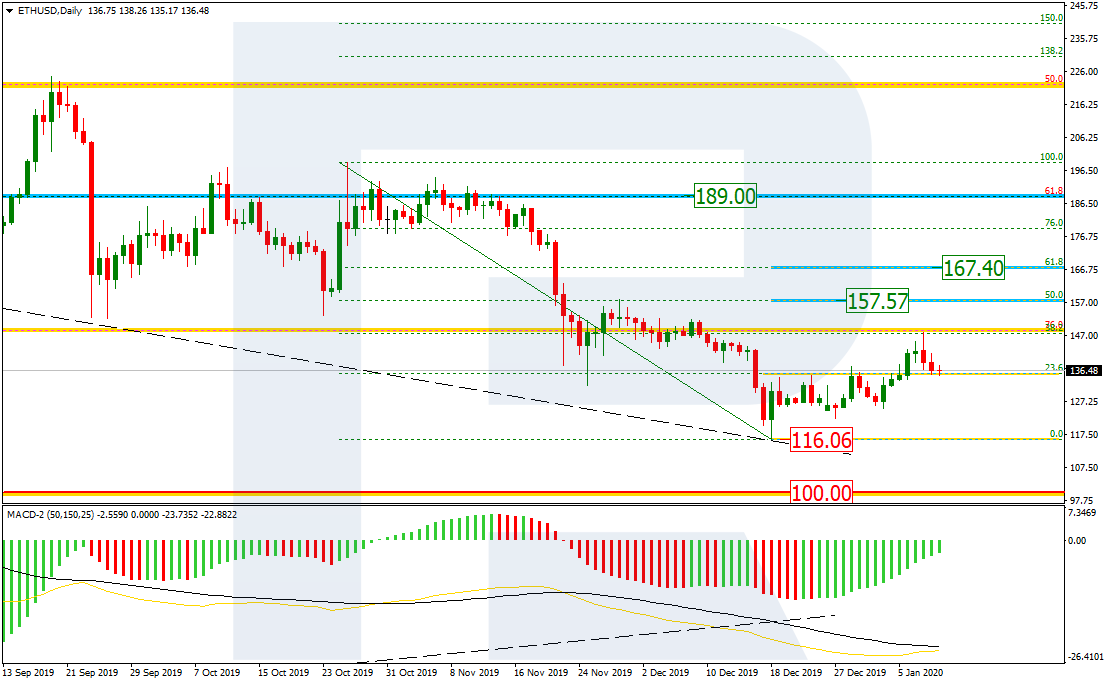
As we can see in the daily chart, the correctional uptrend has stopped at 38.2% fibo. According to the main scenario, the price is expected to fall and reach the low at 116.06, but the next rising wave may head towards 50.0% and 61.8% fibo at 157.57 and 167.40 respectively.
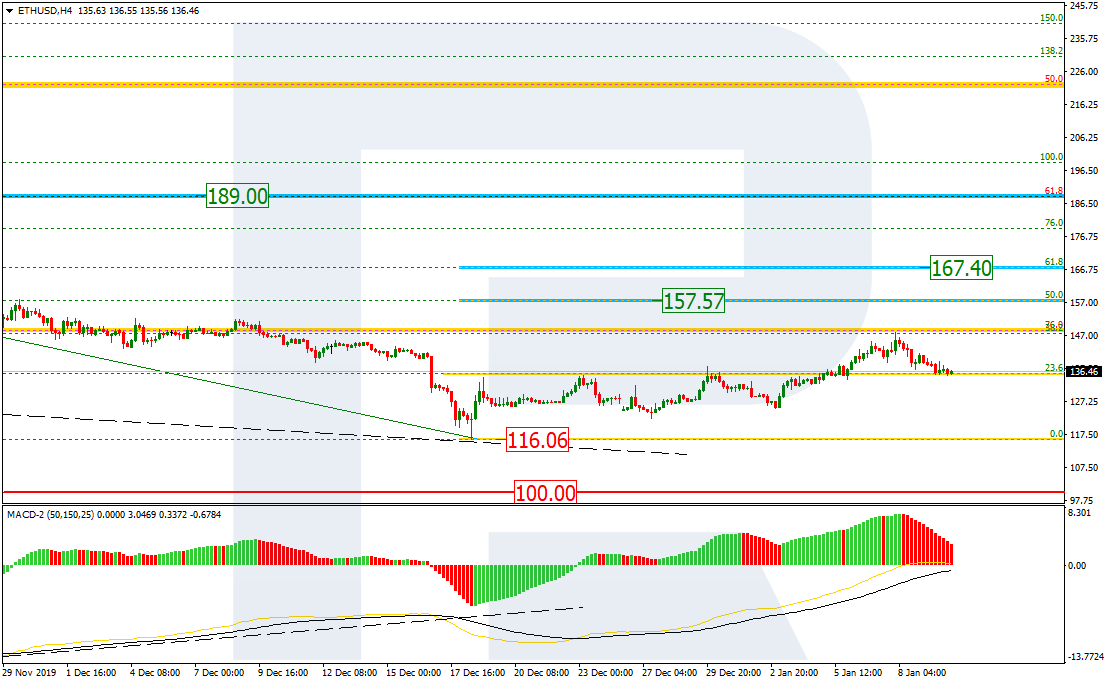
The H4 chart shows that after reaching 38.2% fibo, the price has started a new decline. MACD indicates further growth after a short-term decline.
Attention! Forecasts presented in this section only reflect the author’s private opinion and should not be considered as guidance for trading. RoboForex LP bears no responsibility for trading results based on trading recommendations described in these analytical reviews.
The US-China trade deal was once again back in focus, pushing equities to resume the rally. The gains come after China said that its vice premier will be traveling to the US to sign the phase one of the trade deal.
The announcement indicates that the final issues have been resolved, paving the way for what could be a historic deal after almost a year of uncertainty.
Germany’s Industrial Production Rises in November
The latest industrial production figures from Germany saw a better increase. Industrial production grew 1.1% on the month in November 2019. This reverses the 1.0% decline from the month before. Economists forecast a growth rate of just 0.9%. Excluding energy and construction, industrial production was up 1.0% for the period.
EURUSD Finds Support, but Downside Could Prevail
The currency pair, after slipping past the rising trend line is consolidating near the horizontal support level of 1.1100. The bias is to the downside if there is a breakdown further. A decline below 1.1100 will signal a move to the next downside target of 1.1072. We suspect that in the medium term, the EURUSD will remain range-bound within these levels.
GBP drops as EU Doubts UK Trade Deal
The pound sterling came under pressure after EU officials ruled out the possibility of a full EU–UK trade deal by the end of 2020. The comments were made by Ursula von der Leyen. The comments come in contrast to the views from the British PM. Johnson is hopeful that the UK will be able to have a trade deal in place by the end of this year.
GBPUSD Retracing Losses For Now
Cable is retracing the losses from earlier in the day. This comes as price has broken past the support level of 1.3100. If this retracement ends near 1.3100 then we expect declines to resume. The descending triangle pattern remains in play giving the downside target to a minimum of 1.2960.
Gold Weaker as Fed Speeches Get Underway
Gold prices continued to fall on the broader market sentiment. Fed vice-chair Richard Clarida gave a speech on Thursday. He reiterated the general consensus that interest rates are appropriate for the economy for the time being. He reaffirmed that the Fed was ready to adjust policy if needed. Clarida was also optimistic about the economy, noting that consumers will drive economic expansion into the eleventh year.
XAUUSD Breaks the Major Trend Line
The precious metal has slipped past the second trend line as well indicating further weakness. Continued declines will see gold dipping to the 1534 handle in the near term. But considering the payrolls report today, we could expect a rebound. For the upside to regain momentum, XAUUSD will need to break past the 1594 highs.
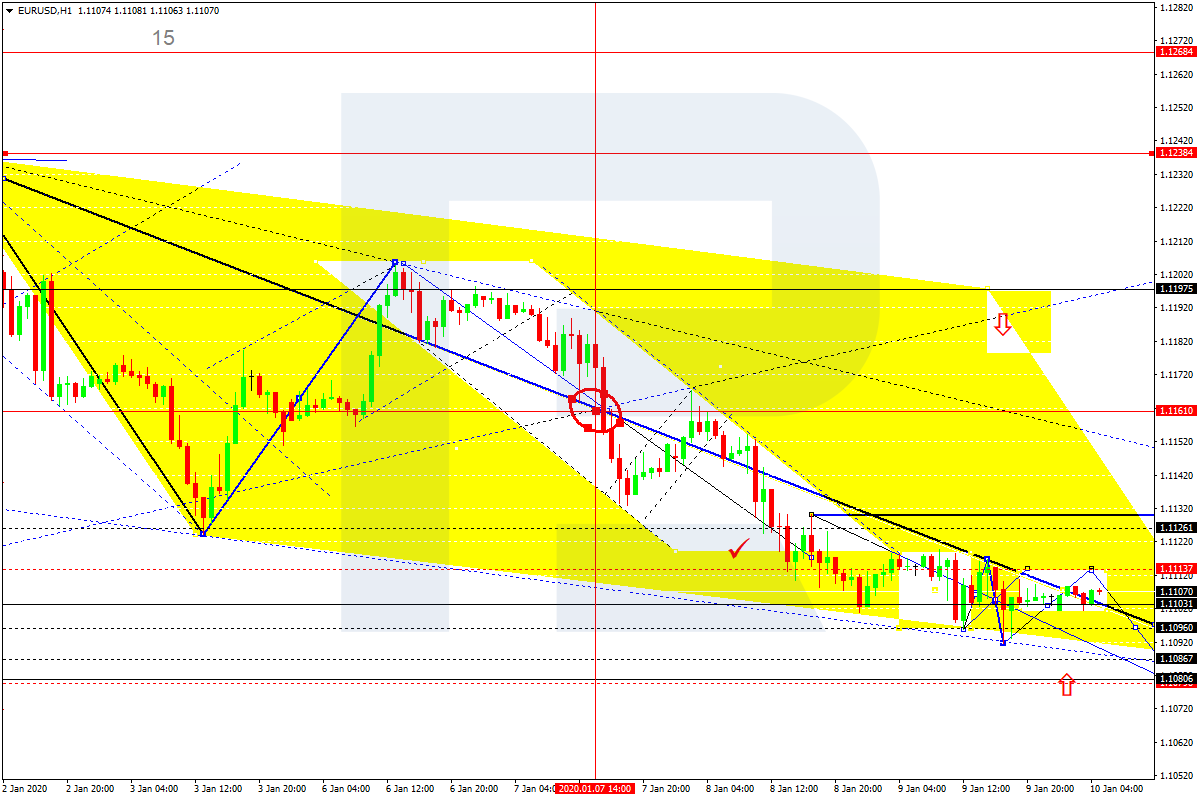
EURUSD is still moving downwards; it has formed another consolidation range around 1.1107. Today, the pair may form a new descending structure towards 1.1090 to complete the correctional wave. If the price breaks 1.1111, the instrument may resume moving upwards with the first target at 1.1200.
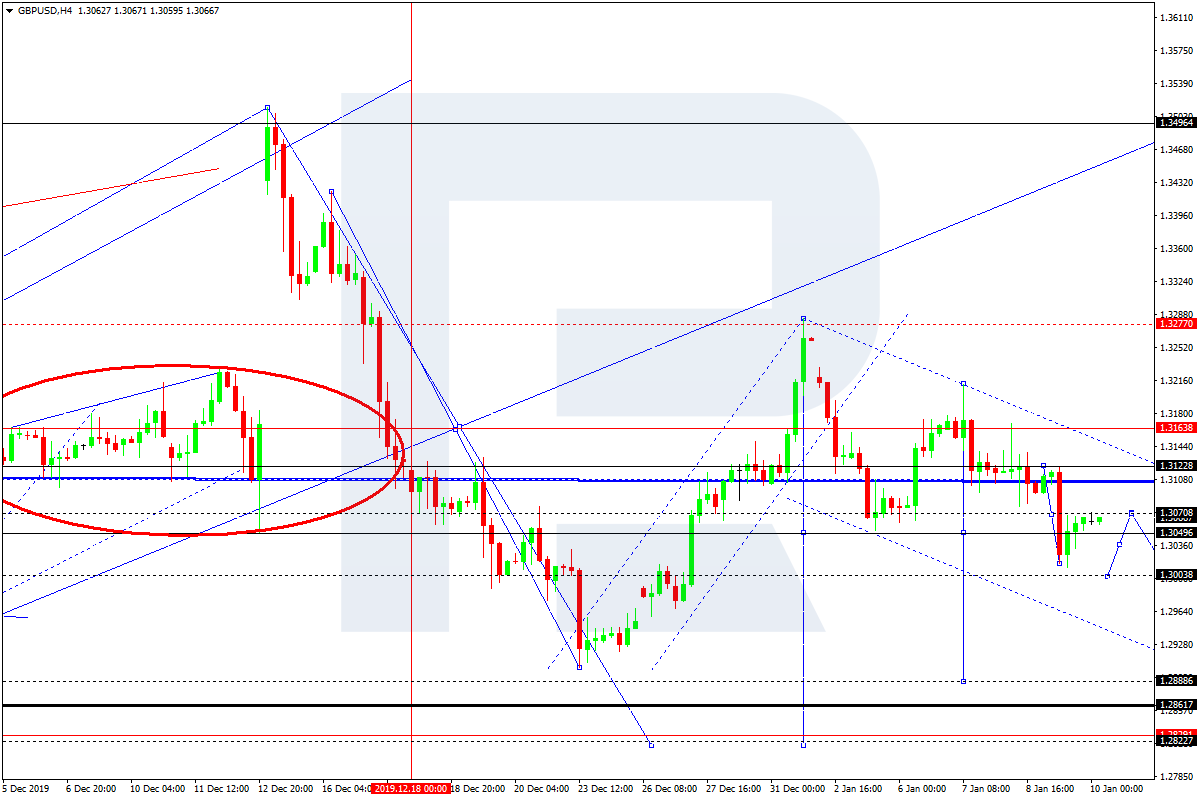
GBPUSD, “Great Britain Pound vs US Dollar”
GBPUSD has reached the target of the descending structure at 1.3050, which may be considered as the first half of the third wave. Possibly, today the pair may consolidate around this level and then expand the range down to 1.3000. Later, the market may resume falling with the short-term target at 1.2888.
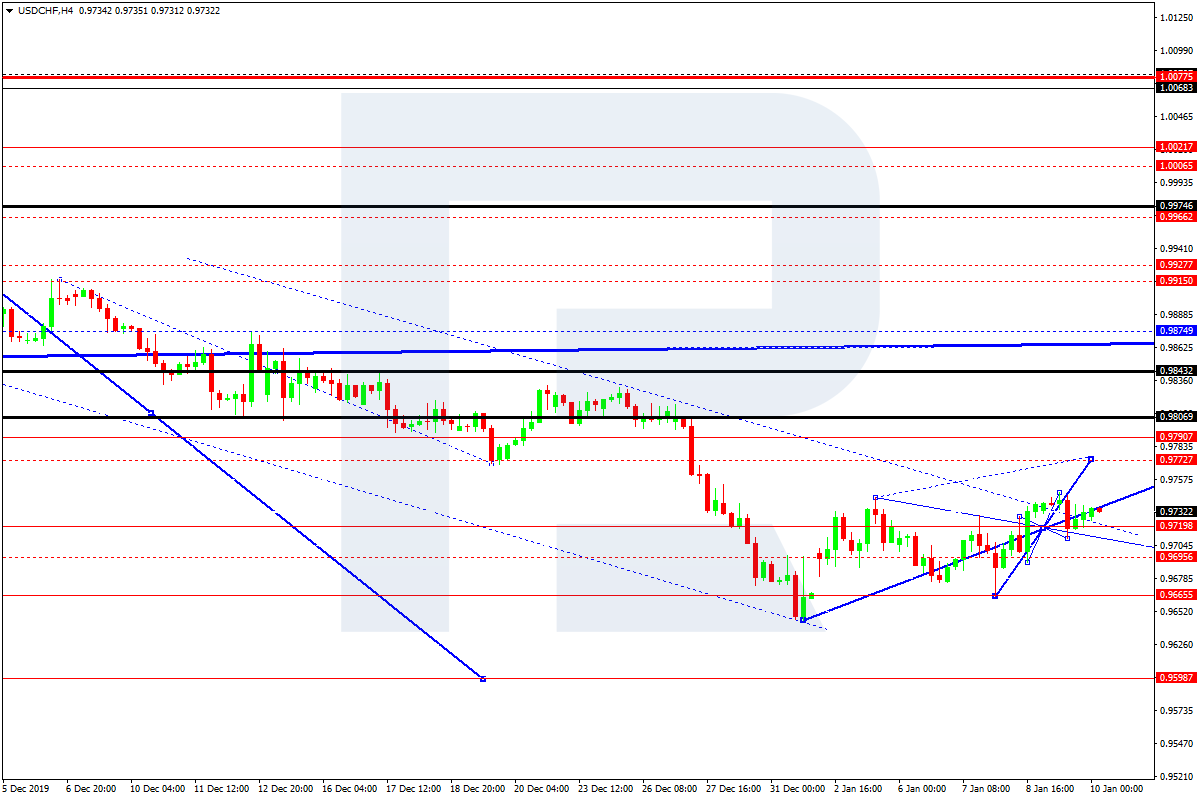
USDCHF, “US Dollar vs Swiss Franc”
USDCHF has formed another consolidation range around 0.9718. Possibly, today the pair may grow towards 0.9770. After that, the instrument may start a new decline to reach 0.9717 and then form one more ascending structure with the target at 0.9790.
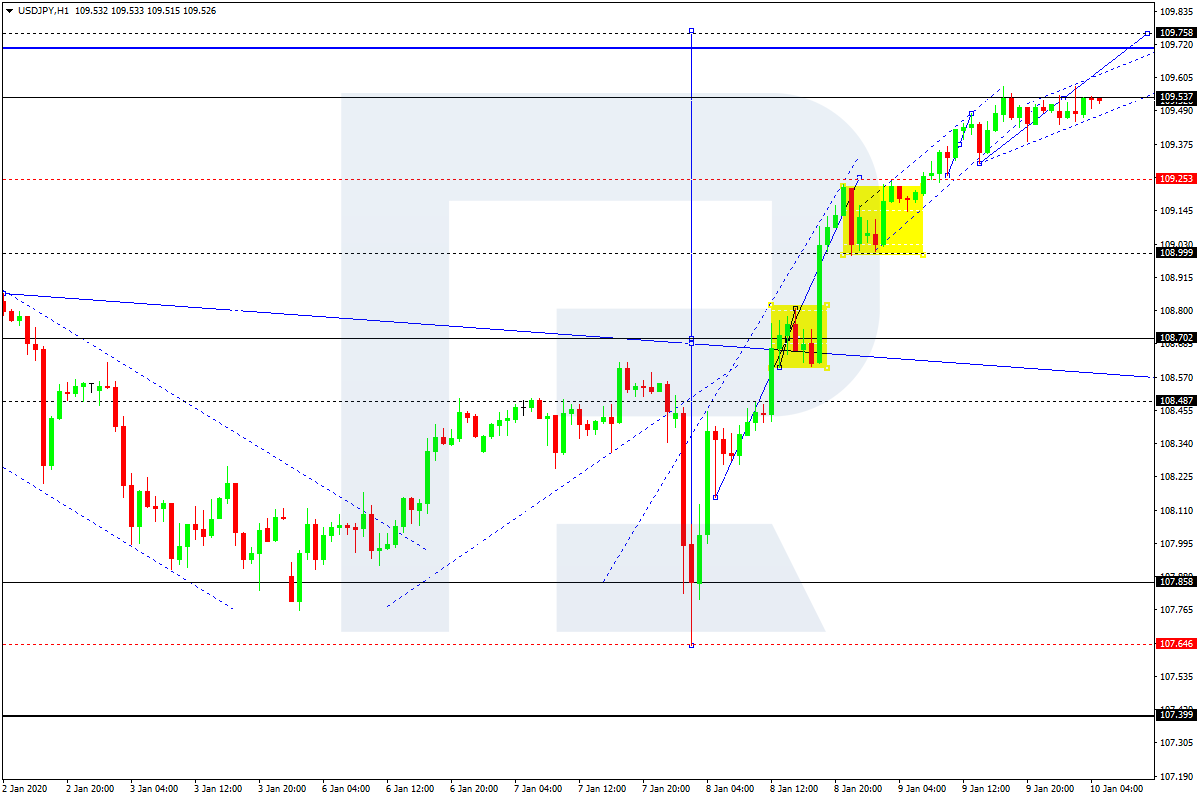
USDJPY, “US Dollar vs Japanese Yen”
USDJPY is growing with the target at 109.75. Today, the pair may reach 109.70. Later, the market may form a new descending structure towards 109.50 and then resume moving upwards to reach the above-mentioned target and complete this ascending wave. After that, the instrument may start another decline with the first target at 107.85.
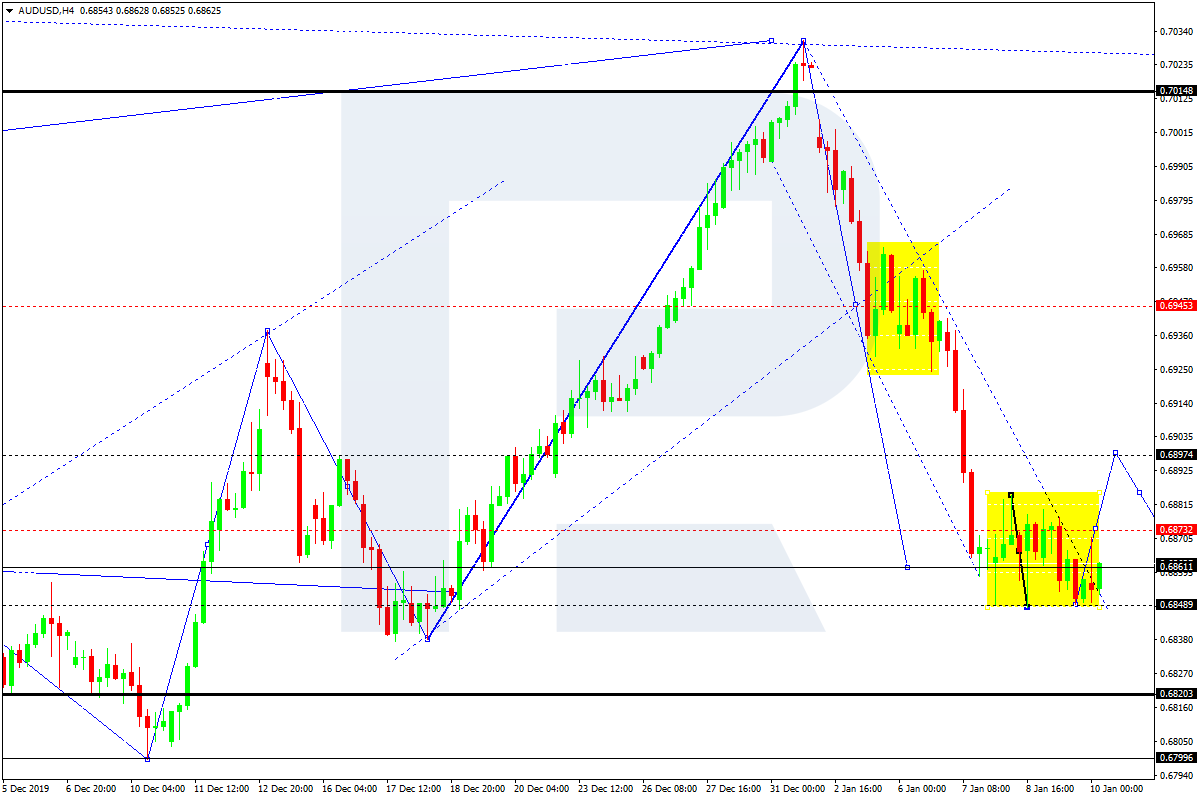
AUDUSD, “Australian Dollar vs US Dollar”
AUDUSD is still consolidating above 0.6850 without any particular direction. Possibly, the pair may form one more ascending structure towards 0.6898 and then resume moving downwards to reach 0.6872. continue growing with the target at 0.6945. After that, the instrument may start another growth to break 0.6898 and then continue trading inside the uptrend with the first target at 0.6945.
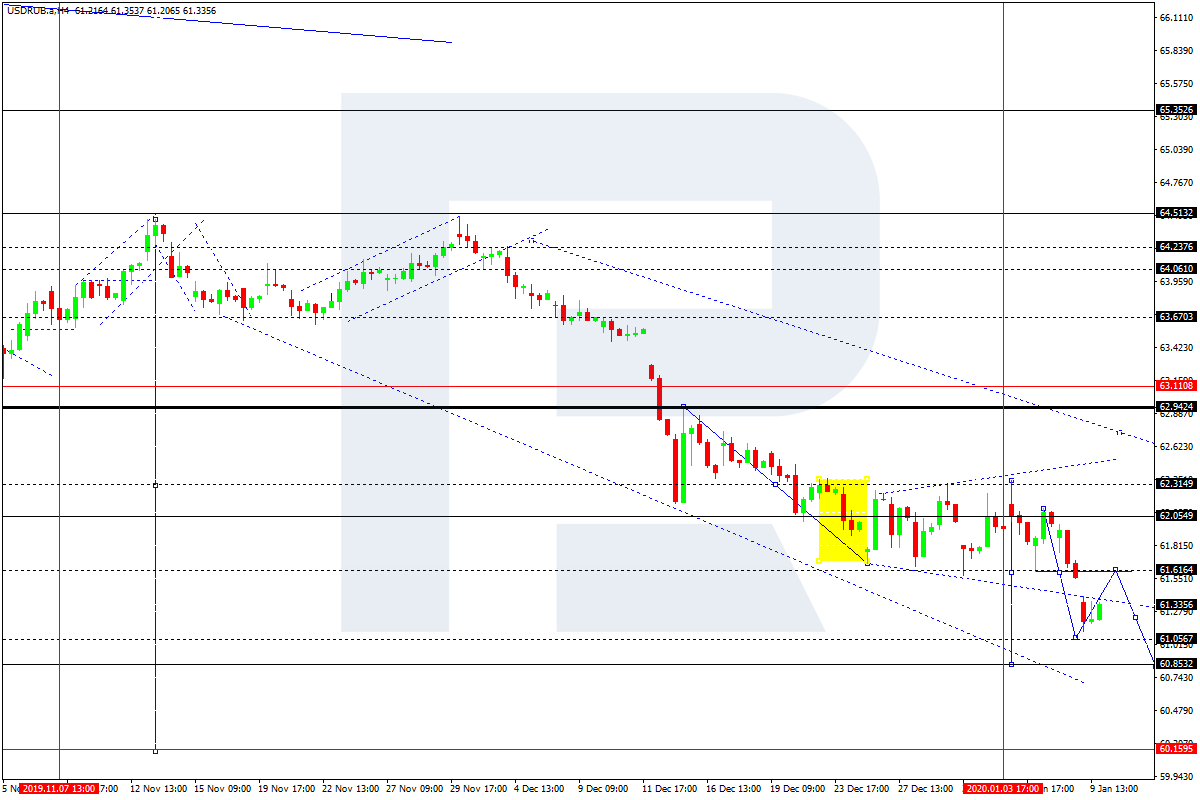
USDRUB, “US Dollar vs Russian Ruble”
USDRUB is falling towards 61.00; it has already reached the short-term target at 61.12. The main scenario implies that the price may test 61.50 from below and then resume trading inside the downtrend to reach 61.00.
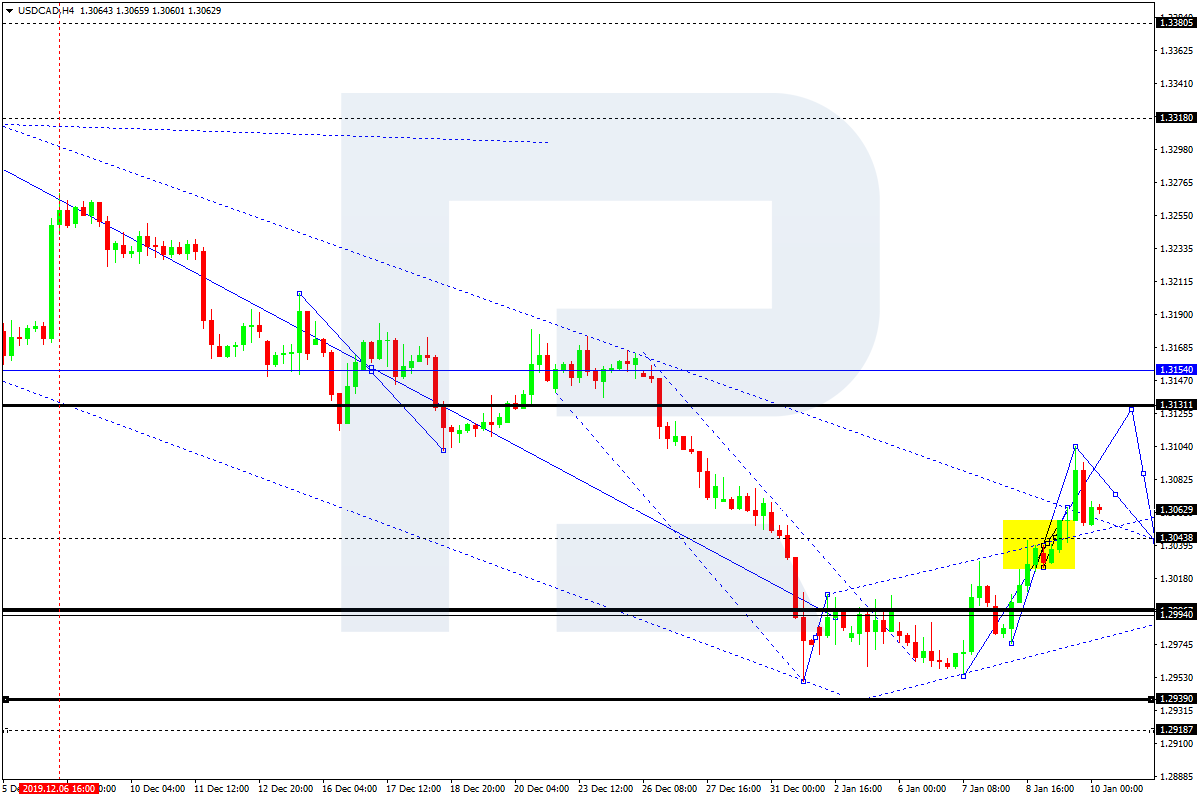
USDCAD, “US Dollar vs Canadian Dollar”
USDCAD continues growing towards 1.3131. Later, the market may start another decline to reach 1.3040 and then form one more ascending structure with the target at 1.3150.
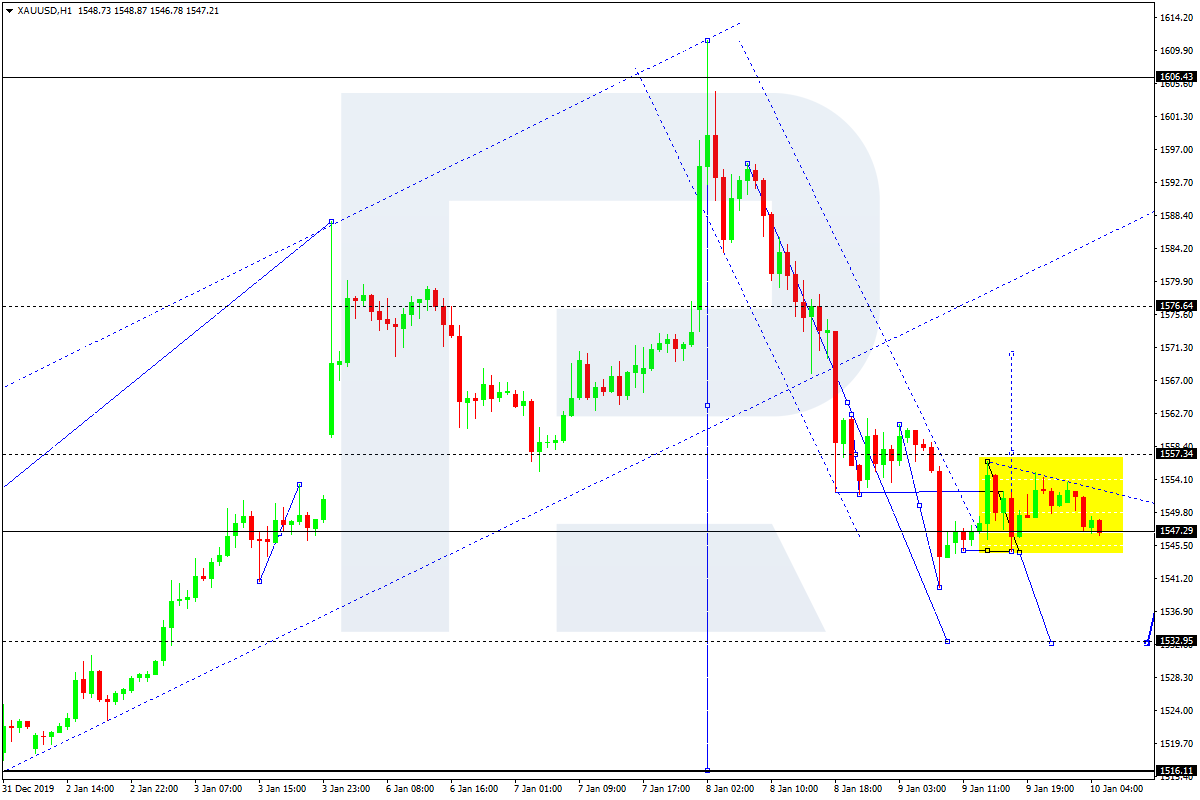
XAUUSD, “Gold vs US Dollar”
Gold continues moving downwards. After expanding the consolidation range down to 1540.00 and forming the ascending impulse towards 1556.40 along with the correction at 1547.30, Gold has defined the borders of a new consolidation range. If later the price breaks this range to the upside at 1558.00, the market may resume moving upwards to reach 1568.20; if to the downside at 1540.00 – start a new decline with the target at 1516.00.
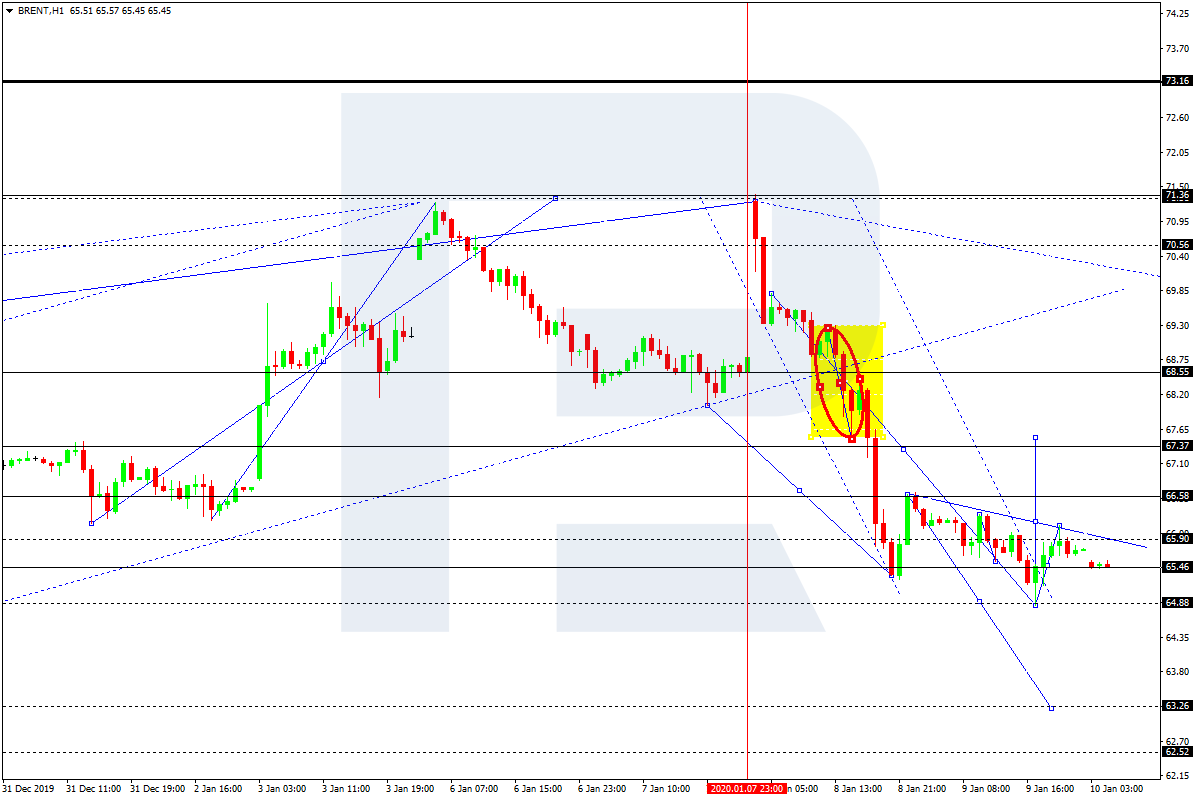
BRENT
Brent is consolidating around 65.95 and may resume growing. If later the price breaks this range to the upside at 66.60, the market may resume moving upwards with the first target at 68.55; if to the downside at 64.90 – extend the correction and form a new descending structure to reach 63.30.
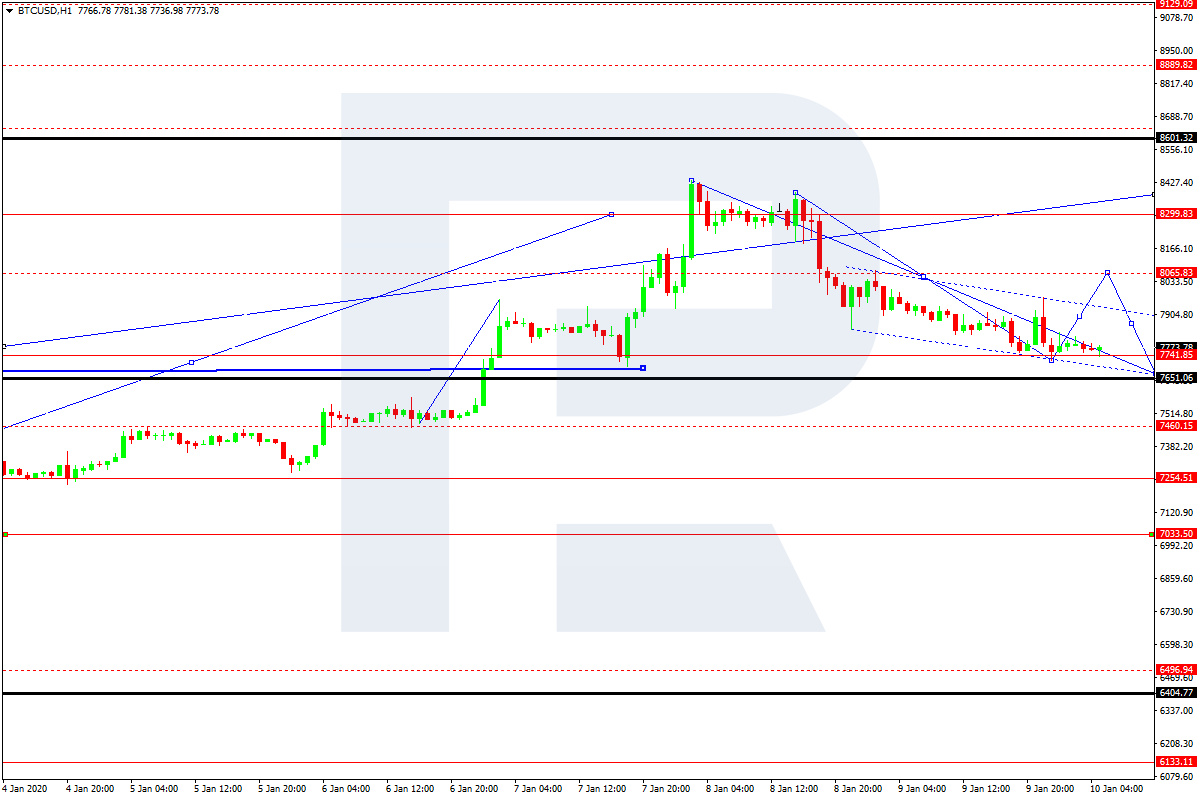
BTCUSD, “Bitcoin vs US Dollar”
BTCUSD has reached its short-term downside target at 7750.00. Possibly, today the pair may start a new growth to reach 8050.00 and then resume falling towards 7700.00 to finish the correction. Later, the market may form one more ascending structure with the target at 8600.00.
Attention! Forecasts presented in this section only reflect the author’s private opinion and should not be considered as guidance for trading. RoboForex LP bears no responsibility for trading results based on trading recommendations described in these analytical reviews.