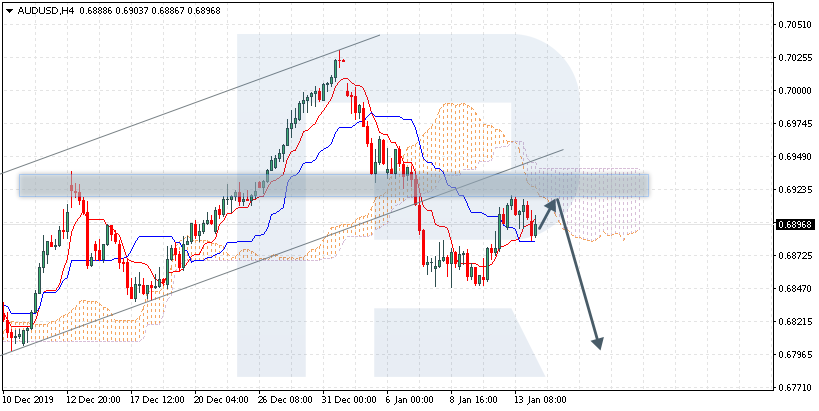
AUDUSD is trading at 0.6896; the instrument is moving below Ichimoku Cloud, thus indicating a descending tendency. The markets could indicate that the price may test the cloud’s downside border at 0.6915 and then resume moving downwards to reach 0.6795. Another signal to confirm further descending movement is the price’s rebounding from the resistance level. However, the scenario that implies further decline may be canceled if the price breaks the cloud’s upside border and fixes above 0.6955. In this case, the pair may continue growing towards 0.7035. After breaking the support area and fixing below 0.6825, the price may continue moving downwards and complete Head & Shoulders reversal pattern.
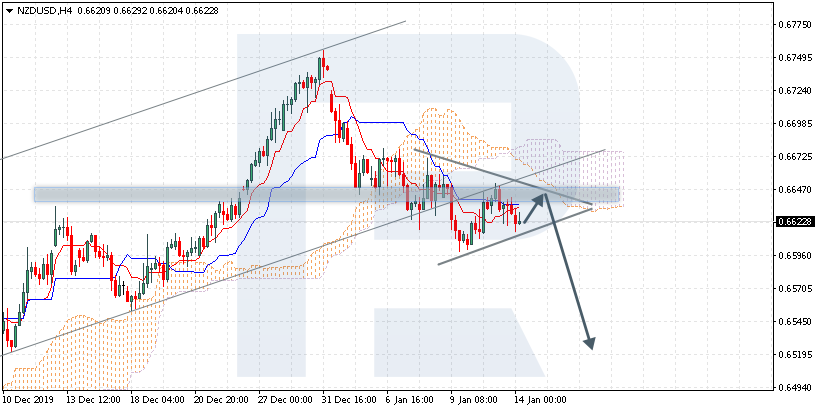
NZDUSD, “New Zealand Dollar vs US Dollar”
NZDUSD is trading at 0.6622; the instrument is moving below Ichimoku Cloud, thus indicating a descending tendency. The markets could indicate that the price may test the cloud’s downside border at 0.6635 and then resume moving downwards to reach 0.6520. Another signal to confirm further descending movement is the price’s rebounding from the resistance level. However, the scenario that implies further decline may be canceled if the price breaks the cloud’s upside border and fixes above 0.6705. In this case, the pair may continue growing towards 0.6785. After breaking Triangle’s downside border and fixing below 0.6590, the price may continue moving downwards.
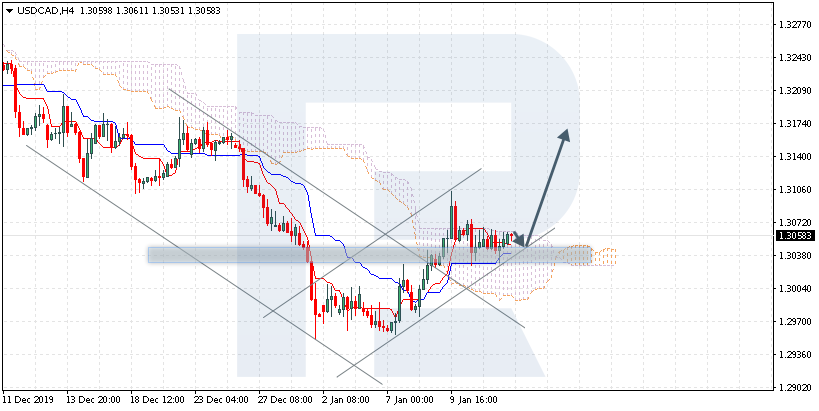
USDCAD, “US Dollar vs Canadian Dollar”
USDCAD is trading at 1.3058; the instrument is moving inside Ichimoku Cloud, thus indicating a sideways tendency. The markets could indicate that the price may test Tenkan-Sen and Kijun-Sen at 1.3040 and then resume moving upwards to reach 1.3175. Another signal to confirm further ascending movement is the price’s rebounding from the rising channel’s downside border. However, the scenario that implies further growth may be canceled if the price breaks the cloud’s downside border and fixes below 1.2965. In this case, the pair may continue falling towards 1.2895. After breaking the cloud’s upside border and fixing above 1.3075, the price may continue moving upwards.
Attention! Forecasts presented in this section only reflect the author’s private opinion and should not be considered as guidance for trading. RoboForex LP bears no responsibility for trading results based on trading recommendations described in these analytical reviews.
The EUR/USD currency pair has been growing after a rather continuous fall since the end of December. Currently, quotes are consolidating. The local support and resistance levels are 1.11200 and 1.11450, respectively. The current technical pattern signals a further correction of the trading instrument. Financial market participants expect the signing of an interim trade agreement between Washington and Beijing. We recommend opening positions from key levels.
The Economic News Feed for 14.01.2020:
At 15:30 (GMT+2:00), investors will assess the US inflation report.
The price has fixed above 100 MA, which signals the power of buyers.
The MACD histogram is in the positive zone and continues to rise, indicating the bullish sentiment.
Stochastic Oscillator is in the neutral zone, the %K line is above the %D line, which also gives a signal to buy EUR/USD.
Trading recommendations
Support levels: 1.11200, 1.10900
Resistance levels: 1.11450, 1.11650, 1.12000
If the price fixes above 1.11450, further growth of EUR/USD quotes is expected. The movement is tending to 1.11700-1.12000.
An alternative could be a decrease in the EUR/USD currency pair to 1.11000-1.10800.
The GBP/USD currency pair
Technical indicators of the currency pair:
Prev Open: 1.30345
Open: 1.29872
% chg. over the last day: -0.44
Day’s range: 1.29694 – 1.30023
52 wk range: 1.1959 – 1.3516
The GBP/USD currency pair continues to show negative dynamics. The trading instrument has overcome and fixed below the level of $1.30. The British pound is still under pressure after the release of weak statistics on GDP and manufacturing production in the UK. Currently, GBP/USD quotes are consolidating in the range of 1.29600-1.30150. The pound has a potential for further decline. Today we recommend paying attention to the news feed from the US. Positions should be opened from key levels.
The publication of important economic releases from the UK is not planned.
Indicators signal the power of sellers: the price has fixed below 50 MA and 100 MA.
The MACD histogram is in the negative zone and continues to decline, which gives a strong signal to sell GBP/USD.
Stochastic Oscillator is in the neutral zone, the %K line is below the %D line, which also indicates the bearish sentiment.
Trading recommendations
Support levels: 1.29600, 1.29200
Resistance levels: 1.30150, 1.30550, 1.31000
If the price fixes below 1.29600, a further drop in GBP/USD quotes is expected. The movement is tending to 1.29300-1.29000.
An alternative could be the growth of the GBP/USD currency pair to 1.30500-1.30700.
The USD/CAD currency pair
Technical indicators of the currency pair:
Prev Open: 1.30500
Open: 1.30543
% chg. over the last day: +0.02
Day’s range: 1.30498 – 1.30646
52 wk range: 1.2949 – 1.3566
The loonie is being traded in flat. The one-direction trend is not observed. USD/CAD quotes are testing local support and resistance levels: 1.30400 and 1.30750, respectively. We do not exclude further growth of the USD/CAD currency pair. The Canadian dollar is under pressure due to the negative dynamics of oil prices. Today we recommend paying attention to the US inflation report. Positions should be opened from key levels.
The news feed on Canada’s economy is calm.
Indicators do not give accurate signals: the price has crossed 50 MA and 100 MA.
The MACD histogram is near the 0 mark.
Stochastic Oscillator is in the neutral zone, the %K line has crossed the %D line. There are no signals at the moment.
Trading recommendations
Support levels: 1.30400, 1.30200, 1.30000
Resistance levels: 1.30750, 1.31000
If the price fixes above 1.30750, USD/CAD quotes are expected to rise. The movement is tending to 1.31000-1.31200.
An alternative could be a decrease in the USD/CAD currency pair to 1.30200-1.30000.
The USD/JPY currency pair
Technical indicators of the currency pair:
Prev Open: 109.530
Open: 109.920
% chg. over the last day: +0.42
Day’s range: 109.917 – 110.213
52 wk range: 104.45 – 113.53
USD/JPY quotes have been growing again. The trading instrument has set new local highs. The USD/JPY currency pair found resistance at 110.200. The 109.700 mark is already a “mirror” support. Demand for safe-haven currencies remains at a rather low level due to the reduction of fears of further escalation of the military conflict between the US and Iran. USD/JPY quotes have the potential for further growth. We recommend paying attention to economic reports from the US. Positions should be opened from key levels.
The news feed on Japan’s economy is quite calm.
The price has fixed above 50 MA and 100 MA, which signals the power of buyers.
The MACD histogram is in the positive zone, which also gives a signal to buy USD/JPY.
Stochastic Oscillator is in the neutral zone, the %K line has crossed the %D line. There are no signals at the moment.
Trading recommendations
Support levels: 109.700, 109.350, 109.000
Resistance levels: 110.200, 110.500
If the price fixes above 110.200, further growth of the USD/JPY quotes is expected. The movement is tending to 110.500-110.700.
An alternative could be the correction of the USD/JPY currency pair to 109.400-109.200.
The US dollar has started the day in the green with the index rallying up to 97.16 as of writing. Looking ahead today, US CPI data is the main data print today. The headline reading is expected to have grown at just 0.2% last month down from the prior month’s 0.3% reading.
A print in this region might not do much to detract from USD strength at this point though any downside miss could see USD selling kick in. On the other hand, a strong reading could see the 97.26 resistance level give way.
Euro Under Pressure
EURUSD has been lower today, weighed on by strength in USD. Despite the pullback today, EURUSD is still up off the January lows, trading 1.1130 last. Looking over the rest of the week, the December ECB minutes on Thursday will be the main focus point. If the minutes show there is still strong support or further easing, this could push EUR lower in the near term.
GBP Lower Following GDP Miss
GBPUSD is lower again today following yesterday’s release of lower-than-expected growth numbers. The BOE has warned that a rate cut might be necessary given the subdued level of growth amidst fears that a post-Brexit pickup is now looking less likely. GBPUSD trades 1.2968 last, testing the local supporting trend line.
SPX500 Still Near Highs
Risk assets have had a choppy start to the morning with the SPX500 trading lower initially before reversing. The signing of the US/China trade deal this week should keep risk appetite supported as traders wait on the news of the beginning of the next round of trade negotiations. Today’s US CPI reading could also cause some volatility in the SPX if we see any surprise reading.
JPY & Gold Weaker
Safe havens have been lower this morning with the rally in USD, as well as recent strength in equities, seeing both JPY and gold lower against USD. XAUUSD trades 1543.25 last, having broken back below the 1556.75 level. USDJPY trades 110.03 last, having broken above the 109.71 level which has been firm resistance over recent months.
Crude Lower Again
Oil prices have been a little lower again today over early European trading. The fall back in risks relating to possible military conflict between the US and Iran has weighed heavily on oil prices over the last week seeing price falling from around 65 to current levels around 58. Today, the API will report on last week’s US crude inventory levels ahead of tomorrow’s headline EIA release.
Loonie Breaks Resistance
USDCAD has been higher today, with price breaking out above the 1.3068 level. The rally in USD, as well as weakness in crude prices, is keeping CAD weighed down. Today’s US CPI reading offers the potential for some volatility as does the API crude report. For now, near term bias reams bullish.
Aussie Weaker Against USD
AUDUSD has been lower against USD today. The rally in USD, as well as heightened expectations of an RBA rate cut, are keeping the AUDUSD outlook bearish in the near term. For now, price is trading .69, towards the top of the .6850 – .6926 range.
The monthly consumer price index report will be coming out later today. The report covers the month of December and will give investors significant insights into the new year.
According to the economists polled, the general consensus points to a 0.2% increase on a month over month basis, for both headline and core CPI. This marks a slower pace of increase in consumer prices. In November, headline CPI rose 0.3%.
On a year over year basis, inflation is forecast to remain stable at 2.3% on core and 2.0% on the headline. This puts inflation right on the Fed’s inflation rate target. However, despite the increase in inflation, Fed officials will be staying on the sidelines.
This comes as inflation in the United States (as with most parts of other global economies) has become very sluggish. After years of such slow inflation growth, monetary policy officials are willing to let inflation run above target for a while.
Although today’s inflation data is not one of the metrics followed by the Federal Reserve, it still garners a lot of attention from mainstream investors.
Inflation, alongside full employment, are the two mandates that the Fed controls. While the unemployment rate is near a 50-decade low, there are still some concerns. The recent payrolls report saw wages easing while the pace of jobs added was also softer than expected.
Amid these two, the general consensus is consistent with the view that the Fed will remain on the sidelines.
In some aspects, investors are pricing in the prospect of inflation beating estimates. Thus, even a higher reading is unlikely to do much in terms of market reaction in the longer term.
Overall, December is considered to a stable or tame month as far as price pressures are concerned.
December Inflation Could Rise Higher on Gasoline Prices
One of the components that will heavily influence the inflation report is the price of gasoline.
Gasoline prices are volatile on a month to month basis. In November, while gasoline prices fell over 4% on the year in November, they rebounded in December. For December, the estimates show that gasoline prices rose over 5% on a year over year basis.
This could potentially push inflation well past the current levels of 2%. But at the same time, the retail food prices and the core components could offset the gains.
Oil prices have been generally trending higher in December. This could potentially lead to higher energy prices over the month. Thus, there is a good chance that the headline inflation rate could rise above the estimates.
The inflation data comes on the back of the recent jobs report. Although the headline items seem to be well in line with the Fed’s target levels, the general economy remains weak.
For the moment, investor expectations on rate cuts remain stable. That is to say that investors expect the central bank to lower rates over the course of the year. This falls in contrary to the Fed’s projections.
The Federal Reserve, at its December meeting, signaled that interest rates could remain steady through the course of the year. But a lot of this will depend on how the bank will assess the incoming data.
The US economy is also a major part of the overall picture. Currently, the economy is forecast to grow sluggishly with the idea that growth rate will average around 2.0% through the course of the year.
Today’s inflation report might not bring about much of a market reaction in the longer term as the upside looks to be priced in already.
During yesterday’s trading session, the US dollar remained unchanged relative to the basket of major currencies. The dollar index (#DX) closed yesterday with a slight decrease (-0.02%). Financial market participants expect the signing of an interim trade agreement between Washington and Beijing. At the same time, the Chinese yuan has been growing after the US removed the country from the list of currency manipulators. On Wednesday, Chinese Vice Premier Liu He should sign a partial US deal in Washington.
The British pound is under pressure after the release of weak statistics on GDP and manufacturing production in the UK. So, GDP (m/m) decreased by 0.3%. The volume of manufacturing production decreased in November by 1.7%, while experts expected a decline by 0.3%. Meanwhile, the monthly GDP 3m/3m grew by 0.1%, while investors forecasted a decline of 0.1%.
The “black gold” prices are rising due to protests in Iran. Currently, futures for the WTI crude oil are testing the $58.35 mark per barrel.
Market Indicators
Yesterday, there was the bullish sentiment in the US stock market: #SPY (+0.69%), #DIA (+0.27%), #QQQ (+1.15%).
The 10-year US government bonds yield has declined. At the moment, the indicator is at the level of 1.83-1.84%.
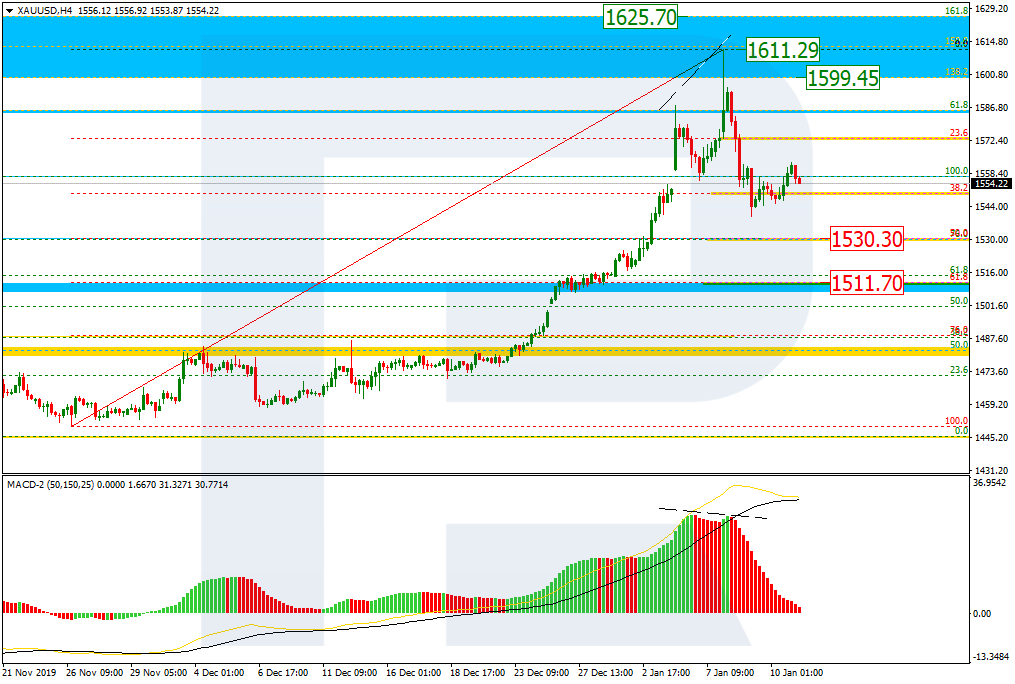
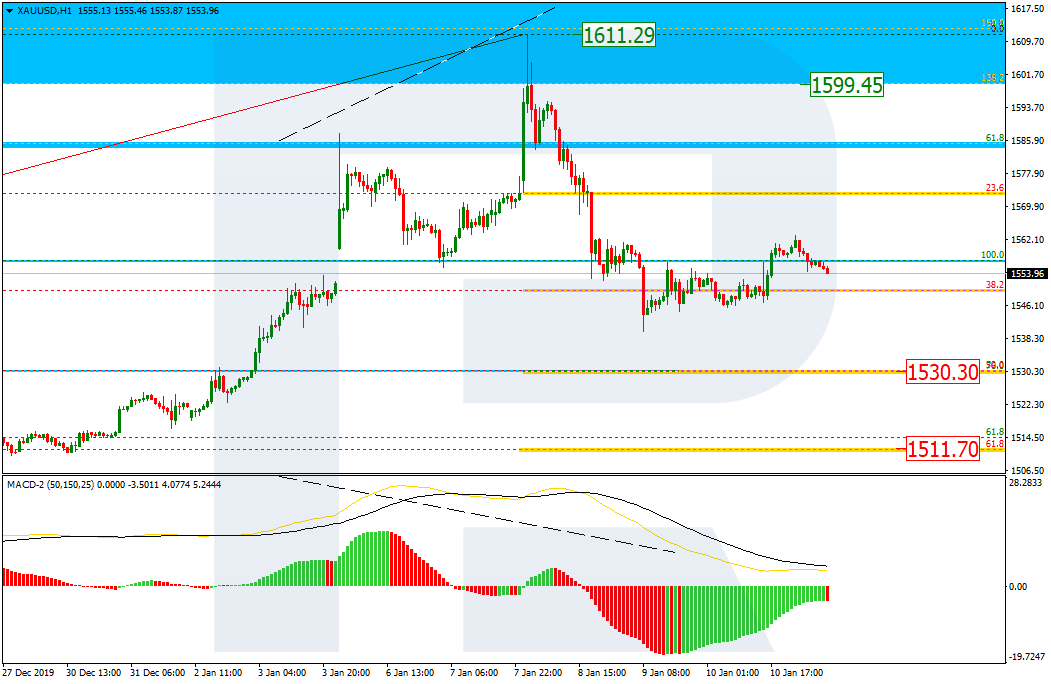
As we can see in the H4 chart, the divergence on MACD made XAUUSD complete the rising wave at 61.8% fibo and start a new descending correction, which has already reached 38.2% fibo. The pair is expected to test this area and then start a new wave to the downside. After finishing the pullback, the instrument may resume trading upwards to reach the high at 1611.29 and the post-correctional extension area between 138.2 and 161.8% fibo at 1599.45 and 1625.70 respectively.
In the H1 chart, after reaching 38.2% fibo, the pair is correcting to the upside. After finishing the pullback, the price is expected to start a new decline towards 50.0% and 61.8% fibo at 1530.30 and 1511.70 respectively.
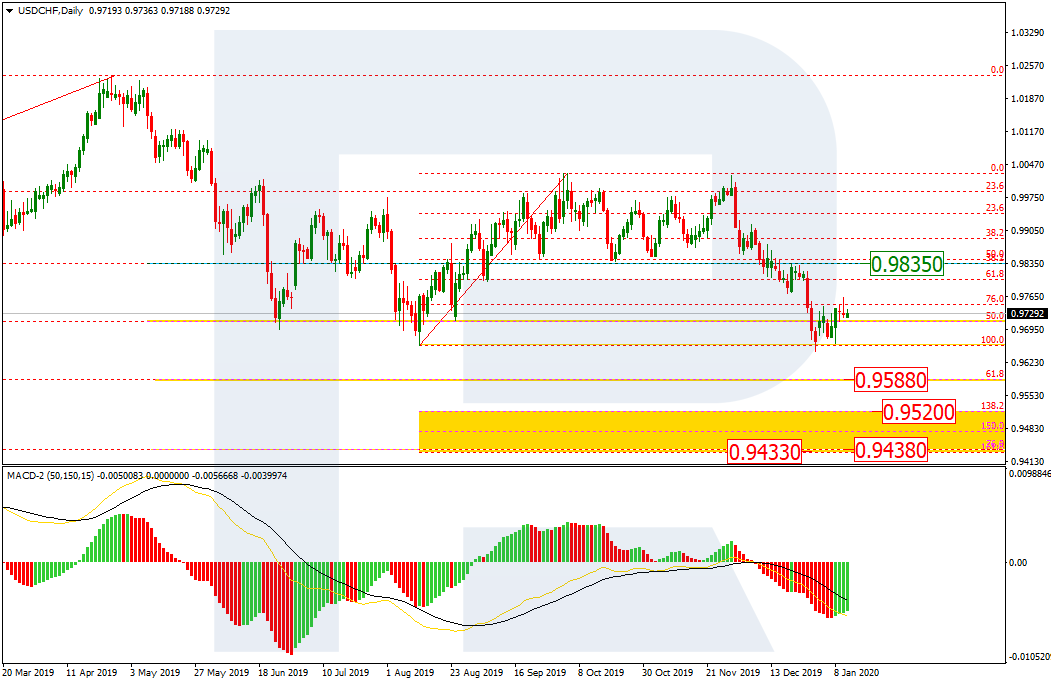
USDCHF, “US Dollar vs Swiss Franc”
In the daily chart, the pair is testing the low it broke earlier, thus indicating a further descending tendency. After testing the low, USDCHF may start a new pullback towards the resistance at 38.2% fibo (0.9835). the next mid-term downside targets are 61.8% and 76.0% fibo at 0.9588 and 0.9438 respectively, which are inside the post-correctional extension area between 138.2 and 161.8% fibo at 0.9520 and 0.9433 respectively.
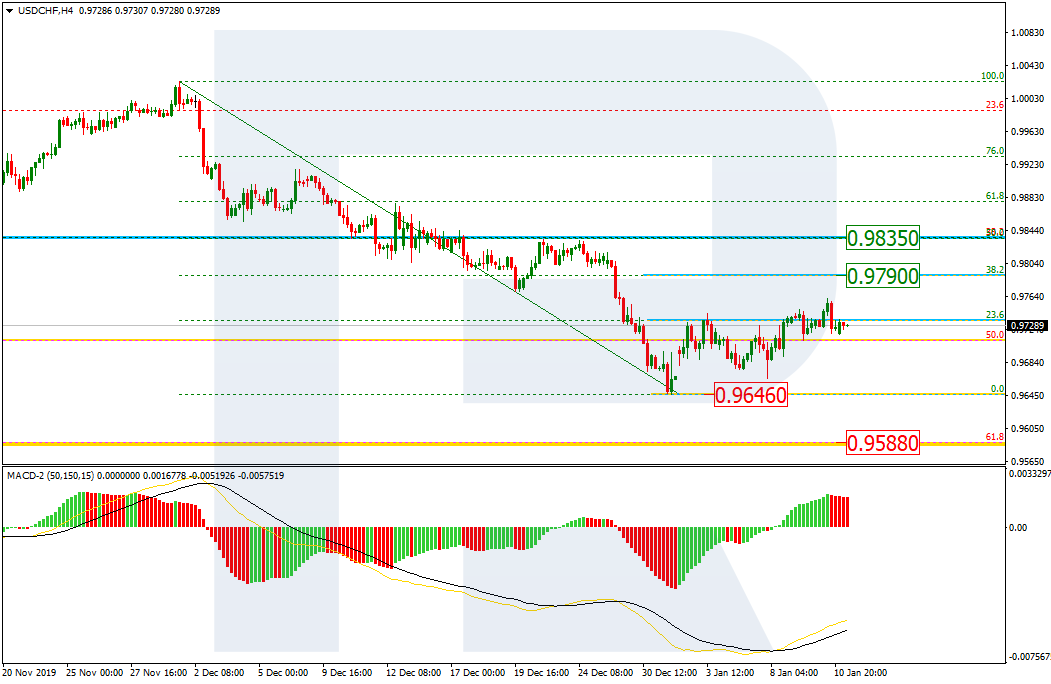
As we can see in the H4 chart, the instrument is correcting upwards to reach 23.6% fibo and may later continue towards 38.2% and 50.0% fibo at 0.9790 and 0.9835 respectively. if the price breaks the low at 0.9646, the descending tendency will continue.
Attention! Forecasts presented in this section only reflect the author’s private opinion and should not be considered as guidance for trading. RoboForex LP bears no responsibility for trading results based on trading recommendations described in these analytical reviews.
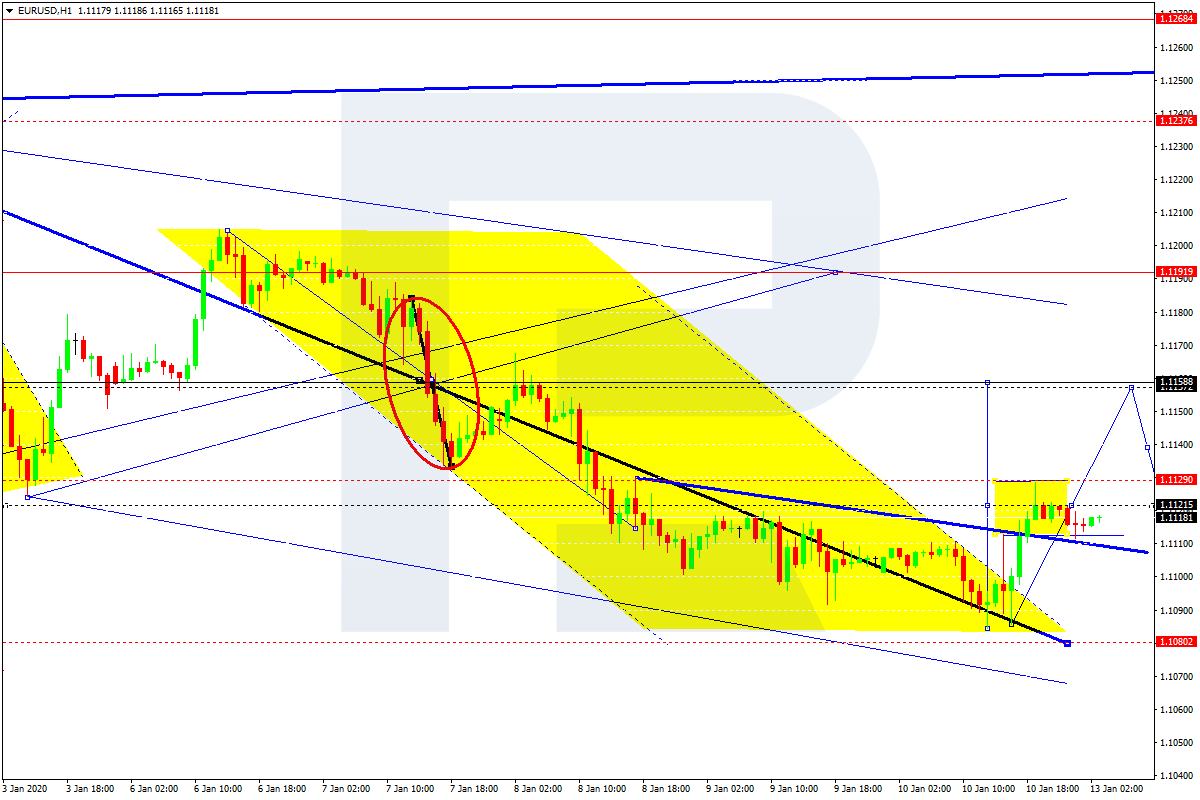
EURUSD is moving upwards; it has reached its downside target at 1.1085. Possibly, the pair may break 1.1129 to the upside and then form one more ascending structure with the target at 1.1155. Later, the market may resume moving downwards to reach 1.1122.
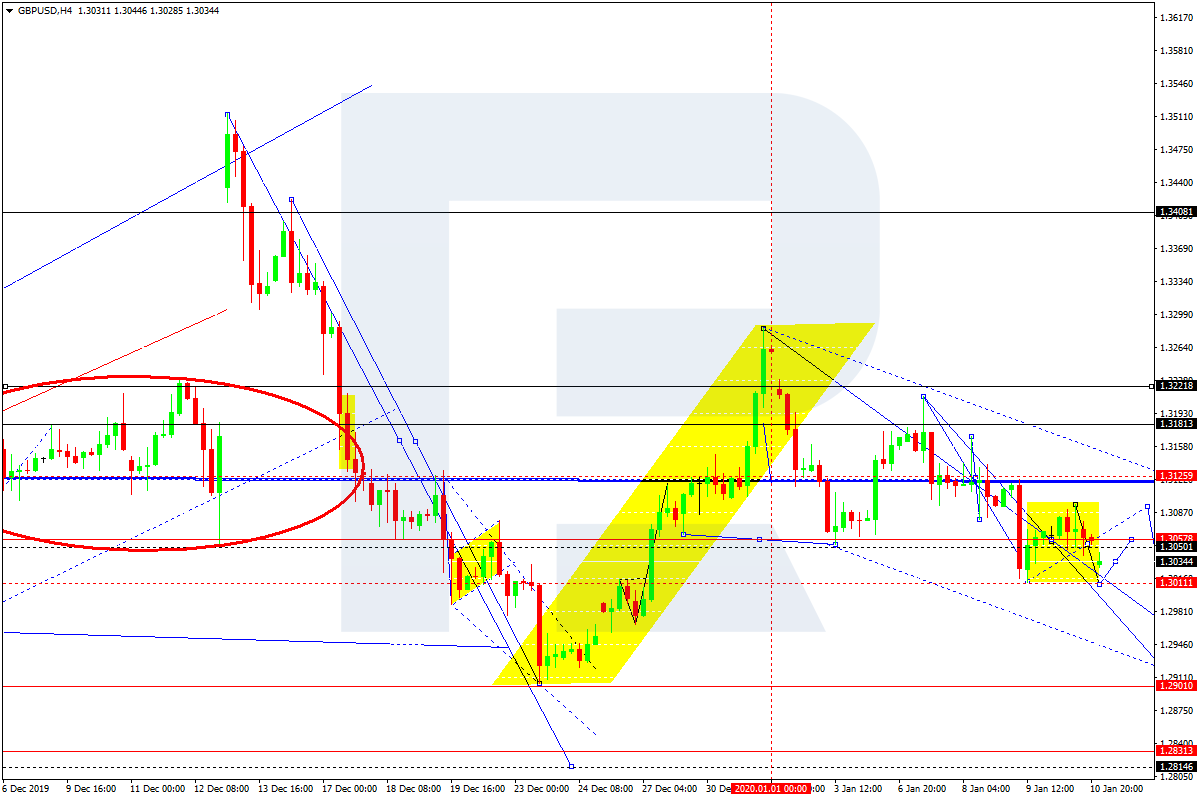
GBPUSD, “Great Britain Pound vs US Dollar”
GBPUSD is moving downwards. Today, the pair may reach 1.3000. After that, the instrument may break this level and then continue falling with the short-term target at 1.2910.
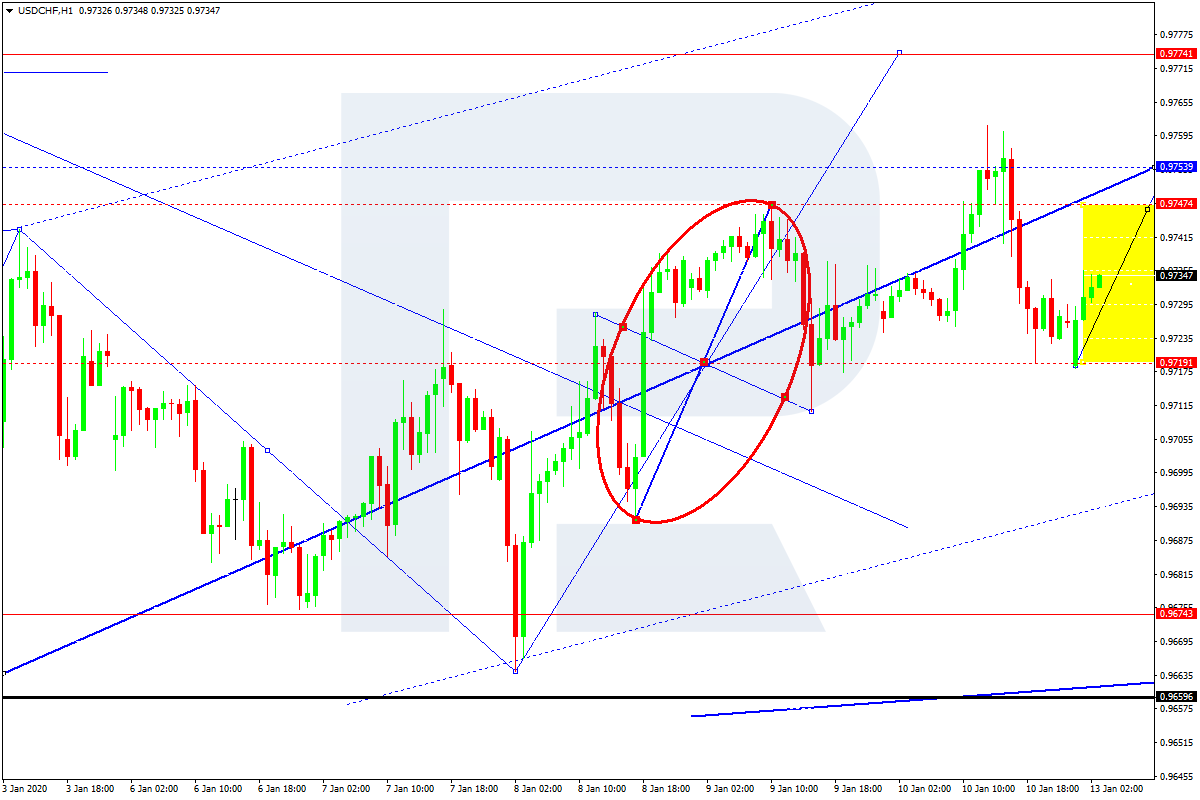
USDCHF, “US Dollar vs Swiss Franc”
USDCHF is still consolidating around 0.9719. Possibly, today the pair may grow to expand the range towards 0.9747. After that, the instrument may break this level and form one more ascending structure with the short-term target at 0.9774.
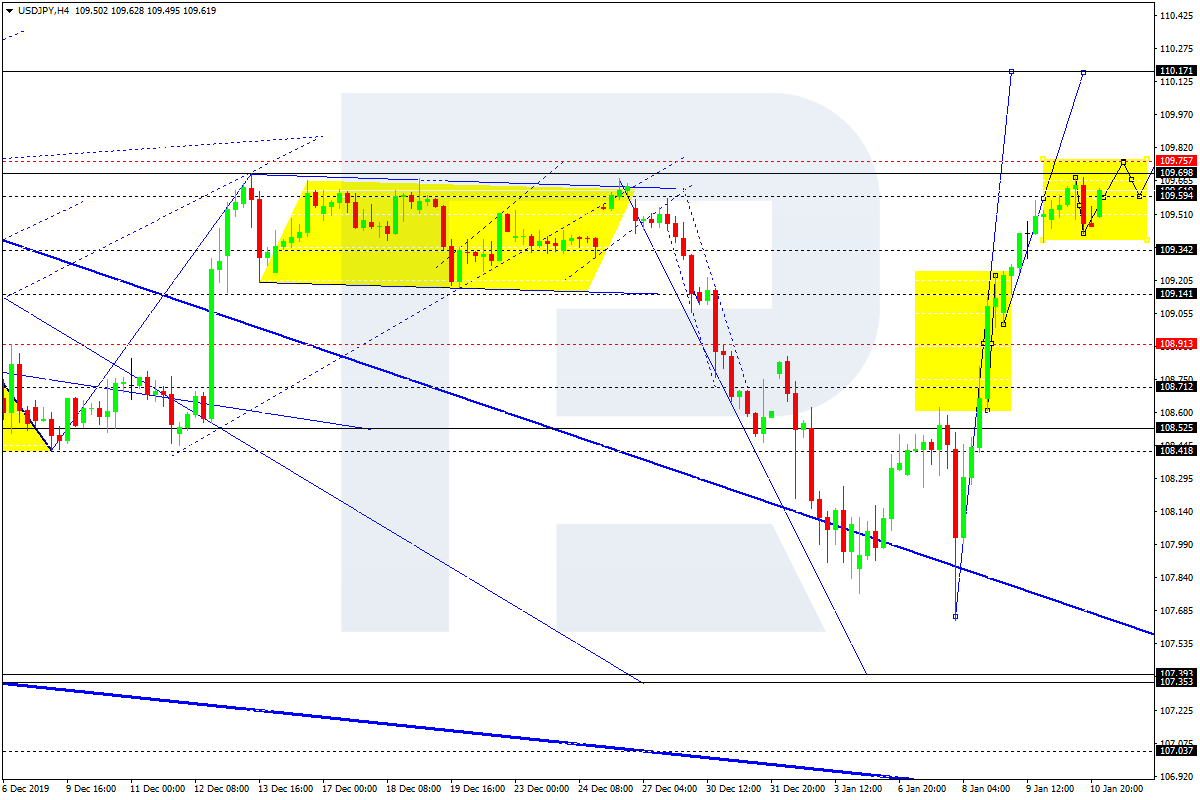
USDJPY, “US Dollar vs Japanese Yen”
USDJPY is consolidating around 109.59. Possibly, the pair may break 109.75 to the upside and continue growing to reach 110.17. Later, the market may form a new descending structure with the first target at 108.90.
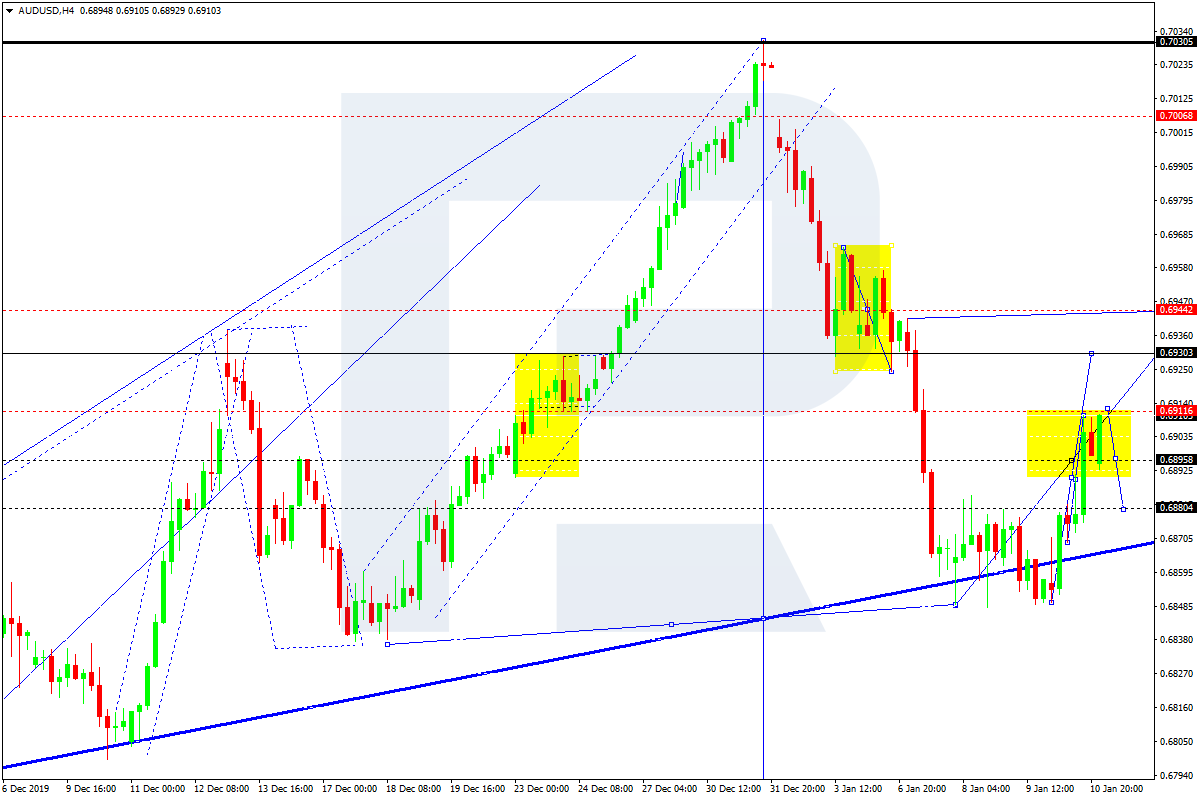
AUDUSD, “Australian Dollar vs US Dollar”
AUDUSD is moving upwards with the short-term target at 0.6930. After that, the instrument may start another decline to reach 0.6900 and then continue trading inside the uptrend towards 0.6944.
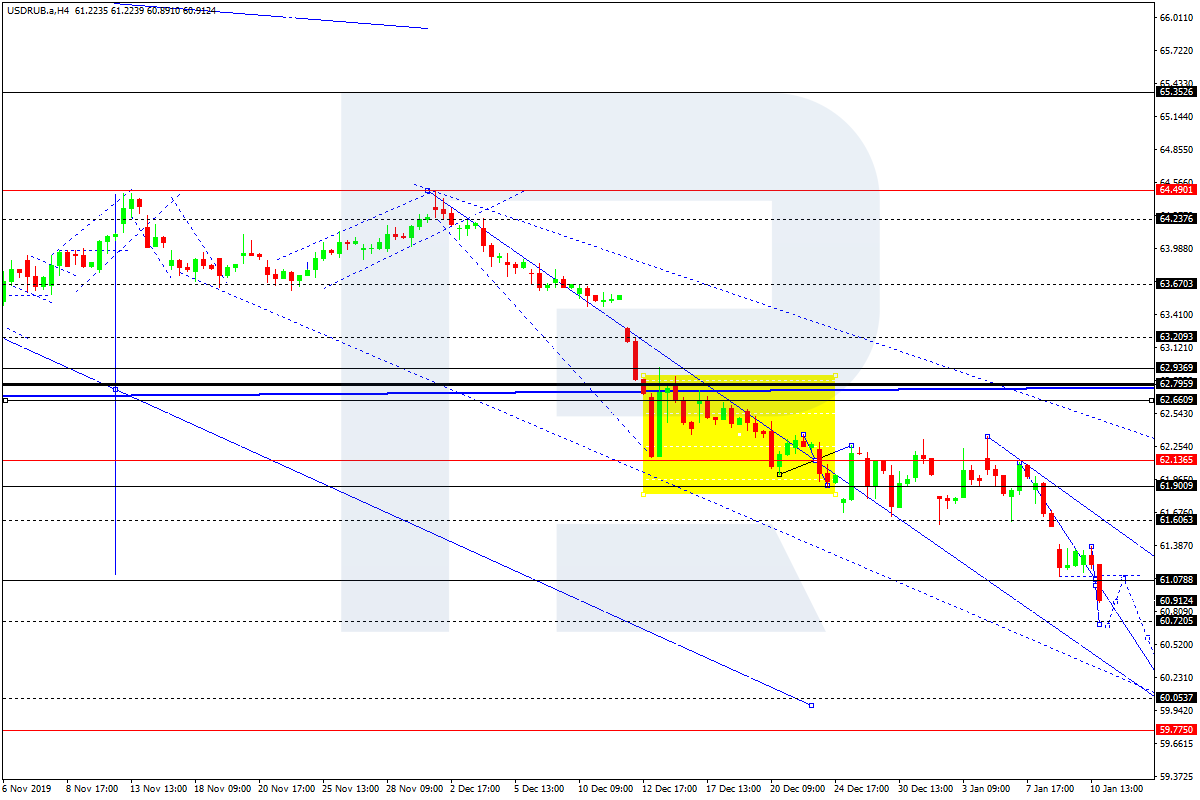
USDRUB, “US Dollar vs Russian Ruble”
USDRUB is falling towards 60.85. Later, the market may start a new correction to test 61.00 from below and then resume trading inside the downtrend to reach 60.06.
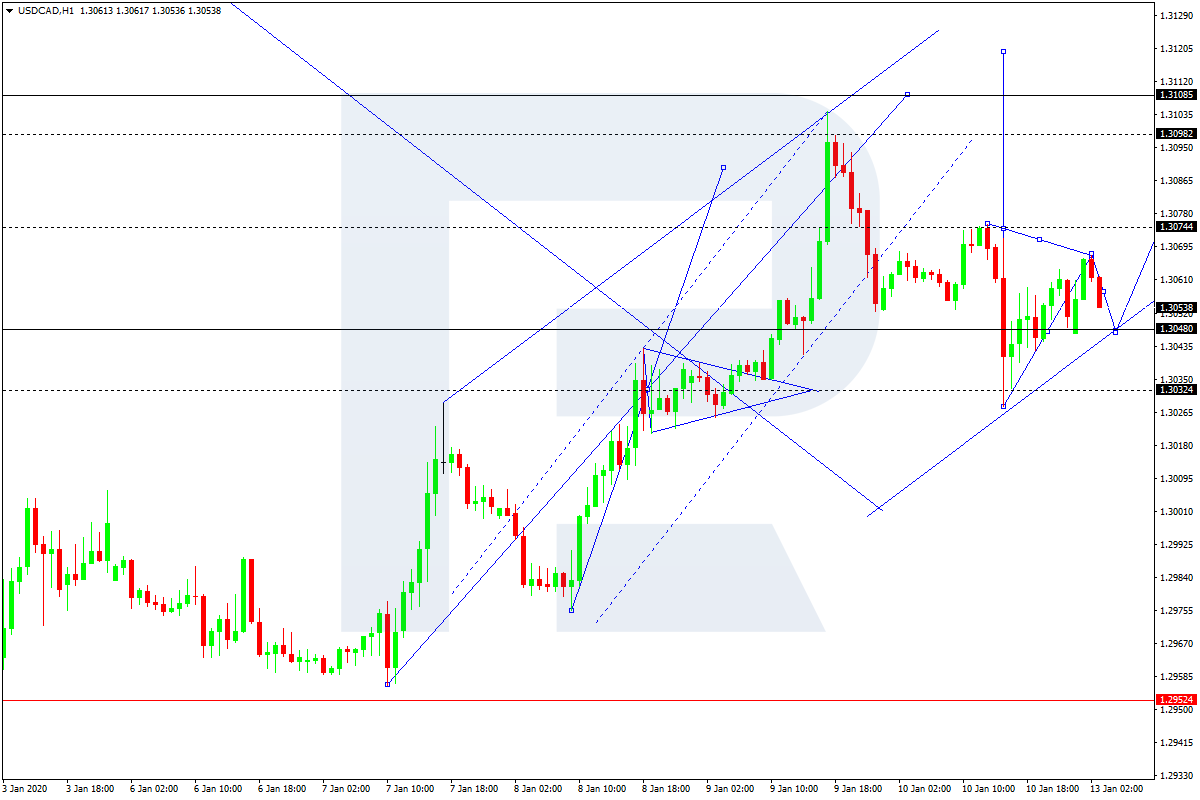
USDCAD, “US Dollar vs Canadian Dollar”
USDCAD continues growing towards 1.3131; it has already completed the ascending impulse from 1.3030 to 1.3067. Possibly, today the pair may correct to reach 1.3048 and then form one more ascending structure with the short-term target at 1.3100.
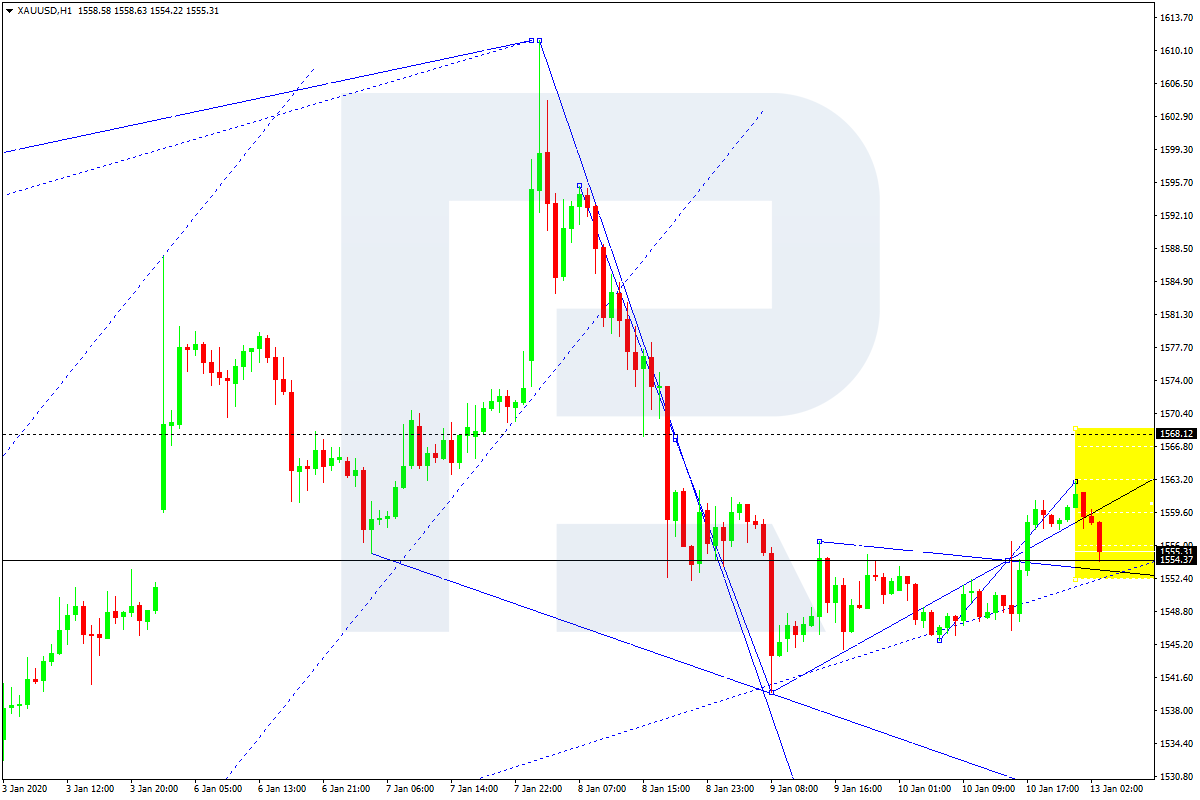
XAUUSD, “Gold vs US Dollar”
Gold is correcting towards 1568.12. Later, the market may start a new descending structure to reach 1524.50 and then start another growth with the target at 1582.90.
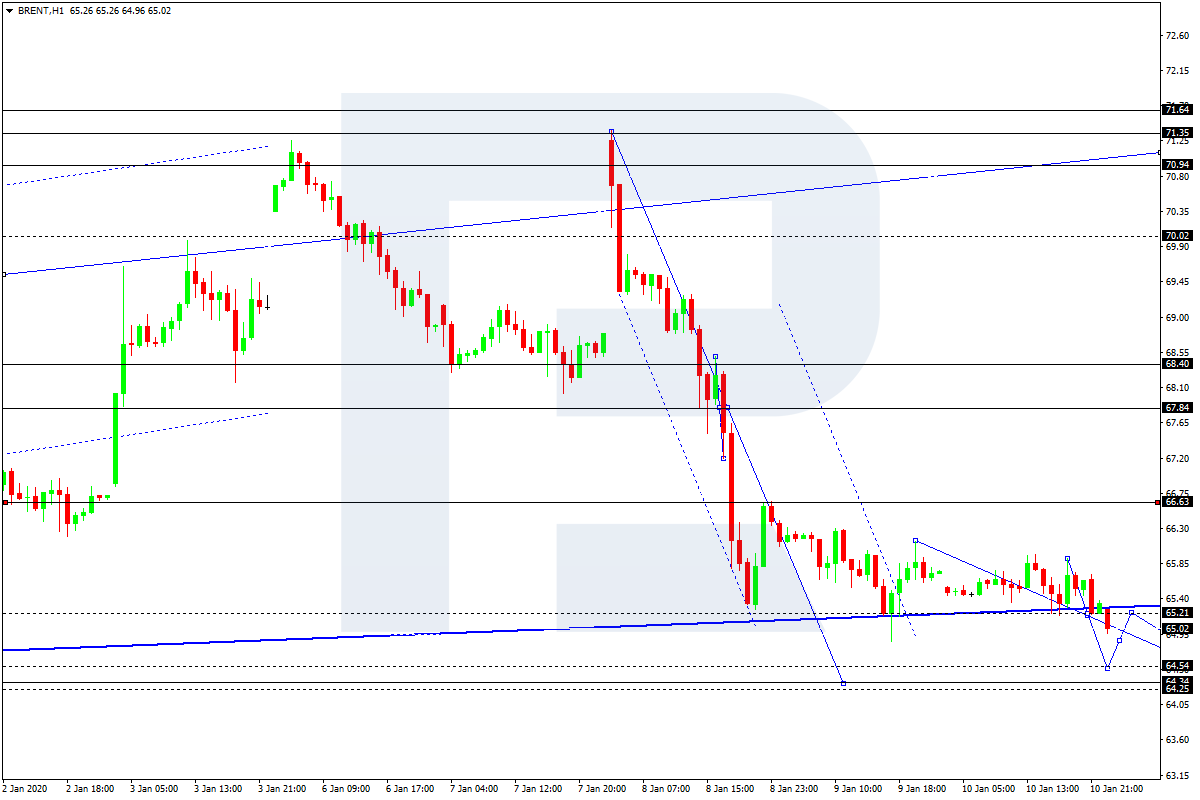
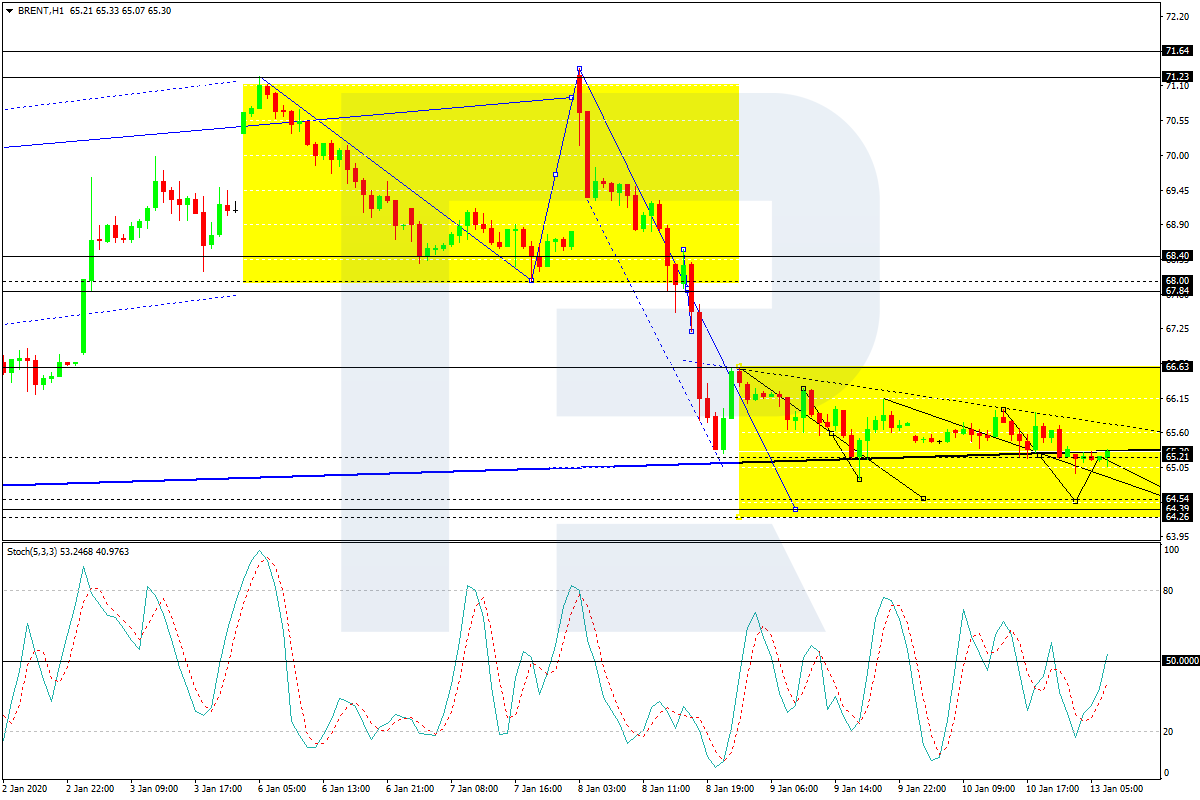
BRENT
Brent is consolidating above 65.20. Possibly, the pair may start another decline towards 64.25 and then resume moving upwards with the first target at 67.80.
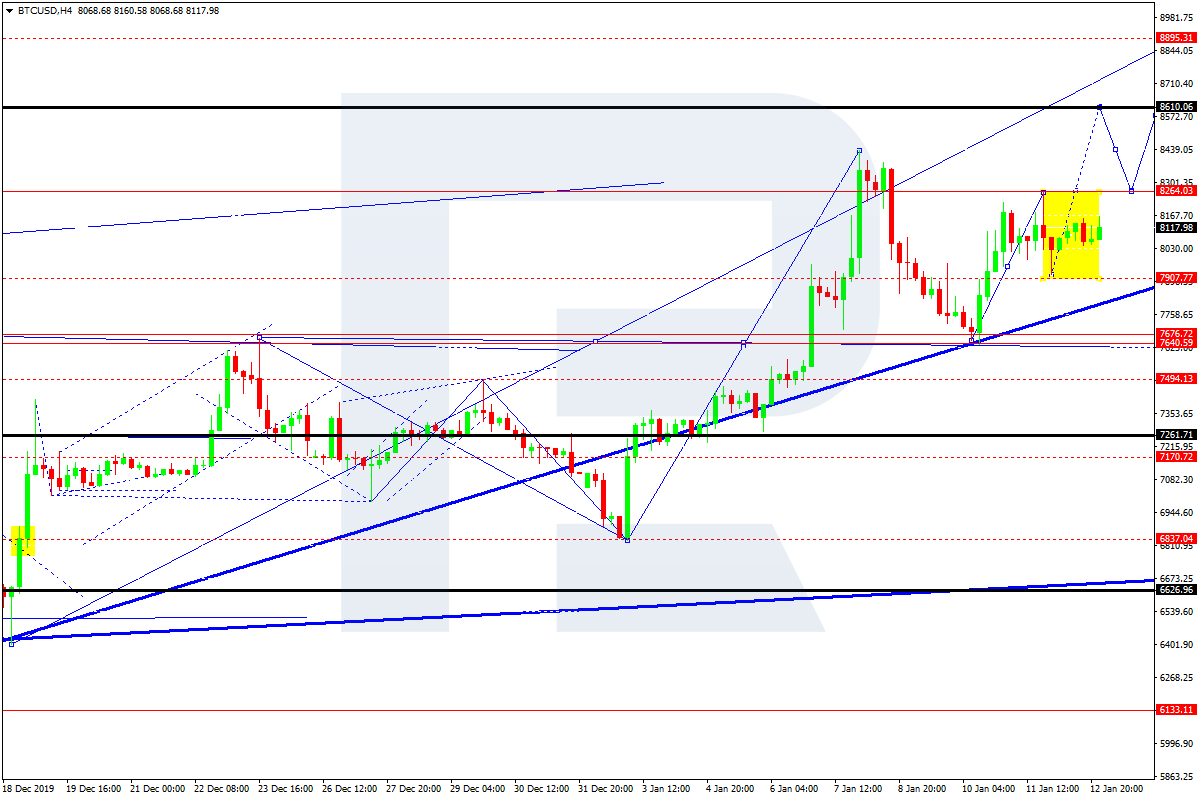
BTCUSD, “Bitcoin vs US Dollar”
After completing the ascending structure towards 8250.00, BTCUSD has finished the correction at 7900.00. Possibly, today the pair may resume growing to reach 8600.00 and then start another correction to return to 8250.00. Later, the market may form one more ascending structure with the target at 8900.00.
Attention! Forecasts presented in this section only reflect the author’s private opinion and should not be considered as guidance for trading. RoboForex LP bears no responsibility for trading results based on trading recommendations described in these analytical reviews.
The Trump assassination of major general Qasem Soleimani reflects regime change efforts – withdrawal from Iran nuclear deal, new sanctions, covert operations, undermined de-escalation, plunging oil production and diminished economic prospects – that have taken a perilous turn.
On January 3, 2020, the plane of Qasem Soleimani, major general of the Islamic Revolutionary Guard Corps (IRGC) and commander of its elite Quds Force, arrived at Baghdad International Airport. At the same time, the US MQ-9 Reaper, a prime assassination drone, was loitering in the area with other military aircraft.
At the Airport, Soleimani left with Abu Mahdi al-Muhandis, the deputy head of the Iran-backed Iraqi Popular Mobilization Forces. As they entered two vehicles, the convoy headed toward downtown Baghdad. At 1 am local time, the Reaper launched several missiles on Baghdad Airport Road. The two cars exploded in flames killing some 10 people, including Soleimani and al-Muhandis.
After the devastation, whatever was left of Soleimani could be identified only by his ring. Ironically, several perished Iranian and pro-Iranian commanders had been instrumental in the defeat of Islamic State.
Secretary of State Mike Pompeo said Washington had made an “intelligence-based assessment” that Soleimani was “actively planning in the region” to attack US interests. In turn, President Donald Trump declared Soleimani was behind “imminent attacks” on US diplomatic facilities and personnel across the Middle East.
That’s the official story.
Undermining de-escalation
Afterwards, Trump’s team got caught offering mixed messages about Iran’s “imminent” attacks as a justification for Soleimani assassination. National security adviser Robert O’Brien says Trump authorized eliminating Soleimani who cooperated with his allies “to kill American diplomats and soldiers in significant numbers.” Defense Secretary Mark T. Esper claims there was “exquisite intelligence” indicating Soleimani was “conducting preparing military operations” akin to “terrorist activities” against the US. In turn, Pompeo seized Iran’s past behavior as justification.
None of these reasons, which stress attributed intentions rather than hard evidence, seem credible in the light of Iran’s efforts at multilateral diplomacy, its challenging economic conditions and the behind-the-façade attempt at de-escalation with Saudi Arabia. However, the mixed messages do reflect a longstanding US effort to justify “permanent war” in the Middle East and certain other hot spots. The House resolution to limit Trump’s war powers against Iran is a move in the right direction but it can neither reverse the past policy mistakes nor halt the current escalation.
In the subsequent TV address, Trump delivered his Orwellian soundbite. “We took action last night to stop a war… We did not take action to start a war.” And yet, several US planes were taking off from bases in the eastern United States toward the Middle East as Pentagon sent 3,500 members of the 82nd Airborne Division, one of the largest deployments in decades.
Amid mega rallies for Soleimani and Iraqi parliament calling for the expulsion of US troops from the country, Iran’s Supreme Leader Ali Khamenei spoke about the impending “retaliation.” Trump warned Tehran that any retaliation would result in US targeting 52 Iranian significant sites, including cultural sites. The allusion was to the number of American hostages during the Iran hostage crisis some 40 years ago.
Then came the bomb shell. Two days after the assassination, Iraq’s Prime Minister Adil Abdul-Mahdi addressed his country’s parliament suggesting that Soleimani was on a peace mission. According to Abdul-Mahdi, he had planned to meet Soleimani on the morning the general was killed to discuss a diplomatic rapprochement that Iraq was brokering between Iran and Saudi Arabia. Abdul-Mahdi said Trump personally thanked him for the efforts creating the impression that Soleimani could safely travel to Baghdad, even as the White House was busy planning a hit.
Subsequently, Pompeo rushed to defend the assassination, again. “We know that [the report about Soleimani’s peace mission] wasn’t true,” he said. “We got it right.” Once again, he presented no hard evidence.
In reality, the US assassination appears to have been the latest effort to preempt de-escalation plans in the region, to reinforce Iran’s destabilization. It follows years of misguided covert operations. Here’s how it happened.
From Trump’s U-turn to new Iran sanctions
Only a few years ago, there was still great hope in Iran. After years of diplomacy, the comprehensive nuclear accord (JCPOA, July 2015) was achieved between Tehran and the so-called P5+1 nations; that is, the five permanent members of the UN Security Council – China, France, Russia, UK, and the US, plus Germany together with the European Union (EU). Under the deal, Iran agreed to eliminate its stockpile of medium-enriched uranium, while the International Atomic Energy Agency (IAEA) gained access to all Iranian nuclear facilities.
To Iran, the deal offered relief from US, UN and multilateral sanctions on energy, financial, shipping, automotive and other sectors. These primary sanctions were lifted after the International Atomic Energy Agency’s (IAEA) certification in January 2016 that Iran had complied with the agreement. Yet, secondary sanctions on firms remained in place, along with sanctions applying to US companies, including banks.
After the 2016 US election, the Congress with its Democratic majority – not president-elect Trump – paved the way for a U-turn. Following the House of Representatives, the Senate in late 2016 unanimously extended the Iran Sanctions Act (ISA) for a decade. Stunningly, the deal that President Obama had portrayed as his legacy in the region was shot down surprisingly fast. Intriguingly, most Democrats reversed their positions regarding the nuclear deal.
As Trump arrived in the White House, he began developing a far more muscular policy against Iran to benefit from Saudi economic and geopolitical support. In May 2017, Trump and Saudi Arabia’s then-king Salman bin Abdulaziz Al Saud signed a historical arms deal, which totaled $110 billion immediately and $350 billion over a decade. Widely perceived as a “counterbalance” against the Iranian influence in the region, it cemented the ties between Saudi Arabia and the US. However, Crown Prince Mohammed bin Salman’s reform efforts have been tarnished by harsh measures against members of his family and opposition, the Khashoggi murder and dismemberment, and the devastating war and famine in Yemen.
In return for the Saudi deal, the White House began a concerted push to counter Iran’s regional and strategic weapons programs, which had been excluded from the Iran deal. In May 2018, Trump signed National Security Presidential Memorandum 11, “ceasing U.S. participation in the [Iran nuclear deal]” and taking additional action to counter Iran’s “influence and deny Iran all paths to a nuclear weapon.”
That’s when the US effectively nullified a decade-long unified, multilateral approach to Iran’s activities, while setting in motion unilateral economic sanctions, which have affected not just U.S. businesses but targeted commerce from other major economies, particularly China, France, Russia, UK, Germany and the EU.
Even after Iran’s missile attacks against two bases of American troops, which seem to have purposefully shunned human targets, Trump promised further ratcheting up of economic sanctions against Iran. The use of sanctions is predicated on a purposeful effort to overthrow the Iranian government.
From Bolton’s “Shah scenario” to regime change
The Trump administration has greenlighted clandestine efforts to weaken Iran’s “moderates” hoping to incite “hawks” into strategic moves that could be used as a pretext for regime change. In April 2018, Trump hired the neoconservative uber-hawk John Bolton as US National Security Advisor (he was booted less than a year and half later). A relic of the Bush era, Bolton had engaged in the “weapons of mass destruction” pretense that led to the Iraq War. Now he advocated regime change in Iran and other countries.
By November 2017, Bolton urged the US to have a contingency plan for a “Shah of Iran scenario” and regime change before February 2019; the 50th anniversary of the Iranian revolution. His change agent was Mojahedin-e Khalq (MEK), an Iranian opposition group which advocates a violent coup in Iran. In the early 2010s, the UK, EU and the US considered MEK a terrorist organization until then-State Secretary Hillary Clinton de-listed the group, to exploit it in US-led destabilization.
To support his economic sanctions with clandestine operations, Trump named Michael D’Andrea as the head of CIA’s Iran operations. Nicknamed “Ayatollah Mike,” he inspired the character of The Wolf in the Oscar-awarded movie Zero Dark Thirty (2012). Although D’Andrea failed to track Nawaf al-Hazmi, one of the hijackers who crashed American Airlines flight 77 into the Pentagon on September 11, 2001, he was made head of the CIA’s Counterterrorism Center few years later. With President Obama’s blessing, he also presided over hundreds of US drone strikes in Pakistan and Yemen. His operatives oversaw several interrogations, which a US Senate report has described as torture. And he has been blamed for the Camp Chapman attack in Afghanistan in which seven CIA operatives were killed.
When the then-CIA chief Mike Pompeo became Secretary of the State, his deputy Gina Haspel took charge of CIA. Following 9/11, Haspel oversaw a secret CIA prison in Thailand, which housed suspected Al-Qaeda operatives. Relying on “enhanced interrogation techniques,” she, like D’Andrea, was deeply involved in the detention and interrogation program condemned by the 2014 Senate report.
Worse, Haspel played a key role in the destruction of 92 interrogation videotapes that showed the torture of detainees in black sites. While the Bush and Obama era CIA leaders supported her CIA nomination, more than 100 retired US generals and admirals expressed “profound concern,” due to her record.
Plunging oil production
D’Andrea and Pompeo favor regime change in Iran and some observers see their covert-operation influence in the 2019-20 Iranian protests in many cities. As Iranians have greatly suffered from US efforts at domestic destabilization and international insulation, some demonstrators are obviously motivated by economic woes. But it also seems that Bolton’s Shah scenario and its variations remain on the table, as evidenced by the role of the US-sponsored Pahlavi loyalists among some protesters.
In contrast, Iranians see oil as the main reason to US interest in the Middle East. Iran and Iraq hold some of the world’s largest deposits of proved oil and natural gas reserves. Combined, their reserves exceed those of Venezuela, which has the world’s largest proved reserves.
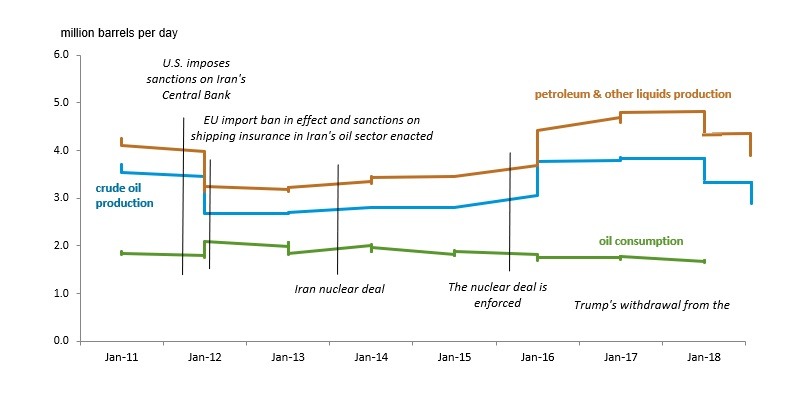
Between 2010 and 2013, the sanctions hurt Iran’s economy contributing to the fall of crude oil exports from 2.5 million barrels per day to 1.1 million by mid-2013. That, in turn, was compounded by the plunge in oil prices since early 2014. Following the nuclear deal, Iran’s production soared back to 4 million barrels. With Trump’s efforts at regime change, the capacity steadily decreased to 3.7 million barrels per day (Figure 1). Recent OPEC estimates suggest it has plunged to 2.8 million barrels.
Figure 1 Iran’s Petroleum Production and Consumption, 2011-2018
Source: EIA; Difference Group.
If Iran’s production capacity takes a further hit, that will penalize particularly its biggest importers China, India, South Korea and Turkey.
Diminished Prospects
Since Russia and China were expected to stay behind the Iran nuclear deal, the real question was whether the European powers – Germany, France, the UK, and the EU itself – would defend it. Unsurprisingly, the Trump administration targeted European businesses that did business in and with Iran after the nuclear deal. In June 2019, the EU created a mechanism (INSTEX) that allows European countries to trade with Iran despite US sanctions. But it was too little, too late. Brussels failed to sustain the Iran nuclear deal against Trump’s unilateral moves.
Before 2015, Iran’s economy shrank by 9% two years, due to sanctions. After stabilization, sanctions relief enabled Iran’s oil exports to return to nearly pre-sanctions levels, permitted Tehran to regain access to funds held abroad, boosting 7% overall economic growth in 2016. Foreign energy firms made new investments in the energy sector and major aircraft manufacturers sold Iran’s commercial airlines new passenger aircraft. The relief contributed to the victory of Iran’s President Hassan Rouhani in the 2017 presidential election. Growth broadened to the non-oil sector. Real GDP growth was projected to rise toward 4.5% over the medium-term as financial sector reform was anticipated to take hold.
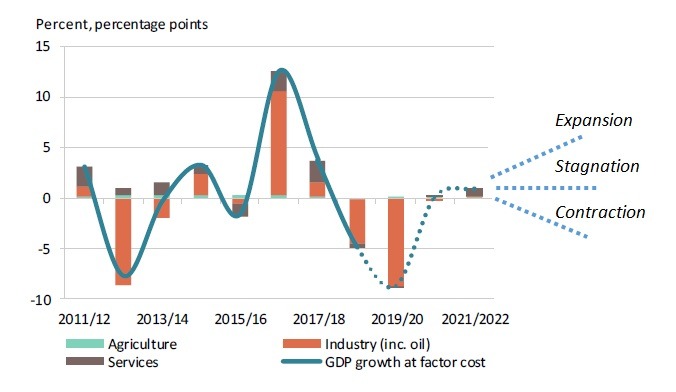
But then came the Trump U-turn. In May 2018, he had the U.S. withdraw from the nuclear deal, while secondary sanctions drove Iran’s economy into mild recession as major companies exited the country rather than risk being penalized by the US. The value of Iran’s currency declined sharply. Even before the US escalation, Iran’s economy was expected to undergo a second consecutive year of recession and contract by 8.7% in 2019/20. Inflation was estimated to reach 38% annually with mounting fiscal pressures. Economic expansion, which began after the nuclear deal, has been undermined. Neither is stagnation enough for the Trump administration. What the White House is fostering is progressive contraction (Figure 2).
Figure 2 Iran: GDP Growth and Supply Side Components, 2011-22
Source: World Bank; Difference Group
Following the drastic re-escalation, Iran’s economy will have to cope with even more challenging downward risks. And if oil exports were to be curtailed further, the economy could enter into a steeper recession and suffer from high inflation rates. In such a status quo, the challenge of protecting the vulnerable households would put additional pressure on the government finances and potentially the rial. Unfortunately, that may be precisely the White House’s objective.
“The challenges highlight the crucial role of further economic diversification by focusing on non-oil sources of growth and government revenues,” the World Bank stated in a recent update. In reality, economic diversification can only be built on peaceful conditions and political stability, which allow governments to proceed with a medium-term diversification. Such preconditions predate Trump’s Iran policy that has undermined years of international, multilateral diplomacy.
The net effect is the most dangerous escalation in the Middle East in decades and possibly the last nail in the fragile global economic prospects that could cause a synchronized global contraction in the course of 2020.
About the Author:
Dr. Dan Steinbock is an internationally recognized strategist of the multipolar world and the founder of Difference Group. He has served at the India, China and America Institute (USA), Shanghai Institutes for International Studies (China) and the EU Center (Singapore). For more, see https://www.differencegroup.net
The original commentary was published by the UK-based World Financial Review on January 10, 2020.
On Friday, the US dollar fell slightly against a basket of major currencies. The dollar index (#DX) closed in the red zone (-0.09%). The US has published rather weak labor market statistics for December. 145K new jobs were created in the nonfarm sector of the country, which is below market expectations at 164K. Average hourly earnings growth slowed down from 3.1% (yoy) to 2.9% (yoy). The unemployment rate remained unchanged at 3.5%. At the moment, the greenback is consolidating relative to its main competitors.
This week, investors expect the completion of the phase-one trade deal between the US and China. On Wednesday, China’s Vice Premier Liu He will visit Washington to sign a deal, which will lead to a weakening of the conflict between the countries. Under the agreements, Beijing has pledged to increase purchases of US goods and services in return for suspending and rolling back duties on Chinese imports. The deadline for the start of the next stage of negotiations has not yet been set, and if either party fails to fulfill its obligations, trade tensions may become aggravated.
The “black gold” prices have become stable after a sharp decline last week. At the moment, futures for the WTI crude oil are testing the $59.00 mark per barrel.
Market Indicators
On Friday, there was the bearish sentiment in the US stock market: #SPY (-0.29%), #DIA (-0.46%), #QQQ (-0.26%).
The 10-year US government bonds yield has declined. At the moment, the indicator is at the level of 1.84-1.85%.
The Economic News Feed for 13.01.2020:
– UK GDP data at 11:30 (GMT+2:00);
– Manufacturing production in the UK at 11:30 (GMT+2:00).
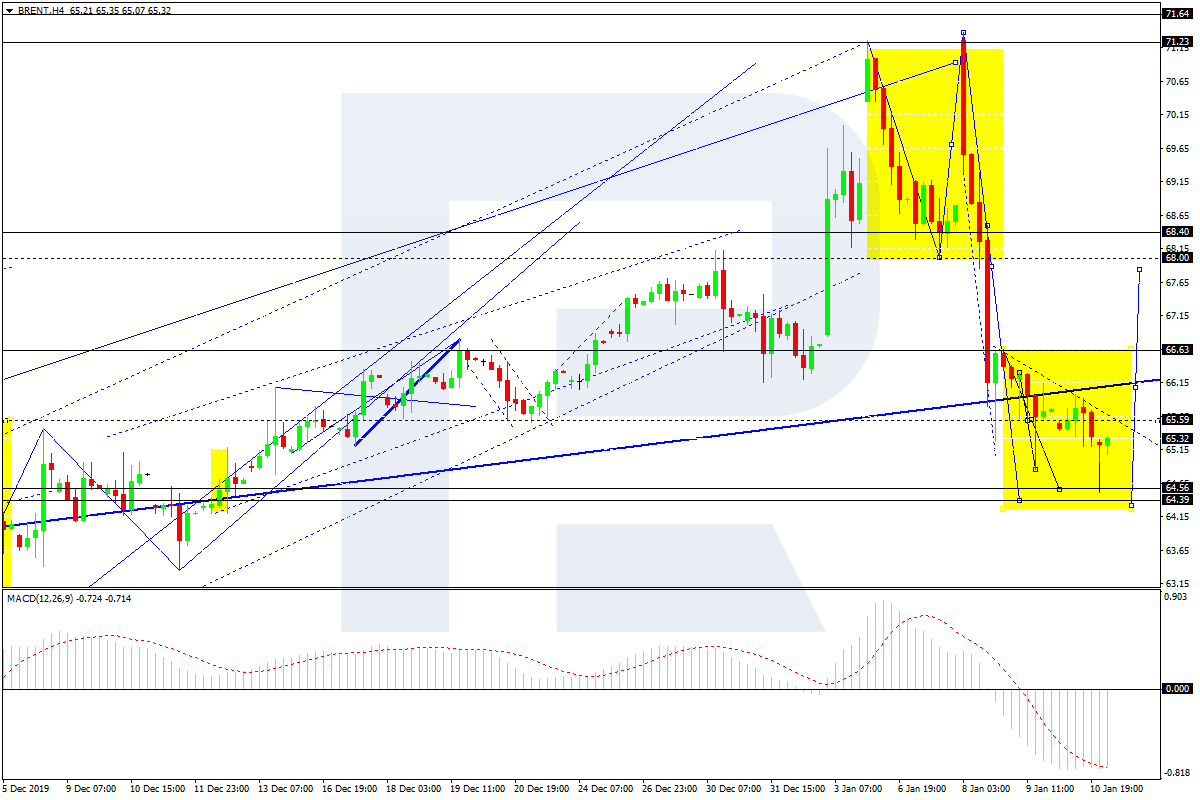
On Monday, January 13th, Oil prices stopped falling right now, the instrument is consolidating around 65.05 USD.
The latest report on the number of oil rigs in the USA from Baker Hughes showed -11 units, thus bringing the total number to 659. The indicator has been decreasing for the third consecutive period. The number of gas rigs dropped by 4 units, down to 119 totals. Overall, the number of rigs lost 15 units over the previous week and now equals to 781. Let’s remember that a year ago the indicator was 1,075 units.
It’s a pretty bullish signal for commodity market investors, but their attention is mostly focused on speculations.
For example, the US-Iranian conflict is fading a bit but still remains open. This Middle Eastern issue may catch fire in split seconds and market players will buy oil from the current levels with great pleasure only for selling it when it reaches 70.00 USD.
As we can see in the H4 chart, Brent has broken 68.00 to the upside and may correct to reach 64.40. Possibly, today the pair may finish this descending wave and form a new one to the upside with the target at 65.00. After that, the instrument may start another correction towards 66.00 and then resume growing to reach 71.25. From the technical point of view, this scenario is confirmed by MACD Oscillator: its signal line is moving upwards above 0 and may leave the histogram area soon. This, in its turn, means that the pair is about to complete its descending tendency, which may be followed by another wave inside the uptrend.
In the H1 chart, after breaking 65.20 to the downside, Brent may continue falling to reach 64.60. Today, the pair may reach this level and form one more ascending wave. If later the price breaks 65.85 upwards, the instrument may continue growing to reach the first target at 68.00. From the technical point of view, this scenario is confirmed by Stochastic Oscillator: its signal line is moving below 50, thus indicating that the pair may update the low and then resume the uptrend.
Disclaimer
Any predictions contained herein are based on the authors’ particular opinion. This analysis shall not be treated as trading advice. RoboForex shall not be held liable for the results of the trades arising from relying upon trading recommendations and reviews contained herein.