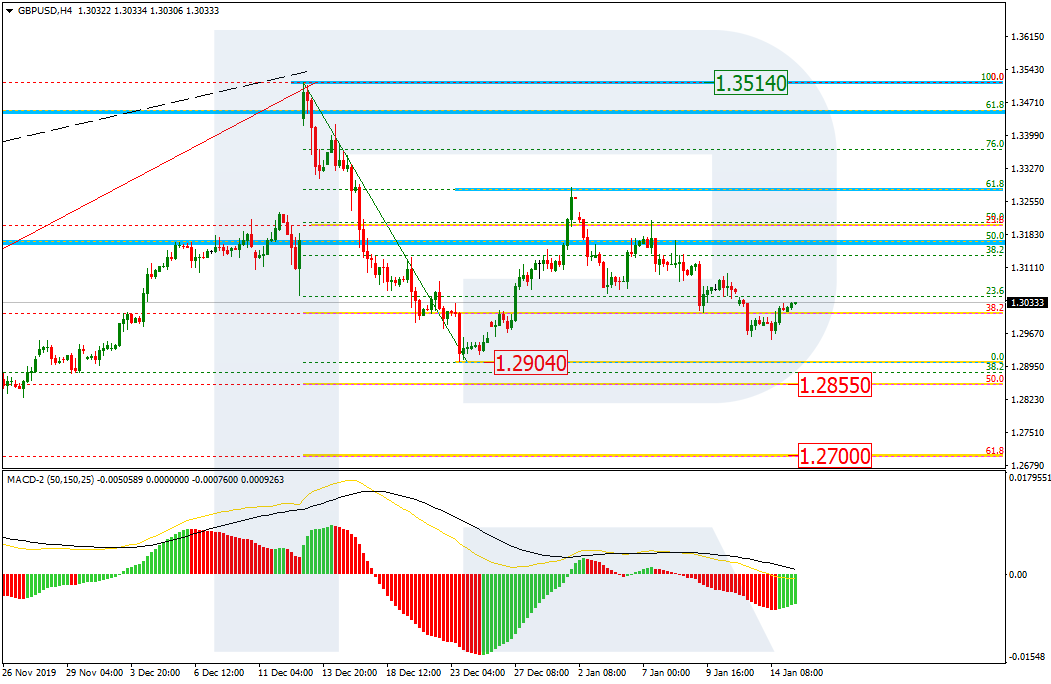
As we can see in the H4 chart, after completing the correctional uptrend at 61.8% fibo, GBPUSD is moving downwards. The closest downside target is the low at 1.2904. If later the price breaks this level, the instrument may start a proper descending wave towards 50.0% and 61.8% fibo at 1.2855 and 1.2700 respectively.
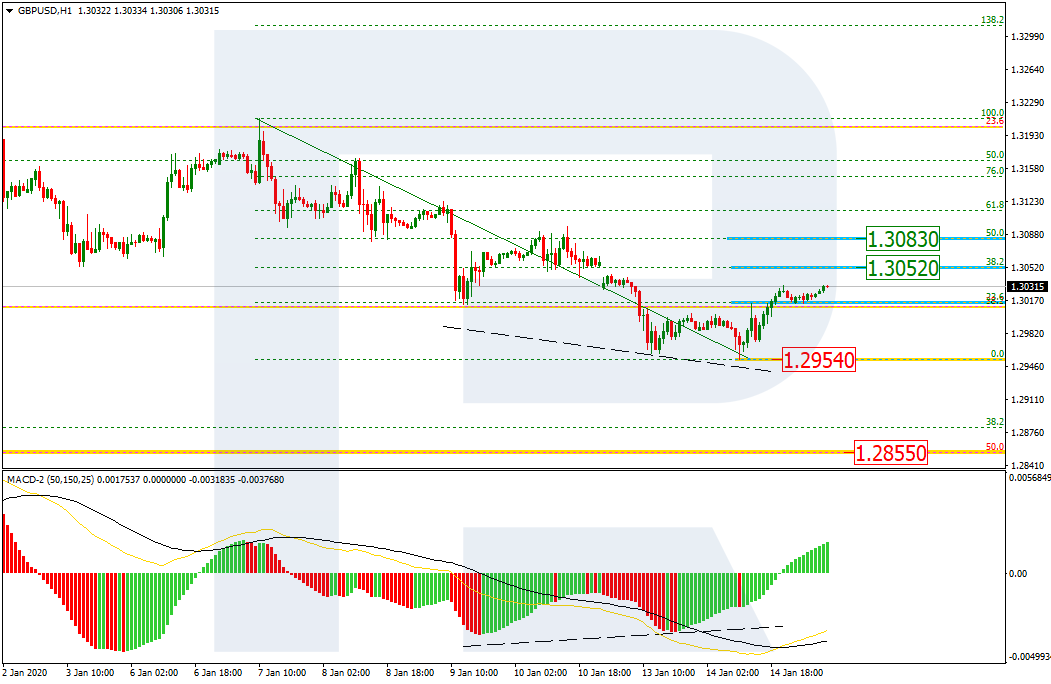
The H1 chart shows the convergence on MACD. As a result, right now the pair is starting a new short-term ascending correction towards 23.6% fibo. The next upside targets may be 38.2% and 50.0% fibo at 1.3052 and 1.3083 respectively.
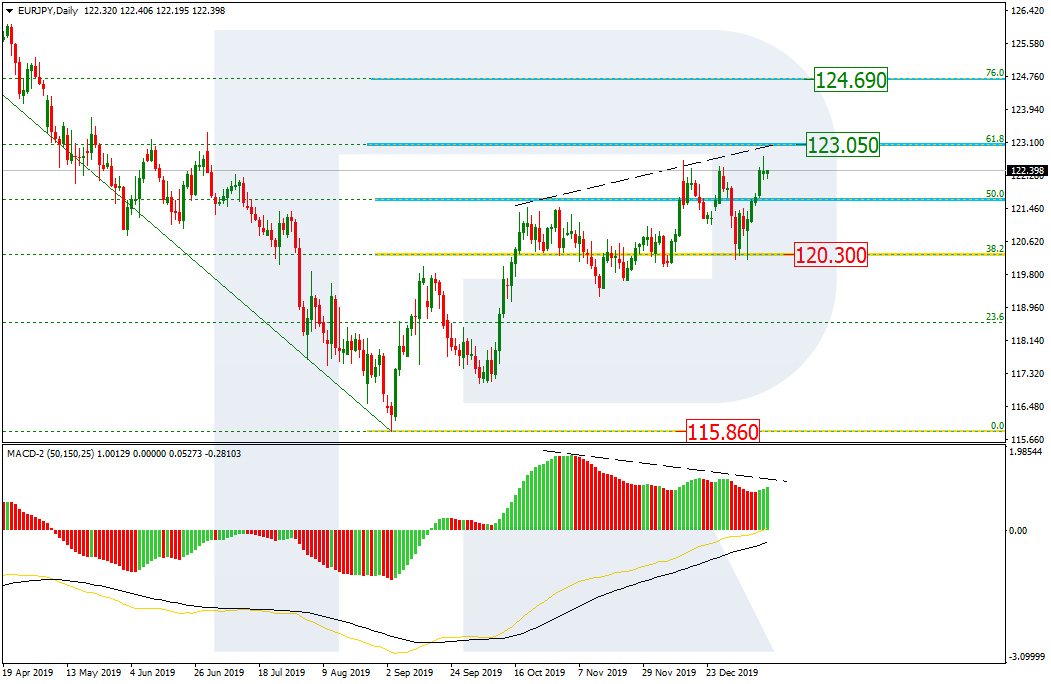
EURJPY, “Euro vs. Japanese Yen”
In the daily chart, after testing the support at 38.2% fibo and failing to fix there, EURJPY has updated the high. In the future, the instrument may continue trading upwards to reach 61.8% and 76.0% fibo at 123.05 and 124.69 respectively.
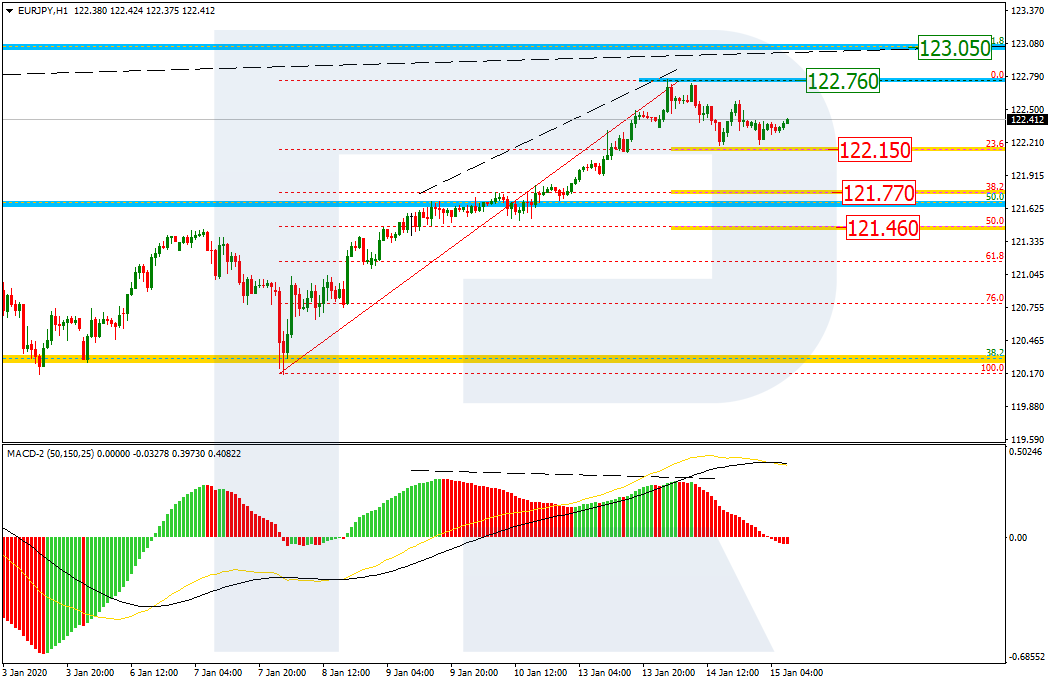
The H1 chart shows that the divergence made the pair start a new correction to the downside. The targets may be 23.6%, 38.2%, and 50.0% fibo at 122.15, 121.77, and 121.46 respectively. If the price breaks the resistance at 122.76, the mid-term growth will continue.
Attention! Forecasts presented in this section only reflect the author’s private opinion and should not be considered as guidance for trading. RoboForex LP bears no responsibility for trading results based on trading recommendations described in these analytical reviews.
By TheTechnicalTraders.com– This, the second part of our Silver research article suggesting Silver may be forming a massive price base in preparation for an explosive upside move, will continue from Part I of this research series.
Our research team believes Silver is setting up in a price pattern that may already be “ripe” for an explosive upside move. Our researchers have poured over the data and believe the disparity between Gold and Silver is already at excessive levels.
Historically, anytime the disparity between Gold prices and Silver prices (rationalized into comparative Gold price levels) breaches 30% to 60% and Gold begins an upside price advance, Silver typically begins to move higher with 4 to 8+ months. This setup pushes the Gold to Silver ratio back below 50 or 60 as Silver rallies substantially higher, and faster than the price of Gold.
Comparatively, Silver continues to trade within a sideways price range after basing in early 2016. This price range has been fairly consistent between $14.50 and $21.0. With Gold recently starting to move higher because of the US/Iran military conflict, this raises an early warning flag for our research team because Silver has continued to trade below $18 – and well below recent highs near $20.
The price disparity between Gold and Silver is currently greater than 200% based on our proprietary modeling system. Remember, anytime this disparity level is greater than 30% to 60% and Gold breaks out in a rally, Silver will break to the upside within just a few months.
The second stage rally in Silver, the real money-maker, will come when investors pile into Silver and Silver Miners as the breakout in Silver becomes explosive. The time to get into this trade is/was now or 4 months ago. Still, there is plenty of opportunity for skilled traders right now because the breakout move in Silver and Silver Miners has not really begun yet.
The first big upside move in Silver and Miners will be to attempt to move higher and target recent resistance. Resistance in Silver is currently near $19.70 and $21.00. This means any move above $19.75 (or higher) where the price of Silver fails to move above $22 or $23 would constitute a “Stage 1 Base Advancement”.
After this move is complete, a “Breakout Stage” price move will take place. This may be where Silver prices advance from the $21 to $23 level up towards the $28 to $32 price level. This upside price advance breaches the Stage 1 resistance and attempts to establish new support for a continued Stage 2 advance.
Remember, the current disparity level is just over 200% between Gold and Silver. If Gold continues to rally higher and Silver attempts to break higher, attempting to narrow the disparity level, then Silver will (at some point) enter a near parabolic upside price move above $36 to $40. Our researchers believe this may happen before June or July 2020.
This incredible opportunity is currently setting up for skilled traders. Believe it or not, while Silver continues to trade below $18 per ounce and global investors are focusing on US stocks, Emerging Markets, and Gold, Palladium and others, this setup in Silver may become the biggest investment opportunity of 2020. Sure, Gold may rally 80% to 140% over the next 12 to 24 months. Palladium may rally even higher. If Silver does what we expect it to do once this setup/trigger really breaks open, Silver could rally 500%+ over 12 to 24+ months on an incredible upside disparity reversion move.
This last chart highlights why we believe this setup in Silver should not be ignored. In 2005, the rally in Silver as a result of this Disparity trigger resulted in Silver reaching a 38% higher peak than Gold. In 2009, the same Disparity trigger prompted Silver to rally to levels nearly 300% higher than the peak in Gold prices. If Gold rallies to levels above $2800 to $3100, which is our expectation, and this Disparity trigger prompts an upside move in Silver, we believe Silver could rally to levels 200% to 400% (or more) higher than Gold prices. By our estimates, that would put Silver prices above $90 to $95 per ounce – possibly much higher.
Take advantage of any opportunity you have to position your portfolio for this setup and be patient. The upside breakout in Silver happens like a train leaving the station. Slow and steady at first, then building momentum, then finally running at top speed. Each time this Disparity trigger sets up and executes, Silver starts a moderate move higher at first, then explodes to the upside as Gold continues to rally higher. That last explosive move is why Silver reaches peaks that are substantially higher (in percentage terms) than the peaks in Gold.
Please pay attention to our research team’s efforts to help you create greater success and find great trades. Take a minute to visit Technical Traders Ltd. to learn how we can assist you in 2020 and help you build wealth, attain greater success and stay ahead of these bigger market moves.
As a technical analysis and trader since 1997 I have been through a few bull/bear market cycles, I have a good pulse on the market and timing key turning points for both short-term swing trading and long-term investment capital. The opportunities are massive/life-changing if handled properly.
Join my Wealth Building Newsletter if you like what you read here and ride my coattails as I navigate these financial markets and build wealth while others lose nearly everything they own.
NOTICE: Our free research does not constitute a trade recommendation, or solicitation for our readers to take any action regarding this research. It is provided for educational purposes only. Our research team produces these research articles to share information with our followers/readers in an effort to try to keep you well informed. Visit our web site (www.thetechnicaltraders.com) to learn how to take advantage of our members-only research and trading signals.
During yesterday’s trading session, the US dollar remained unchanged relative to the basket of major currencies. The dollar index (#DX) closed yesterday in the green zone (+0.04%). Investors have taken a wait-and-see attitude before concluding a deal between the US and China. According to media reports, the US duties on Chinese goods are likely to stay unchanged until the US presidential election. Their reduction or cancellation will depend on Beijing complying with the terms of the phase-one trade deal. US President Donald Trump and China’s Vice Premier Liu He, who is in Washington, are planning to sign the phase-one deal of the settlement of the trade dispute between the two countries today. 10 months after the signing of the agreement, the United States will study the progress made by China and may consider reducing or cancelling duties.
The British pound strengthened after statements by Prime Minister Boris Johnson. The official said that before the end of the year Britain is likely to conclude a comprehensive trade deal with the EU.
The “black gold” prices are declining. Currently, futures for the WTI crude oil are testing the $58.10 mark per barrel. At 17:30 (GMT+2:00), US crude oil inventories will be published.
Market Indicators
Yesterday, there was a variety of trends in the US stock market: #SPY (-0.15%), #DIA (+0.07%), #QQQ (-0.39%).
The 10-year US government bonds yield has declined. At the moment, the indicator is at the level of 1.79-1.80%.
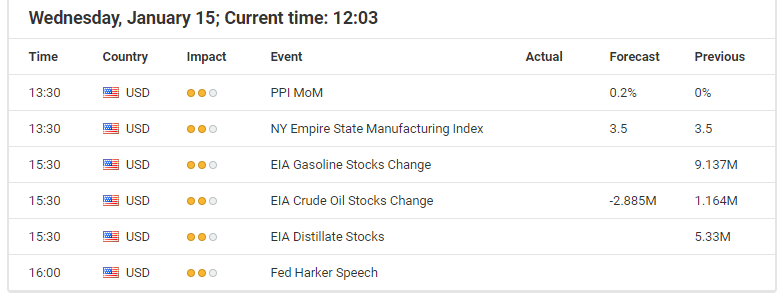
The Economic News Feed for 15.01.2020:
– Consumer price index in the UK at 11:30 (GMT+2:00);
– Producer price index in the US at 15:30 (GMT+2:00);
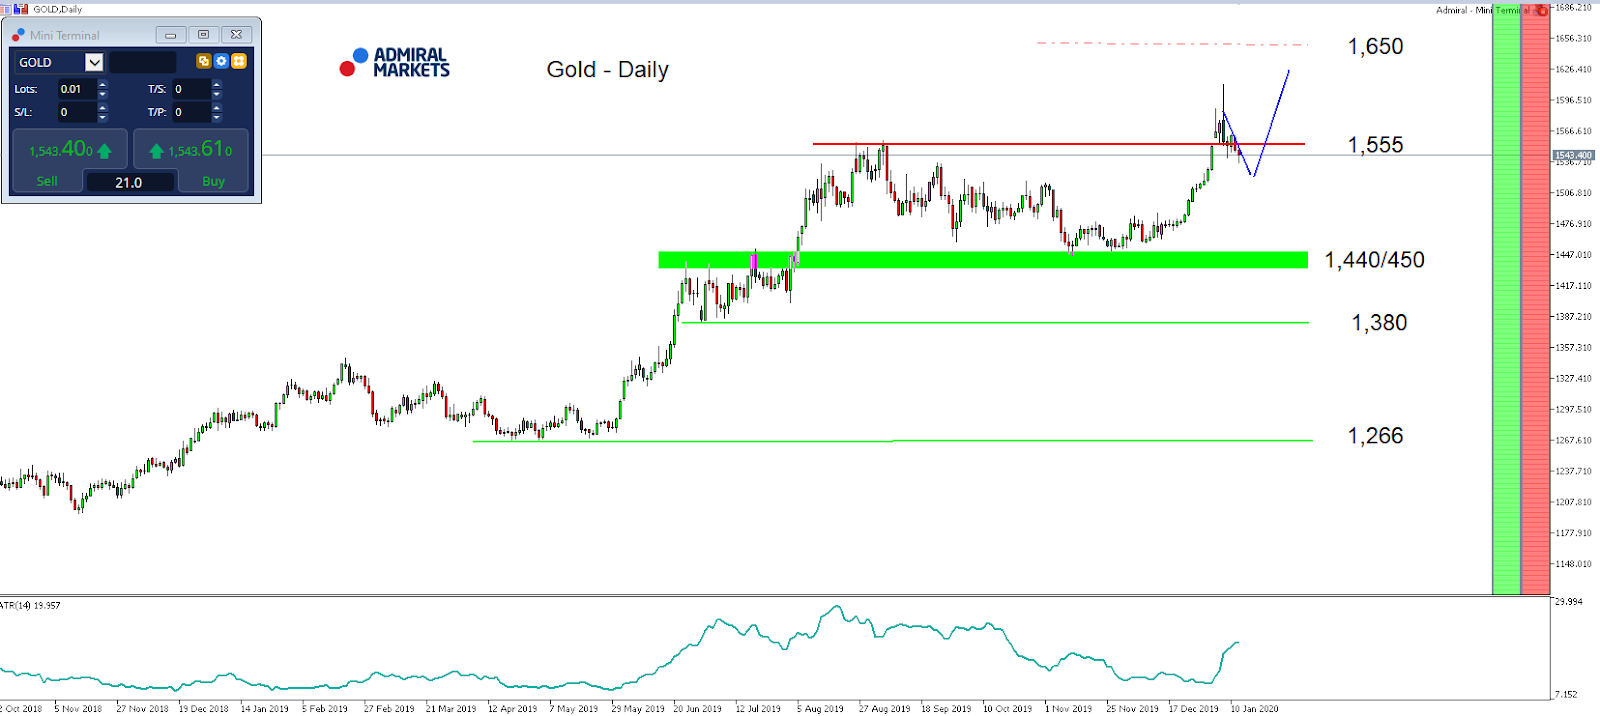
Driven by the latest developments in the Middle East, Gold initially profited from the resulting risk-off mode, seeing a short-term push above 1,600 USD, which stabilised after no further escalation took place and US president Trump de-escalating the situation last week on Wednesday at his press conference.
While the precious metal is currently stable around its 2019 yearly highs of 1,550 USD, and a deeper corrective move down to 1,520 being an option, the overall picture for Gold stays positive.
Technically, on a daily time-frame Gold stays bullish as long as we trade above 1,440/450 USD, but also fundamentally the picture stays Gold positive.
This is especially true after the mixed US economic data over the last week, with yesterday’s US inflation coming in at 2.3% year-on-year in December 2019 at the highest level since October 2018 and with 10-year US-Treasury yields stabilising below 2%.
If tomorrow’s US Retail Sales disappoints as well, and comes in below expectations, Gold could take on bullish momentum again and make itself on the way up to the potential next target on the upside around 1,650/700 USD:
Source: Admiral Markets MT5 with MT5-SE Add-on Gold Daily chart (between October 12, 2018, to January 14, 2020). Accessed: January 14, 2020, at 10:00pm GMT – Please note: Past performance is not a reliable indicator of future results, or future performance.
In 2015, the value of Gold fell by 10.4%, in 2016, it increased by 8.1%, in 2017, it increased by 13.1%, in 2018, it fell by 1.6%, in 2019, it increased by 18.9%, meaning that after five years, it was up by 28%.
Discover the world’s #1 multi-asset platform
Admiral Markets offers professional traders the ability to trade with a custom, upgraded version of MetaTrader 5, allowing you to experience trading at a significantly higher, more rewarding level. Experience benefits such as the addition of the Market Heat Map, so you can compare various currency pairs to see which ones might be lucrative investments, access real-time trading data, and so much more. Click the banner below to start your FREE download of MT5 Supreme Edition!
Disclaimer: The given data provides additional information regarding all analysis, estimates, prognosis, forecasts or other similar assessments or information (hereinafter “Analysis”) published on the website of Admiral Markets. Before making any investment decisions please pay close attention to the following:
This is a marketing communication. The analysis is published for informative purposes only and are in no way to be construed as investment advice or recommendation. It has not been prepared in accordance with legal requirements designed to promote the independence of investment research, and that it is not subject to any prohibition on dealing ahead of the dissemination of investment research.
Any investment decision is made by each client alone whereas Admiral Markets shall not be responsible for any loss or damage arising from any such decision, whether or not based on the Analysis.
Each of the Analysis is prepared by an independent analyst (Jens Klatt, Professional Trader and Analyst, hereinafter “Author”) based on the Author’s personal estimations.
To ensure that the interests of the clients would be protected and objectivity of the Analysis would not be damaged Admiral Markets has established relevant internal procedures for prevention and management of conflicts of interest.
Whilst every reasonable effort is taken to ensure that all sources of the Analysis are reliable and that all information is presented, as much as possible, in an understandable, timely, precise and complete manner, Admiral Markets does not guarantee the accuracy or completeness of any information contained within the Analysis. The presented figures refer that refer to any past performance is not a reliable indicator of future results.
The contents of the Analysis should not be construed as an express or implied promise, guarantee or implication by Admiral Markets that the client shall profit from the strategies therein or that losses in connection therewith may or shall be limited.
Any kind of previous or modeled performance of financial instruments indicated within the Publication should not be construed as an express or implied promise, guarantee or implication by Admiral Markets for any future performance. The value of the financial instrument may both increase and decrease and the preservation of the asset value is not guaranteed.
The projections included in the Analysis may be subject to additional fees, taxes or other charges, depending on the subject of the Publication. The price list applicable to the services provided by Admiral Markets is publicly available from the website of Admiral Markets.
Leveraged products (including contracts for difference) are speculative in nature and may result in losses or profit. Before you start trading, you should make sure that you understand all the risks.
On Tuesday, January 14, the euro finished up slightly down at the end of the day’s trading. After the publication data concerning the inflation rate in the United States, the EURUSD pair fell to 1.1105.
In December, the Consumer Price Index (CPI) in the United States rose 0.2% (MoM) and 2.3% (YoY). The forecast was 0.2% (MoM) and 2.4% (YoY,) and the previous recorded values were 0.3% (MoM) and 2.1% (YoY). The annual growth of CPI fell short of forecasted figures, but exceeded the previous results with CPI at its highest since October 2018.
However, the reaction to the publication of the Index was short-lived, since market players have their eyes firmly fixed on the long-awaited signing of the first part of the US-China trade agreement.
Today’s events (GMT+3):
12:30 UK: Consumer Price Index (MoM) (Dec), Retail Price Index (MoM) (Dec), PPI Core Output (YoY) n.s.a (Dec), Core Consumer Price Index (YoY) (Dec), Producer Price Index – Output (MoM) n.s.a (Dec).
16:30 USA: NY Empire State Manufacturing Index (Jan), Producer Price Index ex Food & Energy (YoY) (Dec).
18:30 USA: EIA Crude Oil Stocks Change (Jan 10).
22:00 USA: Fed’s Beige Book.
Current situation:
For the past two days in-a-row, forecasts have been strongly influenced by the regular influx of important market and political news. The current corrective wave pattern is complex. Yesterday, a false breakout of the trend line was recorded. Today, bulls again broke the trend line (which sits at 1.1134). A breakout is highly unlikely to occur today, since at 19:00 Moscow time, representatives of the United States and China intend to hold an official ceremony where the first part of the trade agreement between the countries shall be signed. This is an important event for traders, but has already been taken into account, according to market activity.
US Treasury Secretary Steven Mnuchin said that current customs tariffs on Chinese goods will remain in effect until an agreement is reached regarding the second part of the trade agreement. We are yet to understand all of the details, but it seems that China could well be in a losing situation here.
It’s also worth mentioning that as part of the first stage of the trade deal, China has pledged to buy additional industrial goods from the United States totalling $80 billion (USD) over the next two years, and more than $50 billion (USD) worth of energy products.
Today, the official responses from the USA and China – once their agreement has been signed – will be of great interest. We could well see an ambiguous reaction to their comments on the markets; however, we are more inclined to predict a strengthening euro. The single currency could well reach 1.1164 (67th degree).
By Orbex – Trading gold on MetaTrader 4 is pretty easy, in terms of the practical procedure of entering and exiting the market.
It’s virtually identical to trading currencies, which is why a substantial amount of Forex traders also trade/invest in gold from the comfort of their trading platform.
There are details that vary from broker to broker, such as margin levels. Some FX brokers have different margin requirements for precious metals, for example.
However, the basics of operating MT4 when trading gold are pretty much the same. Mind you, this is about how to open and close trades. Developing a trading strategy for gold is an entirely different (and much broader) subject!
Options Available on the Platform
Most Forex brokers offer two types of gold that you can trade: exchange and spot.
What’s the difference? In terms of price and how you trade, not much. But they do imply some differences in your strategy. They are:
Spot (usually under the symbol GOLD), refers to the spot price of the metal on the commodity exchange. It’s quoted in dollars, and often the price people mean when they are talking about the price of gold
Exchange refers to a “cross” between gold and a currency, as if it were a currency pair. For example, XAU – the symbol for gold – quoted in euros (EUR) would be XAUEUR on your MT4 platform.
Note that the spot price of gold and XAUUSD is basically the same thing, and your platform might have either GOLD or XAUUSD.
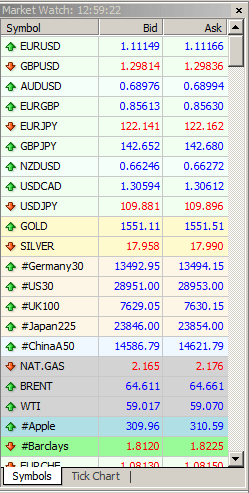
Where is it?
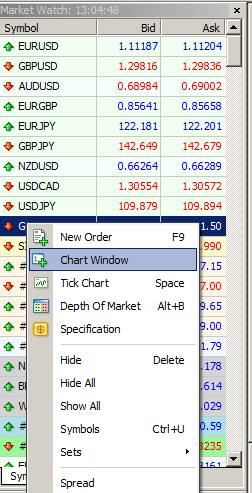
On the left hand of your MT4 screen, you should have a panel called “Market Watch” which lists all the instruments your Forex broker offers. In this example, in the middle, you can see the GOLD:
Sometimes not all the instruments available are listed, just the “most frequent”, and you might not see gold listed.
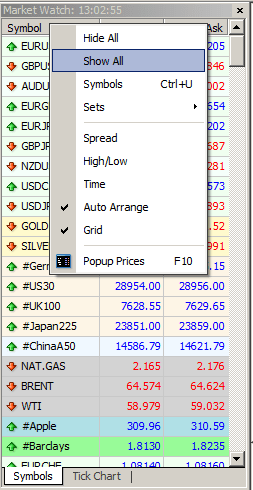
In order to see all of the options on the platform, you want to right-click on the top where it says “symbol” and then “show all” in the menu that appears like this:
You can then scroll down until you find the version of gold you are looking for. Once you do, you’re going to want to open a chart, which you do by right-clicking on the instrument (GOLD, XAUUSD, depending on the listing), and select “open chart window” like so:
You can customize your chart just like you would with any currency pair, with the FX indicators you like, and other tools for technical analysis you might want to use.
Opening a Trade
Once you’ve done all the analysis you need to decide to enter the market, there are a couple of ways that you can trade on MT4. Note that these are all the same for currency trading.
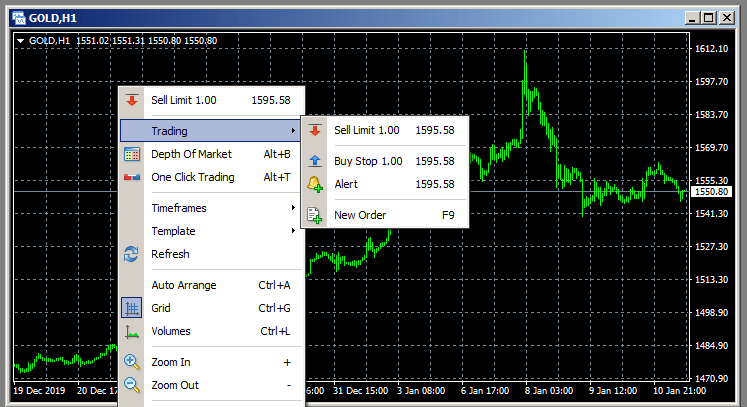
The first is by right-clicking on the chart itself, and from the menu that appears, select “trading” and from there “New order”:
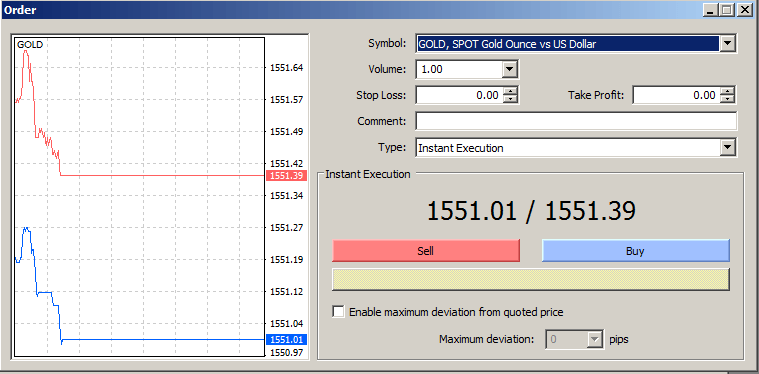
Alternatively, when you have the chart window you want to trade in open, you can press the F9 key on your keyboard, which will open up the trade panel:
Here you can choose the trade volume, set stop loss and take profit levels, whether you want to trade immediately or set a trade order for when the market reaches a certain level, etc.
After that, just click “sell” or “buy” depending on what your signal is telling you.
Bottom line, as you can see, trading gold on MT4 is just as easy as trading any currency pair you might already be used to.
GBP has been back under selling pressure again this week as the latest data highlight further economic weakness.
Monthly GDP figures released yesterday showed the UK economy shrank by 0.3% in December. This was far worse than the expected 0% reading the market was looking for.
On an annual basis, the economy grew just 0.6%, marking its slowest pace of growth since 2012. Alongside this, manufacturing production came in at -1.7% over the month, versus an expected decline of -0.3%.
Carney Warns of Rate Cut Risk
The data comes just days after BOE Governor Mark Carney took traders by surprise as he warned that the BOE might be forced to cut rates, despite the UK PM agreeing on a Brexit deal.
Carney had previously said that the BOE projected that the UK economy would rebound firmly over 2020 as businesses and consumers reacted to the removal of uncertainty around Brexit.
However, speaking last week, Carney warned that such a pickup might not materialize. And, given the subdued growth seen in the economy, easing could be necessary.
January Easing Looks Likely
In terms of the timing of this easing, with Carney due to hand the BOE governorship over to Andrew Bailey in March, it looks increasingly likely that Carney could ease before then.
As such, there is now a heightened risk of a BOE rate cut at the upcoming January meeting. This would be ahead of the January 31st Brexit date, as leaving it until Bailey has taken over might be a little too long.
Some Hope For UK Economy?
It is worth noting that the GDP data refers to the final period ahead of the UK general election last month. Since then, there are some signs that the pickup is starting to take place.
The recent Services PMI reading came in at its highest level since 2018 last month. However, it was still only back at the 50 level. Looking ahead, there are fears that Johnson’s refusal to extend the UK/EU trade negotiations deadline of December 31st could fuel further uncertainty among businesses.
Johnson Under Pressure over Deal Deadline
Many names from across the political divide have expressed their view that eleven months is not long enough to agree on a trade deal.
This week, Conservative party grandee Peter Bottomley, Father of the House of Lords, warned that failure to agree on a trade deal with the EU could cause an economic contraction by as much as 10%.
Traders will be keeping an eye on the progress of talks going forward as well as for any signs that Johnson might shift his view on extending the deadline date if a deal does not look achievable in the current timeframe.
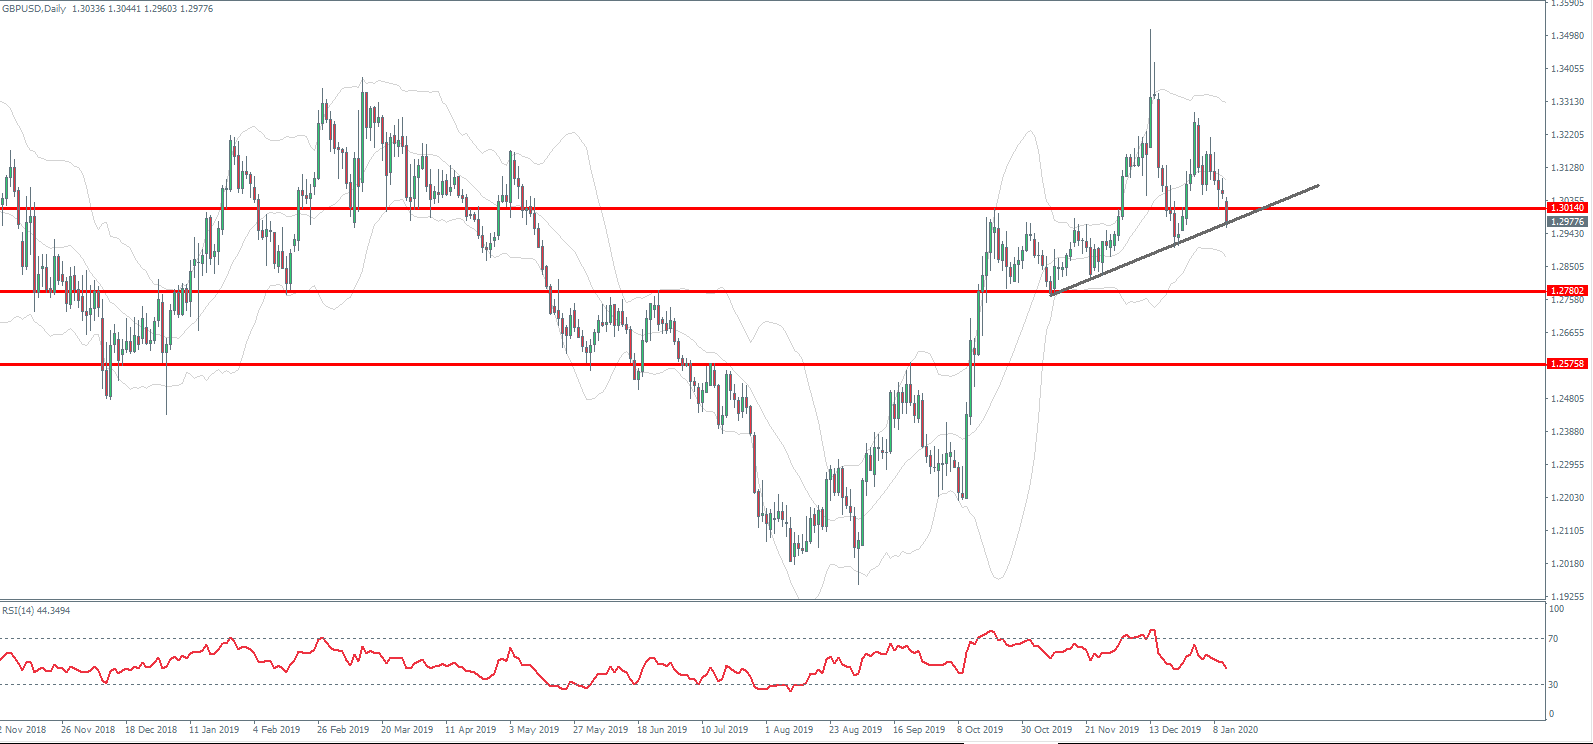
Technical Perspective
The reversal lower in GBPUSD looks close to confirming a lower high against the 1.35 post-elections high. Price has broken back below the 1.3014 level and is now challenging the local bullish trend line. A break here would put the focus on a move back down to the 1.2780 level next. Looking further out, price could trade down as low as the 1.2578 level which could be a potential right shoulder of a large, longer-term inverse head and shoulders pattern.
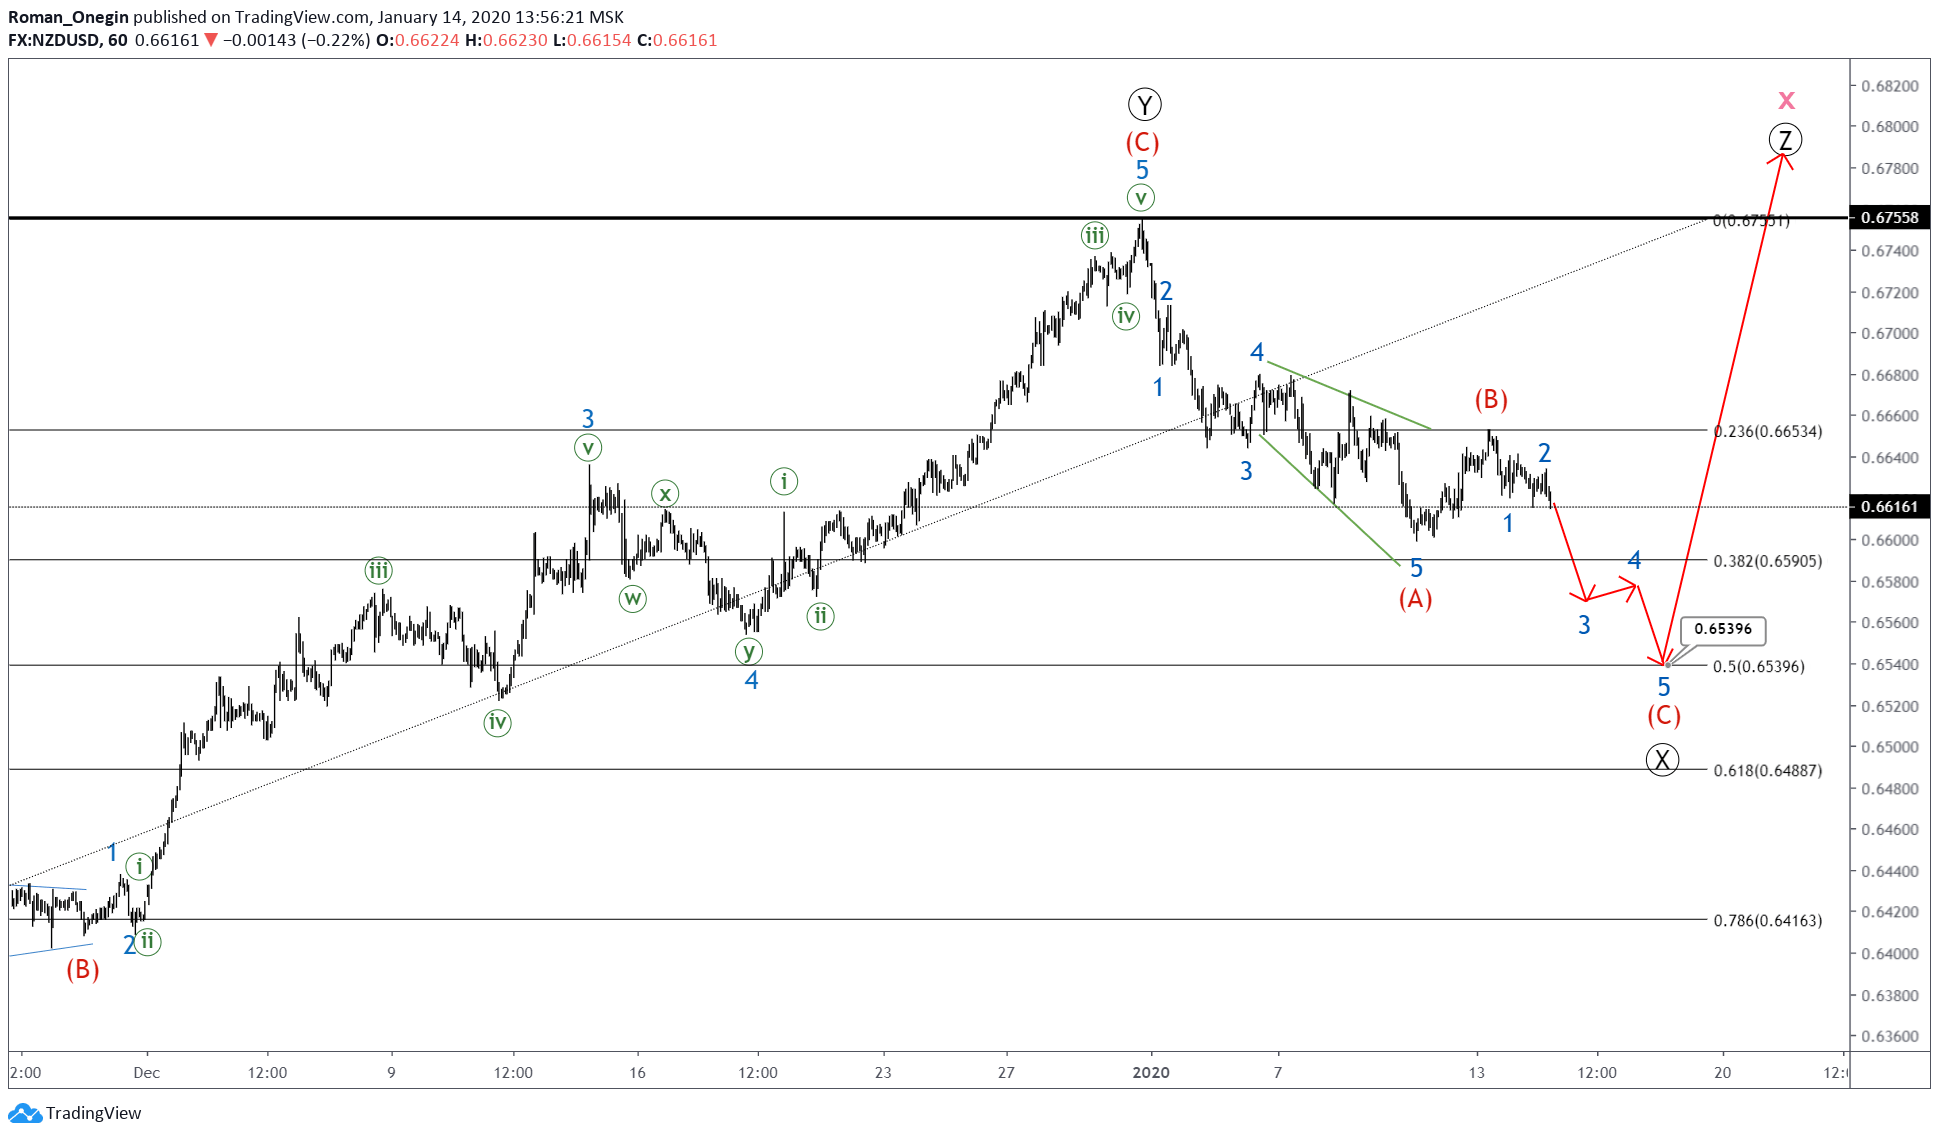
By Orbex – The current NZDUSD structure hints to a bullish combination consisting of primary sub-waves Ⓦ-Ⓧ-Ⓨ-Ⓧ-Ⓩ.
Wave Ⓨ looks fully completed, whereas Ⓧ is still under construction. That could be followed by wave Ⓩ.
The aforementioned scenario sees wave Ⓧ consisting of intermediate degree sub-waves (W)-(X)-(Y)-(X)-(Z).
If this pattern turns out to be validated, we could see a slight decline in the minor zigzag A-B-C near the 0.659 area. That level will be 38.2% retracement of the first intervening wave Ⓧ.
The closest alternative sees the current intervening wave Ⓧ as a standard zigzag, consisting of intermediate waves (A)-(B)-(C).
This scenario would have prices sliding lower in a bearish 5-wave impulse (C) near the 0.653 area. The target would respect the 50% Fibonacci retracement when comparing sub-waves Ⓧ and Ⓨ.
Risk sentiment was in check on Monday as investors stay on the sidelines for global cues.
The US earnings report for the fourth quarter of 2019 is underway. Meanwhile, Washington announced that it will remove China’s label as a currency manipulator.
Investors see this as another positive move towards improving trade relations between the two economies.
EUR Gains on Weaker USD Despite Weaker German WPI
The German wholesale price index was flat for December. This pushed the WPI on a year over year basis to -0.1%. Besides the WPI data, economic data from the eurozone was sparse. The euro, however, brushed aside the data largely due to the weakness in the US dollar.
EURUSD Seen Retesting Resistance Level
The common currency was retesting the resistance level of 1.1131 level amid a quiet day from the eurozone. The consolidation that is taking place near the confluence of the trend line and the horizontal level indicates a possible breakout. The bias remains to the upside with the target of 1.1177.
Pound Falls on Carney’s Comments on Rate Cut
The British pound fell sharply on Monday following weak GDP data. For the month of December, the UK’s gross domestic product fell 0.3%.
The report sparked comments by BoE Governor Mark Carney who said that the next move by the BoE will be a rate cut. Investors are pricing in the possibility of a rate cut as early as the January monetary policy meeting.
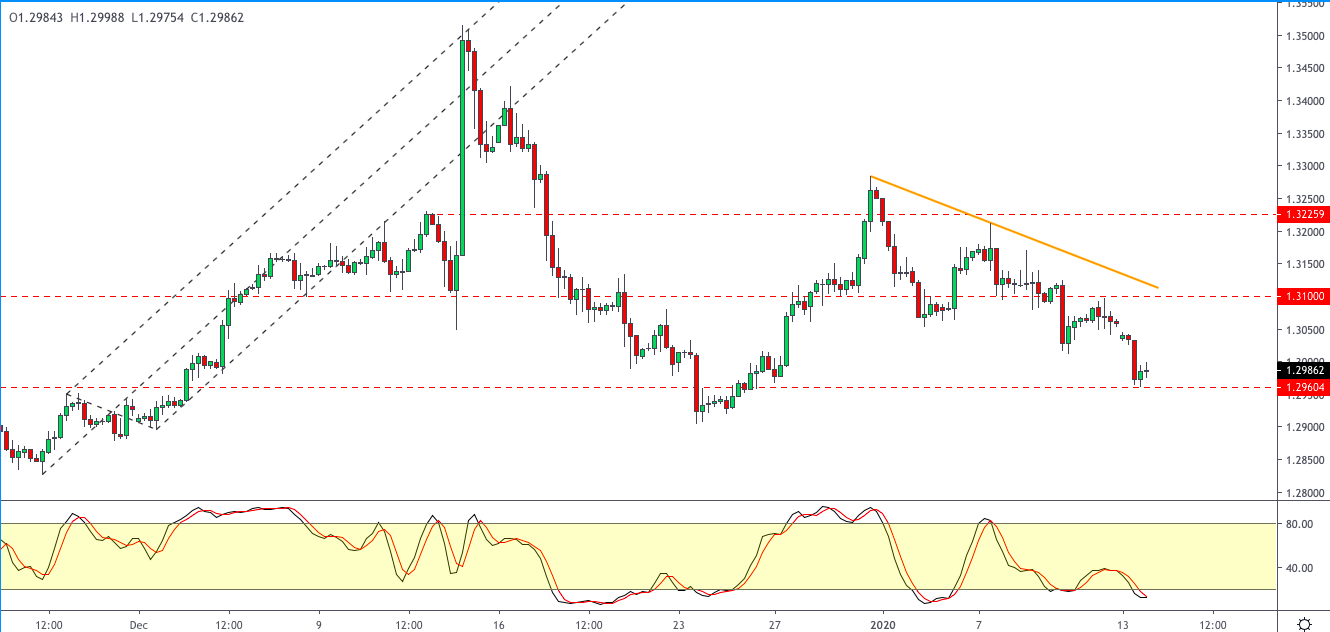
GBPUSD Slips to Lower Support
GBPUSD fell briefly to the 1.2960 level of support. This confirms the downside target of the descending triangle pattern. However, we expect a firm retest of the support level. There is a possibility that a rebound could see GBPUSD testing 1.3100 resistance.
Gold Prices Remain Flat as Investors Await Further Cues
The precious metal was trading weaker on Monday. Investors are waiting for further clues on the developments of the trade deal. The China GDP report and the US inflation and retail sales report will be the big-ticket items that will move markets over the week.
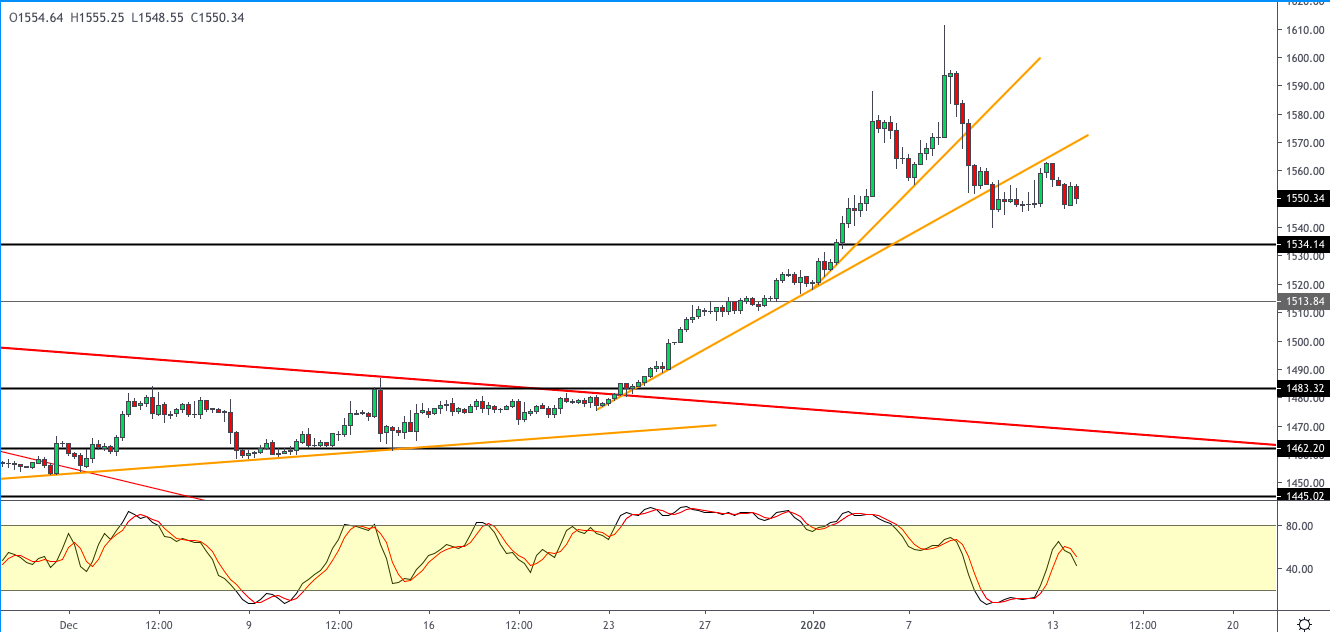
XAUUSD Downside is Increasing
The current price action is consolidating near the current levels amid the lower high forming. Price action is trading slightly above the minor support of the 1546 level. A breakdown below this level will accelerate the decline to the 1534 level of support.
As we can see in the H4 chart, the descending tendency continues. By now, the pair has finished several reversal patterns, including Engulfing, near the channel’s upside border. The current situation implies that USDCAD may fall to reach 1.2960 and continue forming the descending channel. However, we shouldn’t ignore an alternative scenario, according to which the instrument may grow to return to 1.3110.
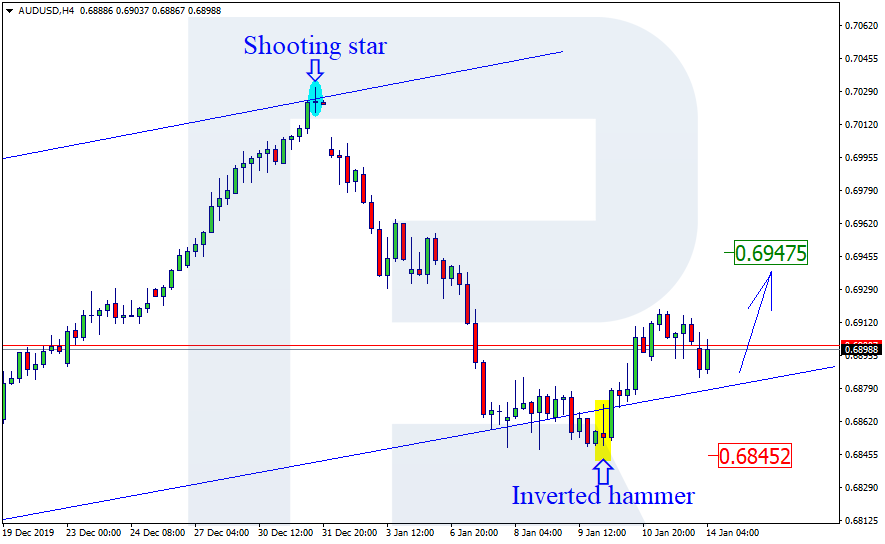
AUDUSD, “Australian Dollar vs US Dollar”
As we can see in the H4 chart, the pair has corrected withing the ascending tendency: it has formed several reversal patterns, including Inverted Hammer, close to the channel’s downside border. Right now, AUDUSD is starting to reverse; the upside target may be at 0.6947. However, we shouldn’t ignore an alternative scenario, which implies that the instrument may continue falling towards 0.6845.
Attention! Forecasts presented in this section only reflect the author’s private opinion and should not be considered as guidance for trading. RoboForex LP bears no responsibility for trading results based on trading recommendations described in these analytical reviews.