FED, Took No Decision Today

Article by Investazor.com

Ben Bernanke had a very clean speech, emphasizing all the possible scenarios and the correspondent solutions. He didn’t said that the QE3 is going to be ended at a certain point for sure but neither he said that QE3 will continue for an undetermined period. The key factors of this equation are the signals of the American economy, especially the labor market and inflation. Lately, the U.S. enjoyed positive results and the rising star that lead to such positive news is the housing market.

As for the rest of the year, “a highly accommodative monetary policy will remain appropriate for the foreseeable future”. At a certain point, trying to soften the effects of its last speaking, Ben Bernanke gave the impression that the indulgent measures are of need so the QE3 program and the “forward guidance” represent the main 2 tools which need important reasons before being removed (key levels are expected in the labor market <<6.5%>> and inflation <<near the 2% target>>).

In order to properly end his speaking, Ben Bernanke wanted to notify that “the Committee would be prepared to employ all of its tools, including an increase in the pace of purchases for a time, to promote a return to maximum employment in a context of price stability.”

If we are to compare the pro QE3 attitude of Ben Bernanke today and the contra QE3 ideas that yesterday Esther George transmitted as a representant of half of the FOMC members, which would be the most probable scenario? We wait the tomorrow’s report where the chairman of Fed is expected to take a more clear position.

The post FED, Took No Decision Today appeared first on investazor.com.

USD or JPY what would Investor choose?

Article by Investazor.com

usd-or-jpy-which-investors-will-choose-17.07.2013

Chart: USDJPY, H4

From the top of this year, hit in May, the US dollar lost about 9.5%. It managed to recover about 78% of this fall after Federal Reserve announced that it will start tapering the QE program this year and stop it in 2014.

Yen is becoming a week currency because of the monetary easing started by BoJ. The program already shows an improvement in Japan’s economy so the Central Bank will maintain it a current values until the end of the year. They are targeting deflation and the devaluation of the currency, in their opinion, is just the effect.

During the past 7 days USDJPY has consolidated in a symmetrical triangle right under the 78.6 retrace of the latest impulse of the main uptrend. This means that investors are not yet convinced in which currency to invest. While they are waiting for further signals from the Central Banks, we can look for technical signals to understand in which they will invest next.

If the price will break the upper line and close on a 240 minutes time frame above it could trigger a new rally for the US dollar and target the 102.00 price. On the other hand, if the price will close under the lower line we might witness a drop to 96.70 (the 61.8 Fibonacci retrace of the uptrend).

The post USD or JPY what would Investor choose? appeared first on investazor.com.

Is Canada’s Oil Charm Offensive Yesterday’s News?

By OilPrice.com

Canadian oil production is expected to be in a boom cycle for the next 20 years or so, fed largely by oil sands production in Alberta. Smaller players in the vast oil sands region are already making a splash with new operations while majors like TransCanada and Enbridge are quickly getting back to work following last month’s flooding. Canadian Prime Minister Stephen Harper said parts of Quebec look like a “war zone” following last weekend’s train wreck. With a fight on his hands to counter the dirty oil narrative, his administration, and those invested in the energy sector, may face more combat in the future if the oil sands engine runs out of track.

The Canadian Association of Petroleum Producers expects national oil production to hit 6.7 million barrels per day by 2030, more than double the production level from last year. North American oil production is so strong that it’s too much for existing pipeline capacity to handle. Canadian energy company Enbridge just got its pipeline services back on stream following devastating floods in oil-rich Alberta. It aims to build the mega Northern Gateway pipeline to British Columbia for energy-hungry Asian markets. On the other side of the country, Harper was forced to deal with the “war zone” left over when an oil train derailed in a Quebec town near Maine, refueling the oil debate on both sides of the border.

CAPP said oil production from Alberta is expected to make up about 75 percent of the production gains through 2030. While no secret to those in the industry, oil sands production has been in the public’s eye for the past few years because of the debate surrounding TransCanada’s planned Keystone XL pipeline from Alberta through the United States. In the shadow of giants like Enbridge and TransCanada are juniors like Aroway Energy, which said Wednesday it got the nod from the Alberta Energy Regulator to increase production from its Kirkpatrick Lake operations in the province. CEO Chris Cooper said the approval “could not have come at a better time” because oil prices are at all-time highs for the year. The boom from Alberta is such that even OPEC stood up and took notice in reporting this year.

Harper spent last month trying to woo European investors to the Canadian economy. European leaders are considering legislation that would put a black mark on Alberta’s oil sands because they’re seen as more polluting than other types of crude oil.  Canadian Natural Resources Minister Joe Oliver said the Harper administration didn’t want its “reputation sullied” over oil sands.

Aroway in February said it had almost doubled production from 600 to more than 1,000 barrels of oil equivalent per day in quick fashion thanks to Alberta oil sands. Rival majors like Talisman Energy, however, are slashing their spending already because of higher operating costs. The U.S. oil boom in states like Texas and North Dakota, meanwhile, may leave Canadian companies in the dust. Harper, for his part, was in enemy territory in a European community already debating how it can outdo renewable energy goals it hasn’t even met yet. The mid-term outlook for even marginal players in Canadian oil sands, like Aroway, looks optimistic. The energy tides may be shifting, however, suggesting that while production may gain steam, Canada’s heavy reliance on heavy crude may run off the rail.

By. Daniel J. Graeber of Oilprice.com

Source: http://oilprice.com/Energy/Crude-Oil/Is-Canadas-Oil-Charm-Offensive-Yesterdays-News.html


Unequivocal Proof That the Housing Uptrend Has Staying Power

By WallStreetDaily.com

One aspect of the housing market recovery that no one can quite agree on is its staying power.

In fact, some pundits believe the burst of this so-called Housing Bubble of 2013 is imminent. It makes for great headlines and head-turns, but not much sense.

For proof, let’s go back in history to August 2006, when homeowners basked in the glory of a 132% rise in home prices over an 11-year span – and, oddly enough, every Tom, Dick and Harriet could afford and qualify to buy at these pie-in-the-sky prices.

The Housing Bubble: Then and Now

Financial institutions – and the government – took turns playing “Let’s Make a Deal.” (Behind the curtain: No money down! Under the box: 0% interest for five years! In the sealed envelope: Bad credit? No income? No problem!)

To add to the insanity, the Fed lowered rates 11 times, from 6.5% to 1.75%, between 2001 and 2004. This was to ensure the American Dream stayed alive and well. But it wasn’t long before the nightmare on Wall Street (and every street in the country) played out.

You know all the gory details… By the first quarter of 2009, home prices had fallen by more than 32% from their 2006 peak, and they continued to slide (until now).

Everything is different this time around, though…

  • Inventories today are at record lows, due in part to fewer foreclosures and homeowners stuck with little or no equity in their homes. Yet back then, inventory was sky-high, and homeowners plowed through equity quicker than you could say “bankruptcy.”
  • Today, banks are Scrooge-like, demanding down payments exceeding 20% – even with squeaky clean credit. Back then, buyers often borrowed without any down payment, and banks were more than willing to accommodate them with introductory teaser rates… and dire consequences.
  • Today, the ratio of home prices to income is relatively low. At the end of 2012, house payments represented just 12.6% of monthly income. (Remember, in the pre-bubble period of 1985 to 1999, mortgages took 19.9% of homeowners’ monthly incomes.)

While CoreLogic estimates that home prices have increased 12.1% year-over-year, it’s not exactly fodder for celebration – or bubble labeling, for that matter. As Louis Basenese mentioned in this month’s issue of WSD Insider, “Higher prices alone… promise to help keep the bubble in check… [As this will] encourage more homeowners to list their properties.”

And even if Bernanke pulls the trigger on interest rates, he will move so slowly and cautiously that you may not even notice.

Three ETFs That Speak Volumes

In the end, the housing market is poised to continue its upward momentum unabated. And three ETFs in particular clearly illustrate the upward trend in housing.

The iShares Dow Jones U.S. Home Construction Fund (ITB) has a 62% exposure to the largest homebuilders in the market. The ETF boasts one-year returns of 33.7% and recently moved back above its 200-day moving average.

Then there’s the SPDR S&P Homebuilders ETF (XHB). XHB has less exposure to homebuilders than ITB and invests in companies like Bed Bath & Beyond and La-Z-Boy. XHB has shot up 38.6% in the past 12 months and 10.7% year-to-date. This one is trading north of both its long- and short-term moving averages.

And lastly we have the PowerShares KBW High Dividend Yield Financial (KBWD), which focuses on the financial sector and banks. I know, that dirty, “too big to fail” word again. No worries, though. These days, KBWD holds mostly REITs or other companies in the mortgage financing arena, like American Capital Agency (AGNC), BGC Partners (BGCP) and Annaly Capital Management (NLY). It boasts an 8.13% annual yield and 11.8% year-to-date gain. It, too, is trending above the 200- and 50-day moving averages.

Bottom line: Though housing stocks may ebb and flow in the coming months, it appears that the long-term trend will remain up. And those who took (or take) cover under presumably falling skies may learn this particular history lesson the hard way.

Good investing,

Karen Canella

The post Unequivocal Proof That the Housing Uptrend Has Staying Power appeared first on  | Wall Street Daily.

Article By WallStreetDaily.com

Original Article: Unequivocal Proof That the Housing Uptrend Has Staying Power

Chernobyl at Sea? Russia Building Floating Nuclear Power Plants

By OilPrice.com

So much for the lessons of Fukushima. Never mind oil spills, the Russian Federation is preparing an energy initiative that, if it has problems, will inject nuclear material into the maritime environment.

Speaking to reporters at the 6th International Naval Show in St. Petersburg, Baltiskii Zavod shipyard general director Aleksandr Voznesenskii said that the Russian Federation’s first floating nuclear power plant “should be operational by 2016.”

Baltiysky Zavod is Russia’s biggest shipbuilding complex. According to Voznesenskii, the “Academician Lomonosov” FNPP will be the first vessel belonging to the new line of floating nuclear power plants that can provide energy, heat and water to remote and arid areas of the country, with mass production scheduled for the near future.

The “Academician Lomonosov’s” technology is based on the USSR’s construction of nuclear-powered icebreakers. The Russian media is speculating that the FNPPS will first be used in remote areas of the northeastern Arctic Russia and the Far East, as these regions currently suffer from a lack of energy, slowing their development. Each 21,000 ton vessel will have two “modified KLT-40 naval propulsion reactors” that will provide up to 70 megawatts of electricity or 300 megawatts of heat, sufficient for a city with a population of 200,000 people. Additionally, the floating NPPs can provide water desalination services capable of supplying up to 240,000 cubic meters of fresh water per day.

Perhaps referring to Soviet-era nuclear icebreakers is not such a hot idea, at least for those with historical memories.

Launched in 1957, the Lenin, the USSR’s first nuclear powered icebreaker, was powered by three OK-150 reactors. In February 1965, there was a loss of coolant incident, and some of the fuel elements melted or deformed inside reactor number two. The debris was removed and stored for two years, and subsequently dumped in Tsivolki Bay near Novaia Zemlia two years later. The second accident was a cooling system leak, which occurred in 1967, shortly after refueling.
Not a reassuring development for the Soviet Arctic environment.

“Academician Lomonosov’s” keel was laid in April 2007 at the Sevmash shipyard in Severodvinsk on the White Sea, but the project was subsequently transferred to the Baltiskii Zavod. The “Academician Lomonosov’s” 21,500 ton hull was subsequently launched in 2010, although construction work was frozen in mid-2011because of bankruptcy proceedings against the shipyard. The company was subsequently acquired by state-owned United Shipbuilding Corporation and Rosenergoatom signed a new contract with the Baltiskii Zavod for the “Academician Lomonosov’s” completion. The “Academician Lomonosov” has 69 crew and specialists. Ominously, the “Academician Lomonosov” has no engines, so it needs to be towed. The vessel is equipped with two modified KLT-40 reactors.

But, not to worry.

The Baltiskii Zavod shipyard stressed that The “Academician Lomonosov” and its successors are all designed with a safety margin exceeding all possible threats which makes its nuclear reactors invulnerable to tsunamis and other natural disasters and the ships meet all the requirements of the International Atomic Energy Agency (IAEA) and do not pose a threat to the environment. The factory further states that 15 nations, including China, Indonesia, Malaysia, Algeria, Namibia and Argentina have already expressed interest in buying floating nuclear power plant.

The “Academician Lomonosov”will be sent to Vilyuchinsk, Kamchatka for operational testing. Rosatom then aims to construct seven more FNPPs by 2015, with four of them likely to be located on the northern coast of Siberia’s Yakutia. Other Arctic areas provisionally scheduled to receive FNPPs include port cities along the Russian Federation’s arctic coastal Northern Sea Route and Pevek in Chukotka. An added benefit of the FNPP as envisaged in Moscow is that the provision of nuclear power to the Arctic and Far East will free up more oil and natural gas for foreign export, allowing the Russian federation to generate additional hard currency.

Tow cables snap, Arctic conditions can be unpredictable, ships sink. As the ocean is the common heritage of humanity, perhaps the international community might evince a tad more interest in this project.

Source: http://oilprice.com/Alternative-Energy/Nuclear-Power/Chernobyl-at-Sea-Russia-Building-Floating-Nuclear-Power-Plants.html

By. John C.K. Daly of Oilprice.com


Gold ‘Indecisive’ Below $1300, Asian Premiums Strong, Ahead of Bernanke Speaking to Congress

London Gold Market Report
from Adrian Ash
BullionVault
Wednesday, 17 July 08:05 EST

The PRICE of GOLD held steady around $1285 per ounce Wednesday morning in London, trading unchanged for the week so far ahead of a key speech from US Federal Reserve chairman Ben Bernanke.

 Giving semi-annual testimony to Congress on the direction of monetary policy, Bernanke was widely expected to clarify recent comments on reducing the Fed’s $85 billion in monthly bond purchases through its quantitative easing program.

 “We continue to consolidate in a $1270-1300 range” for gold bullion, says a note from Swiss refinery and finance group MKS, “in the lead up to Wednesday’s Congressional address.”

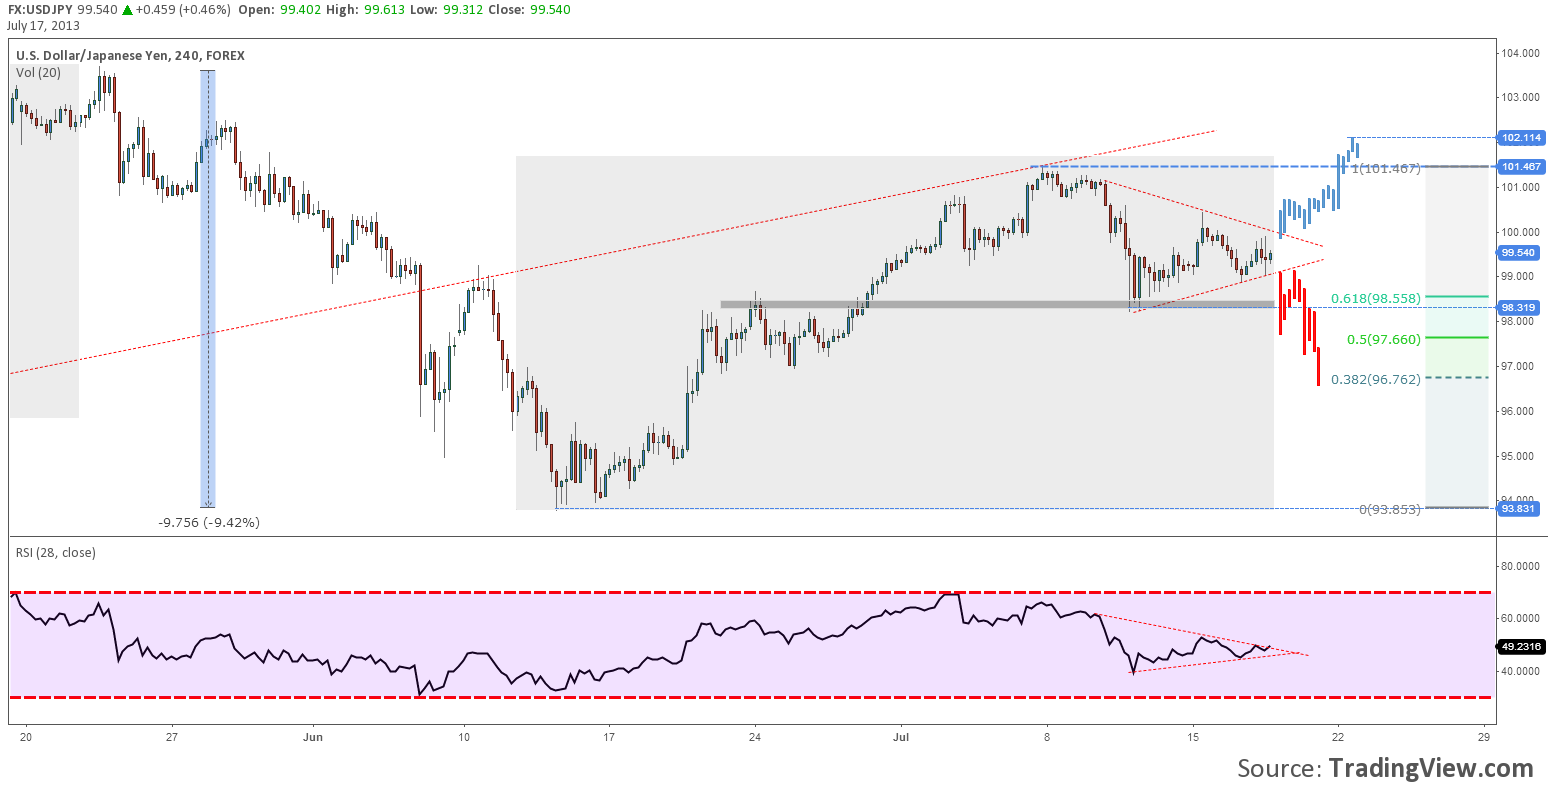
 “The last 3 daily candles,” says Scotia Mocatta’s technical note, “can be characterized as ‘spinning tops’ which have a low range from open to close, and are a sign of indecision in the market.”

 Longer-term, gold is “seen remaining under pressure,” says fellow London market-maker Societe Generale’s latest Commodity iWatch, “on expectations of Fed tapering, rising [interest] rates, stronger US Dollar and investor selling.”

 The Dollar held steady early Wednesday against the Euro, but dropped 1.5¢ vs. the British Pound after minutes from the Bank of England’s latest policy meeting showed a unanimous vote under new governor Mark Carney to keep rates and asset purchase plans unchanged.

 That knocked the price of gold for UK investors back to a 3-session low of £844 per ounce – down 1.6% from Tuesday’s near 4-week highs.

 “The Fed’s bifurcated message [on rates and QE] will continue,” Bloomberg today quotes Barclays’ senior US economist Michael Gapen.

 “Their outlook is for an environment where we can start tapering — so a hawkish tone on tapering switching to a dovish tone on rate hikes.”

 “The unwinding [of QE] needs to be carefully phased, planned, communicated,” said International Monetary Fund chief Christine Lagarde at a central-bank conference in Bucharest on Tuesday.

 Policy makers should play a “much more subtle game,” she said. Because after proving “a massive positive” for the global economy, the effect of removing QE “remains to be seen.”

 Voting policy-maker Esther George – president of the Kansas City Fed – said to Fox Business on Tuesday that starting to reduce QE could likely begin “going into 2014.”

 Meantime in Asia today, premiums for physical gold over and above international benchmark prices held strong, Reuters reports.

 Hong Kong premiums held near $5 per ounce, while dealers in Tokyo blamed a growing shortage of supplies for Japan’s $2 premium.

 Chinese prices for immediate delivery of gold eased back, however, with the premium over benchmark London settlement dropping to $25 per ounce on the Shanghai Gold Exchange, down from last week’s $30 level.

 In India, in contrast – the world’s No.1 consumer nation – “Demand [for gold] will be less as there are so many restrictions on import of raw materials,” says Haresh Soni, chairman of the All India Gem & Jewellery Trade Federation.

 “A lot of buying took place in April and May. Investment demand is also weak.”

 Silver prices were little changed with gold in London trade Wednesday morning, holding in a tight range around $19.90 per ounce.

 Other commodities were also unchanged. Major government bond prices slipped, however, nudging 10-year US Treasury yields up to 2.55%.

 With longer interest rates rising as tapering talk continues, short-term rates remain held at zero, and the gap between 2-year and 10-year Treasury yields has widened since May to the highest level since summer 2011.

 So while “it seems as though the Fed is considering tightening with the ‘taper’ talk,” writes Gary Tanashian in his Notes from the Rabbit Hole, “in reality it is laying the groundwork for the next phase of the ongoing inflation operation.”

Adrian Ash

BullionVault

Gold price chart, no delay | Buy gold online


Adrian Ash is head of research at BullionVault, the secure, low-cost gold and silver market for private investors online, where you can buy gold and silver in Zurich, Switzerland for just 0.5% commission.


(c) BullionVault 2013

Please Note: This article is to inform your thinking, not lead it. Only you can decide the best place for your money, and any decision you make will put your money at risk. Information or data included here may have already been overtaken by events – and must be verified elsewhere – should you choose to act on it.


U.S. Dollar Under Pressure

U.S. Dollar Under Pressure

EURUSD – The EURUSD Trying to Develop Increase

eurusd16.07.2013

Despite the absence of any fundamental factors supporting the single currency increase, being in pair with the U.S. dollar it is confidently consolidating above the 30th figure, in fact, it is already close to the 31st one. On the daily timeframe, the Parabolic SAR is below the price chart maintaining a positive outlook on the technical prospects of the pair, but on the 4-hour, despite the current strengthening, the Parabolic is above the price chart – this raises some doubts about the bulls’ ability to develop an upward trend. However, the breakdown of the high near the 32nd figure dispel all doubts and the EURUSD will increase to 1.3264. The loss of 1.3000 would mean the downtrend resumption.


GBPUSD – The GBPUSD May Increase to 1.5300

gbpusd16.07.2013

The GBPUSD was decreasing yesterday, but the support near 1.5040 didn’t cope with its task, and the pair is now trying to develop its growth towards 1.5200. In general, it seems that the pair has formed the basis and may soon test the resistance at the 53rd figure on the daily chart, where the 100-day and 50-day moving averages are running. The breakthrough of this level would cause further development of the uptrend. On the 4-hour timeframe, the British pound attempts to break above the 100-day MA, but the Parabolic SAR is above the price chart, which casts doubt on the current increase. The loss of 1.5040-1.5000 would return negative sentiment to the markets, and the current low of 1.4813 would be under pressure put by the bears again.


USDCHF – The USDCHF Stays at Support 0.9477

usdchf16.07.2013

The USDCHF is kept from decreasing by the USDCHF, which attempted to increase yesterday, but having faced the resistance at 0.9533, it was forced to retreat to the support of 0.9477, which is trading near it at the moment. On the 4-hour timeframe, the USDCHF is below the 95th figure and 100-day moving average, but the Parabolic SAR, being below the price chart hasn’t confirmed the the downward momentum in the pair. In turn, on the daily timeframe, the Parabolic is above the price chart, but the dollar is trading above the 100-day moving average, which takes place at the level of 0.9443. The decrease lower, would confirm the downtrend, and the increase above 0.9555 would indicate the renewed upward movement.


USDJPY – The USDJPY Fails to Increase Above 100.49

usdjpy16.07.2013

The USDJPY increased to 100.49 yesterday. There it was sold, and the dollar was forced to retreat to the 99.70 support area, where it is trying to form the interim basis. If it succeeds, then the pair will increase to 100.49-100.68. The breakthrough of 100.68 would strengthen the upward momentum. In favor of this development speaks the Parabolic SAR located below the price chart. But on the daily timeframe, it is still located above the chart, and thus the pair still may test the 98.67 support. The drop below would confirm the downward correction.

provided by IAFT


Global Monetary Policy Rates – May, June 2013: 26 central banks slash rates but global average rate steady at 5.65%

By www.CentralBankNews.info     Central banks stepped up their pace of monetary easing in May and June as 26 banks slashed policy rates 31 times by a total of 1736 basis points, taking advantage of the general decline in worldwide inflation to counter a slowdown in global economic growth.
    But the threat of inflation is never far from the surface with five central banks (Brazil, Indonesia, Gambia, Ghana and Zambia) raising rates by 350 basis points in May and 450 points in June, a sharp jump from average monthly rate hikes of just over 40 points in the first four months of the year – a likely harbinger of a rise in global monetary policy rates in the second half of this year.
    Despite the aggressive pace of rate cuts – 15 in June and 16 in May, up from an monthly average of eight cuts from January through April – the net reduction in policy rates was tempered by the fact that the average rate cut was 56 basis points in those two months compared with an average rate rise of 114.
    Central banks tend to raise their rates in bigger increments than when they cut rates, just as inflation tends to rise steeply at first – typically in response to some external shock – and then gradually subsides as interest rates are raised.
    The end result of the 38 rate changes in May and June was that the average Global Monetary Policy Rate (GMPR) remained steady at 5.65 percent in end-June and end-May, down from 5.77 in April, 5.85 percent in January and an average 6.2 percent in 2012 among the 90 central banks covered by Central Bank News.
    While central banks’ response to slower growth was the main reason for lower rates, the dominant theme in May was clearly financial markets’ and central banks’ reaction to the Bank of Japan’s launch of a new round of quantitative easing in April.
   The accelerated decline in the yen not only made Japanese exporters more competitive against other Asian exporters, but there were also fears that the BOJ’s easy money would lead to capital inflows into higher-yielding currencies, posing a risk of unsustainable asset bubbles.
    Four of the 16 rate cuts in May – Australia, South Korea, Thailand and Israel’s two cuts – were explicitly linked to worries over the dampening impact on growth from strong exchange rates.
    The 16 rate cuts in May totaled 809 basis points while three rate rises amounted to rate rises of 350 basis points for a net reduction of 459 basis points.
   But without much official warning, the U.S. Federal Reserve in late May and June announced a possible wind-down of its quantitative easing later this year, triggering a sharp reversal of capital flows.
    Practically overnight, central banks’ concern over strong currencies and asset bubbles turned into a worry over the dampening effect of higher interest rates on growth and a boost to inflation from higher import prices triggered by a fall in currencies.
    But the statements by Federal Reserve Chairman Ben Bernanke on May 22 merely accelerated a shift that quietly had begun a few months earlier.
    A massive selloff in commodities in mid-April was the first sign that major investors and hedge funds were positioning themselves for slower growth in emerging markets. The steady improvement in U.S. labour markets – the jobless rate fell to its lowest rate in April since December 2008 – seems to have convinced investors that the tide was turning and the U.S. economy was finally on the mend.
   Figures this week showed that private investors – considered to be hedge funds – sold $39.2 billion of U.S. Treasuries in May, probably taking profits ahead of the sharp price fall in May and June. Emerging market currencies also started their descent in early May as capital suddenly started flowing out, according to IIF and EPFR data.
    So far, only Indonesia has responded to the pressure on its rupiah, and the accompanying rise in inflation, from the outflow of capital with a rate hike.
    However, given the worldwide impact of changes in U.S. monetary policy on the entire spectrum of financial assets, it is probably only a question of time before other central banks in emerging markets will follow suit.
    Even without the fall in the rupiah from the earlier-than-expected move by the Federal Reserve, the Bank of Indonesia would probably have raised rates in response to higher fuel prices and inflationary pressures from the government’s long-awaited removal of subsidies.
    The 15 rate cuts in June totaled 926 basis points while the three rate rises totaled 450 points for a net reduction of 476 points.

                                   GLOBAL MONETARY POLICY RATES (GMPR) 
                                (Changes in May, June and year-to-date, in basis points)

COUNTRYMSCI                 MAY                 JUNE                 YTD
RATE CUTS:
BELARUS-200-150-650
SIERRA LEONE0-200-500
MONGOLIA0-100-275
KENYAFM-1000-250
VIETNAMFM-1000-200
HUNGARYEM-25-25-150
POLANDEM-25-25-150
GEORGIA-25-25-125
BOTSWANA0-50-100
COLOMBIAEM00-100
MOLDOVA00-100
TURKEYEM-500-100
UGANDA0-100-100
INDIAEM-250-75
ISRAELDM-500-50
JAMAICA00-50
MEXICOEM00-50
MOZAMBIQUE0-50-50
PAKISTANFM0-50-50
RWANDA0-50-50
SRI LANKAFM-500-50
UKRAINEFM0-50-50
ALBANIA00-25
ANGOLA00-25
AUSTRALIADM-250-25
AZERBAIJAN00-25
EURO AREADM-250-25
MACEDONIA00-25
MAURITIUSFM0-25-25
SOUTH KOREAEM-250-25
THAILANDEM-250-25
WEST AFRICAN STATES00-25
SERBIAFM-50-25-25
DENMARKDM-1000
BULGARIAFM1-1-2
SUM:-809-926-3552
RATE INCREASES:
INDONESIAEM02525
TUNISIAFM0025
ZAMBIA02525
EGYPTEM0050
BRAZILEM50075
GHANA1000100
GAMBIA200400600
SUM:350450900
NET CHANGE:-459-476-2652


Central Bank News Link List – Jul 17, 2013: BOE puts QE differences on hold at first Carney meeting

By www.CentralBankNews.info Here’s today’s Central Bank News’ link list, click through if you missed the previous link list. The list comprises news about central banks that is not covered by Central Bank News. The list is updated during the day with the latest developments so readers don’t miss any important news.