Murray Math Lines 16.12.2013 (AUD/USD, NZD/JPY, SILVER)

Article By RoboForex.com

Analysis for December 16th, 2013

AUD/USD

After rebounding from daily Super Trend, Australian Dollar started fast descending movement. Currently, price is being corrected. Probably, instrument may face resistance from H4 Super Trend. If price rebounds from it, next target will be at the 0/8 level.

At H1 chart, bears’ first attempt to break the 0/8 level and enter “oversold zone” failed. Most likely, price won’t able to stay above the 2/8 level for a long time. During correction, I opened one more sell order and plan to move stop into the black as soon as market starts moving downwards.

NZD/JPY

NZD/JPY rebounded from daily Super Trend and the 4/8 level. If later market is able to keep price above the 5/8 level, instrument will continue growing up. In this case, target will be at the 8/8 level.

At H1 chart, pair is consolidating. Possibly, during the next several hours price may leave this consolidation channel and start moving towards the +2/8 level. If later pair breaks this level, lines at the chart will be redrawn.

SILVER

Super Trends formed “bearish cross”. Possibly, instrument may complete current correction. If bears break the 0/8 level, their new short-term target will be at the -2/8 level.

At H1 chart, price is moving between the 3/85/8 levels. Instrument may try to test Super Trends during Monday. If market rebounds from them, I’ll increase my short positions.

RoboForex Analytical Department

Article By RoboForex.com

Attention!
Forecasts presented in this section only reflect the author’s private opinion and should not be considered as guidance for trading. RoboForex LP bears no responsibility for trading results based on trading recommendations described in these analytical reviews.


Death, Taxes and the Technology Sector

By MoneyMorning.com.au

Benjamin Franklin said, ‘in this world nothing can be said to be certain, except death and taxes.‘At the time Ben was right. But that was about 224 years ago. With all due respect Ben, the times have changed.

If he’d lived in today’s age he would probably change his view. There are actually three certainties in life. And death and taxes are certainly two of them.

But there’s another certainty that’s more useful to us…

Death never helped anyone build enormous wealth (unless you inherited money) and taxes…well that only gives money to the government to blow.

The ‘third certainty’ is the constant in life that most people never notice. It holds the potential to change everything.

The story of the third certainty isn’t just about making your life better either. With the right insight and knowledge, the third certainty will lead to immense wealth.

But like death and taxes, the third certainty comes with its fair share of risk. So it’s not just about how this will make life better. It’s also about knowing how to avoid the pitfalls.

To navigate this minefield you need to know the right pathway to take.

So by now you’re likely wondering what exactly is this third certainty? Well simply put, it’s technology.

From Fire to Quantum Computing

That’s a pretty broad subject matter and that’s precisely why it’s so important to have the inside word on what it entails.

You see technology is a certainty in life. Let me explain.

It all started when humans discovered fire. Soon enough with the help of some buffalo shoulder blades humans invented the shovel and axe. Fast forward 12,213 years and technology has advanced further than many can imagine.

Today, humans are responsible for creating the BRAIN project, Quantum Computers and soon, commercial space tourism.

You see technology has existed since the dawn of man. Our curiosity and our evolution dictate that we innovate and inevitably invent new technologies.

Of course technology in general is a very broad subject. Nonetheless it’s something that surrounds you on a daily basis.

It might be the alarm clock on your smartphone that wakes you up each day. It might be the sat-nav that directs you through the lightest traffic to work.

It might be the laptop you work on or the internet you browse. It might even be as simple as the credit card you use to buy groceries.

When you walk around this world with your eyes truly open you see technology in every facet of life. But sadly most people walk around with their eyes closed. Most people don’t see what the world truly offers.

The ‘eyes closed’ people are the ones who have probably already stopped reading this letter. They’re the ones who use words like ‘crazy’, ‘fad’ and ‘hype’.

But that’s okay because not everyone has the capability to recognize opportunity…even when it smacks them in the face.

Paris, Dubai, and…Birmingham

And not everyone who reads this or any of my other technology articles will initially understand all things I write about. But that’s okay too. That’s what I’m here for…to break it down and make heads and tails of it for you.

You can guarantee that over the next few years there will be thousands of ‘next big things’, when I’ll tell you about the next greatest move in technology.

But the difference is I don’t just trawl through articles from the BBC, Financial Times or Australian Financial Review.

My aim is to get the inside word on cutting edge technology. I do that by attending conferences and trade shows. That means going to exotic places like Paris for the LeWeb technology and innovation conference, and Dubai for the SIBOS money and banking conference.

It also means going to engineering trade shows in Birmingham and 3D printing exhibitions in the East End of London.

Importantly my role is to filter the dross from the winners. So when you read about these technological advances, you’ll get to appreciate how it can change your lifestyle, and hopefully also your life savings.

You see I live and breathe technology and what it holds for our future. For me the thrill of it all leads me to places and events where other likeminded individuals exist.

Take for example Jim Kor of Korecologic. I met him at the 3D Print Show in London. Jim made the world’s first 3D printed car. Then there’s Mark Sonter from Deep Space Industries, a pioneer of asteroid mining, and Alex ‘Sandy’ Pentland the MIT professor known as the Godfather of Big Data.

These are just some of the names I’ve already had first hand contact with to understand what future technologies are heading your way.

An Exciting Week in Technology

I have no doubt that we now sit at the beginning of a new era. This next 10-20 years will see unprecedented advances for humankind. Technology and innovation will be the driver for these new advances.

That’s what makes technology so interesting to observe and the investing opportunities so exciting.

I’m looking at a lot of great opportunities in the technology sector right now. And this week in Money Morning you’ll get a taste for the innovations I cover in the premium investment service Revolutionary Tech Investor.

Stay tuned for an exciting week. For example, one of the company’s I’m recommending to readers of Revolutionary Tech Investor is the early pioneer of 3D printing technology. It’s already gained 65% in the six months since we launched our premium investment service. It’s one of the many exciting developments we have to report about, which Kris will do in a few days time. Until then, in Money Morning this week you’ll get a taste for the innovations I cover in Revolutionary Tech Investor.

Regards,
Sam Volkering+
Technology Analyst

Special Report: The ‘Wonder Weld’ That Could Triple Your Money

Join Money Morning on Google+


By MoneyMorning.com.au

The Shale Energy Revolution in North America is Changing the World

By MoneyMorning.com.au

Good news keeps rolling in for America’s booming shale plays.

This week, the US Energy Information Administration (EIA) released a report describing how the Marcellus Shale region is on track to supply 18% of total US natural gas production in December.

Let’s take a look at two important charts – plus a few quick takeaways about how North America is changing the world…

Production in the Marcellus shale is booming. Here’s the first chart.


Basically, more and more ‘takeaway capacity’ has come online in the past year. This is despite a flat rig count, according to data from Baker Hughes. In other words, the same number of rigs are drilling more wells. That comes with improved learning curves and better efficiencies based on experience in the field.

As things stand, Marcellus gas output exceeded 13 billion cubic feet per day (bcf/d) in November and will top 14 bcf/d in December. Based on wells already drilled and ready to tie into the distribution grid, expect to see over 400 million cubic feet per day (mmcf/d) of additional ‘new’ gas coming online from December to January.

What’s the secret? First, it helps to have reasonable government policy. Overall, the state and (most) local governments in Pennsylvania, West Virginia and Ohio have been open to shale energy development – unlike in New York, where the legislature has imposed a moratorium in order to ‘study’ the issue. (Study it to death, I suspect.)

Thus, with a fair set of rules and regs, more and more PA-WV-OH operators have leased land and drilled wells, gaining valuable experience and delivering hydrocarbons.

Now we’re several years into the play. We’ve reached the point where output from new wells is growing fast. In terms of engineering and well building, operators are drilling longer wells – called ‘laterals’ – and adding more down-hole production sections, called ‘frack stages’. This is delivering more output from more stages, in longer wells.

Data from EIA indicate that production per well in the Marcellus will pass a new milestone this month. Each well averages about 6 mmcf/d, on track to bump up toward 6.2 mmcf/d by January. Here’s the chart:

Meanwhile, more pipelines and processing facilities are coming online – long-time readers of my newsletter Outstanding Investments know that I like MarkWest Energy (MWE) in this space. These new systems enable formerly shut-in wells to come online, while increasing overall production that feeds the marketplace.

At the cash register, ‘more gas’ has pushed the average price down. By one key metric, the forward price of natural gas at the Columbia Gas Transmission Appalachia hub ($3.93 per mcf) is now below Louisiana’s benchmark Henry Hub price ($4.00 per mcf).

In addition to natural gas, a key driver for Marcellus output is associated oil and other natural gas liquids (NGLs). These liquids come up the well casing with the gas and change the overall economics of drilling. That is, a ‘break even’ gas program becomes a highly profitable gas-oil-NGL program. In other words, oil companies aren’t drilling wells in order to lose money. That’s not the idea.

New Energy and Its Critics

I’ve heard many people criticize new ‘shale gale’ plays across the country. Close to home, I’ve encountered many Marcellus development critics here in Pennsylvania.

The best of anti-shale critiques include points like ‘energy return on energy investment’ (EROEI) is poor. In other words, EROEI today is lower than in the olden days of drilling classic ‘textbook’ oil formations. Well, yes. That’s basically true. Shale fracking has lower EROEI than poking holes into oil- and gas-rich reservoirs with fabulous porosity and permeability. But so what?

Relatively low EROEI doesn’t mean that what works right now – directional laterals and multistage fracking in hydrocarbon-rich shale – doesn’t work. Clearly, it works. We’re getting gas and oil, right? OK, it costs more to drill the new wells than to drill the old wells. Again, so what? Pay up.

Also, critics claim that overall, fracking is too energy-intensive for what you get back. Part of it is that right now, gas prices are ‘too low’. Another way of saying it is that in the big scheme of things, shale development is a flash in the pan. It will all peter out in a few years. It just won’t last. Then again, we’ll all live long enough to find out, right?

On these last points, we get into all manner of raw speculation over energy and its underlying economics. We know the price of natural gas today. We can look at futures markets for prices tomorrow, next week, next month, next year, etc. But for how long can this new fracking idea deliver the goods? Beats me, but the data indicate that it’s working now. The trends look favorable.

My investment caution here is NOT to dismiss any of the critiques outright. Beware addressing important, complicated issues with a bumper-sticker mentality. When it comes to energy development, you need to stay focused on thermodynamics and classical economics. Follow the iron discipline of physics and math. There’s no free lunch. Moving ahead, we MUST keep our eyes open – not to mention our minds.

Also, longtime readers have read Peak Oil discussions from me over the years. I’ve written about the topic since my first Whiskey & Gunpowder article in November 2004.

With me, it goes back farther than that, to be sure. I’ve worried about energy issues for a long time, and in 2004, Agora Financial was good enough to give me a public outlet. Going back even further, I had the pleasure of hearing the original Peak Oil thesis from none other than M. King Hubbert, at a talk he gave at Harvard back in 1977. Long story, and one I’ve discussed before.

All that, and my first job out of Harvard was working in West Texas for the old Gulf Oil Co., in the Permian Basin. Specifically, I worked west of Odessa, in and around the massive North Ward Estes oil field, in Ward and Winkler counties. We used to lament the ‘irreversible decline’ of our wells.

On that last point, the Permian Basin is now one of America’s fastest-growing oil-producing regions, based on directional drilling and fracking. Indeed, some of the best new oil plays are formations that we used to drill right through when I was working for Gulf. How things change!

Of course, back then, we knew all about the oil and gas in tight formations. We could log the hydrocarbons and such – and we almost always used Schlumberger (SLB) to do the work. But we just didn’t have technology to get that gas and oil out of the rocks. We were several decades too early.

Changing the Global Game


For now, new directional drilling technology – and fracking – is changing the world. It’s delivering energy in immense volumes, as just the new news out of the Marcellus shows – see above. All that and more, across the US and Canada. Soon in Mexico. Perhaps in Europe, and then Africa, the Middle East, China, South America and more.

The shale revolution is delivering energy and feedstock. That’s a fact. New tech is delivering product, creating cash flow and providing investment opportunity. That’s a fact too.

At the government level, there’s more tax revenue up and down the line. There’s more political freedom for policymakers. For example, do you think that the US could do some of the things it’s doing in the Middle East if we didn’t have growing energy output at home? Ditch Saudi Arabia, for example? (We’ll see how that plays out, right?)

For now, the new energy revolution in North America is changing the world. It’ll last for a while, I suspect – all the critiques notwithstanding. Along the way, it’s investable.

That’s all for now. Have a good week, and thanks for reading.

Best wishes…

Byron W. King
Contributing Editor, Money Morning

Publisher’s Note: Time To Ditch Saudi Arabia? originally appeared in The Daily Resource Hunter USA 

Join Money Morning on Google+


By MoneyMorning.com.au

Doug Casey on Crisis Investing in Cyprus

By Nick Giambruno, Senior Editor, International Man, Casey Research

Recently, legendary crisis investor Doug Casey and I put our boots to the ground in Cyprus to search the rubble of one of recent history’s most significant financial crises—the financial collapse and bank deposit raid in Cyprus—for incredible bargains. And we found them.

In this newly released video interview below, Doug and I detail the tremendous speculative opportunities available on the Cyprus Stock Exchange.

You can read all about our specific stock picks, exactly how you can access them, and much more in the new special report, Crisis Investing in Cyprus. Click here for more details.

Inside this new guidebook, Doug and I take a firsthand look at the economic turmoil and opportunity left in the wake of the crisis. This is a must-have resource for anyone interested in speculative opportunities.

I think you will be as excited as we are once you learn about the crisis-driven bargains that we found and detail in Crisis Investing in Cyprus.


The Four Biggest Mistakes in Stock & Futures Trading Strategies

By Chris Vermeulen – www.TheGoldAndOilGuy.com

Removing YOU from the Equation with Simple Automatic Trading

In this series I would like to share with you the four biggest mistakes traders and investors make which costs them time, money and usually self-confidence when trading stocks, ETF’s or futures trading strategies.

The Four Biggest Mistakes

1. Lack Of A Trading Plan

2. Using To Much Leverage

3. Failure to Control Risk

4. Lack Of Self-Discipline

Throughout this multi-part series I will cover the major mistakes, why traders make them and how you can avoid them with your stock, ETF, and futures trading strategies.

While most books about trading are based on success, I want to talk about the other 90% of traders and trading results – the dark side of the business. Why? Because if you can avoid the mistakes then success should naturally happen. Trading As Your Business should not be taken lightly and it’s generally the little things (negatives) that make the biggest differences.


Part I – Lack Of A Trading Plan

Recently to took a free online course by Steve Blank. The program was called “How to Build a Startup”. This course was really well done and if you are an entrepreneur then it’s a must do course hands down. I think it took me roughly 10-12 hours (online videos with embedded quizzes). Anyway, Steve teaches you everything you need to know and do before starting any type of business and why so many individuals fail to succeed.

The #1 mistake made by traders is because they have no trading plan to guide them through the financial market place. A surprisingly high level of traders enter the market without a clear strategy on how they will trade in and out of the market. Most traders are so excited to start trading they simply skip the process of creating, building and testing a stock, ETF of futures trading strategy before they actually start trading with real money and why there is a high rate of failure.

If you take great pride in your trading and truly want to succeed over the long run, then I am sure you find yourself as I do, constantly consumed by monitoring your trades and strategies to be sure the process is executed correctly. If this is you, then congratulations, you are rare and likely making some big money.

Why Do Trades Make Mistake #1?

The main reason individuals trade without a plan is because of the allure that making money in the market can be quick and highly profitable. Many people just do not want to “waste” time planning to trade when they can just pull the trigger to buy and sell within minutes of opening a trading account.

This mind set is understandable. We are all guilty of tossing a product manual to the side and just try to build or use a new product without learning how it works, only to realize hours or days later we are reading the manual because we made some mistakes…

Let’s face it, with so many marketing ads hitting our inbox each day, and books talking about how traders are turning $10,000 into $1,000,000 in less than a year most novice traders will get fired up and start trading before they are truly ready.


Stock ,ETF and Futures Trading Strategies Brutal Truth You Don’t Want

As with any business or professional to be a success a great deal of hard work is typically involved. First of all it is not easy to build a successful trading plan. And then if you can do that, then you need to follow the plan, which is actually even harder. If you want to be a successful trader then you better be prepared to pay the price in terms of time and money.


How to Avoid Mistake #1 – There are only two ways around making this mistake

Avoidance Method 1 – The first is to devote as much time and energy needed to develop a detailed stock, ETF or futures trading strategy that addresses all of the key elements of a successful trading plan and system and still knowing that this will BOT guarantee your success.

The Key Elements That Must Be Mapped Out

– How much money can you afford to lose/trade without affecting your lifestyle?

– What market/s will you trade?

– What trading time frames works best for you?

– Day trade, swing trade, investing, manual order entry, automated trading system?

– What will your criteria’s be for entering a trade?

– What will your criteria’s be for exiting a trade with partial profits?

– What will your criteria’s be for getting stopped out of a trade gone bad?

– What time frame chart will use base the trend of the market on for you trades to follow?

– How will to manage positions by letting your profits run and by cutting losses?


Avoidance Method 2 – The second and fasted growing route traders and investors are going is to buy or subscribe to ETF Trading Strategies, or Futures Trading Strategies and fast track the process to hopefully make money trading with the least amount of effort, the lowest amount of downside risk for their capital and being 100% hands free.


Part I  – Conclusion:

I hope this short report helps you see the light at the end of the very long tunnel of creating, building and following a trading plan. Without this first step/blueprint you are doomed from day one.

Keep your eyes open for part II where I will talk about trading with leverage, how to avoid it, and how to use it to generate massive gains if used correctly.


By Chris Vermeulen – www.TheGoldAndOilGuy.com


Monetary Policy Week in Review – Dec 9-13, 2013: New Zealand, Russia, Iceland to curb inflation, 1 bank cuts

By CentralBankNews.info

    Last week Botswana’s central bank cut rates while 12 banks maintained their rates, waiting with bated breath for the U.S. Federal Reserve to decide when it will start to taper its asset purchases.
    The main takeaway from central banks last week was that inflationary pressures are never from bubbling to the surface despite weak global demand that is keeping a lid of inflation worldwide.
    The Reserve Bank of New Zealand ratcheted up its warning about inflation and is now primed to raise rates in the first half of next year, the Bank of Russia is defying skeptics and proving that it is fully committed to pushing down inflationary expectations while Iceland tightening its previous warnings about rate rises in light of the government’s plan to reduce household debt, a move it said would boost demand and thus inflation.
    But countries that are facing inflationary pressures are exceptions. The global trend is sluggish growth and low inflation, illustrated this week by Botswana, South Korea, Switzerland, Chile and Peru.
    Low inflation is making it possible for central banks to continue to cut their policy rates and through the first 50 weeks of this year, rates have been cut 112 times, 23.0 percent, of the 486 policy decisions taken by the 90 central banks followed by Central Bank News.
    This percentage is slightly lower than the previous week despite Botswana’s rate cut and down from 25.3 percent after the first six months of the year, reflecting rate rises by major emerging market central banks, such as Brazil and Indonesia.
   In contrast, central banks worldwide have only raised their policy rates 26 times this year, or 5.4 percent of this year’s policy decisions, up from 4.7 percent after the first half of the year.
  

   TABLE WITH LAST WEEK’S MONETARY POLICY DECISIONS:

COUNTRYMSCI     NEW RATE           OLD RATE        1 YEAR AGO
SRI LANKAFM6.50%6.50%7.50%
BOTSWANA7.50%8.00%9.50%
ICELAND6.00%6.00%6.00%
SOUTH KOREAEM2.50%2.50%2.75%
NEW ZEALANDDM2.50%2.50%2.50%
MOZAMBIQUE8.25%8.25%9.50%
NAMIBIA5.50%5.50%5.50%
PHILIPPINESEM3.50%3.50%3.50%
INDONESIAEM7.50%7.50%5.75%
SWITZERLANDDM0.25%0.25%0.25%
PERUEM4.00%4.00%4.25%
CHILE EM4.50%4.50%5.00%
RUSSIAEM5.50%5.50%8.25%
    This week (week 51) 11 central banks are scheduled to hold policy meetings, including Sweden, Morocco, Turkey, the Czech Republic, Hungary, India, Serbia, Georgia, Croatia, the United States and Japan.

COUNTRYMSCI             DATE CURRENT  RATE        1 YEAR AGO
SWEDENDM 17-Dec1.00%1.00%
MOROCCOEM17-Dec3.00%3.00%
TURKEYEM17-Dec4.50%5.50%
CZECH REPUBLICEM17-Dec0.05%0.05%
HUNGARYEM17-Dec3.20%5.75%
INDIAEM18-Dec7.75%8.00%
SERBIAFM12-Dec10.00%11.25%
GEORGIA18-Dec3.75%5.25%
CROATIAFM 18-Dec6.25%6.25%
UNITED STATESDM 18-Dec0.25%0.25%
JAPANDM20-Dec                N/A0.10%
    

Weekend Update by The Practical Investor

Weekend Update

December 13, 2013


— VIX closed above last week’s high.  It now has a “green light” for a higher rally.  The next breakout point may be near 21.00, at the neckline of a complex inverted Head & Shoulders formation.  It may happen faster than you imagine.

SPX closes beneath important supports.

— SPX closed beneath its Ending Diagonal trendline and weekly Short-term support at 1780.63.  The Thanksgiving “peak week” high remains intact after two weeks of losses. The weekly Intermediate-term support at 1732.98 may be the next target as early as Monday.  The Broadening Wedge trendline is at Long-term support at 1661.15. A decline beneath that level implies the decline may continue uninterruptedly to the target listed on the chart.


(OfTwoMindsBlog)  Before you buy the dip “because this Bull market will run until 2016,” please ponder this chart from our Chartist Friend From Pittsburgh of total credit and the Dow Jones Industrial Average (DJIA). Unsurprisingly, the stock market advances when credit is expanding and declines when credit growth slows.  Why is this unsurprising? Because ours is a debt-dependent consumer economy: everything from local government building projects to the purchase of vehicles to going to college requires borrowing money (i.e. credit expansion).

NDX reverses from its top.

— The NDX reversed from its top last week.   It may now decline to the lower trendline of the double Broadening Wedge & Ending Diagonal formations.  Elliott Wave analysis appears complete and NDX is now due for a major correction.


(ZeroHedge)  The small-cap-dominated Russell 2000 fell for the 2nd week in a row for its worst performance in 4 months (though bounced modestly off its 50DMA today). Stocks traded in a relatively tight range today – swinging around VWAP – following their only driver – JPY crosses, most of the day. NASDAQ 4000 was rescued to ensure the headline-writers do not panic.

The Euro completes a very strong retracement.


.  


           — The Euro retraced nearly all of its decline from the October 24 high.  Time is running out for the rally, and because it could not overcome its previous high, it is vulnerable to a sell-off.


(ZeroHedge)  While the Eurozone’s northern members enjoy low borrowing costs and stable growth, its southern members face high borrowing costs, recession, and deep cuts in incomes and social spending. They have also suffered substantial output losses, and have far higher unemployment rates than their northern counterparts. Unemployment in the Eurozone as a whole averages about 12%, compared to more than 25% in Spain and Greece (where youth unemployment now stands at 60%). Indeed, while aggregate per capita income in the Eurozone remains at 2007 levels, Greece has been pushed back to 2000 levels, and Italy today finds itself somewhere in 1997.

The Yen gingerly declines toward its Head & Shoulders neckline.

–The Yen continues its decline toward the Head & Shoulders neckline at 96.00. The Yen may break down beneath the neckline in a Primary Wave [5] in a very strong Primary Cycle decline through that may last into the New Year.


(Bloomberg)  Merkel added her voice to German officials including Finance Minister Wolfgang Schaeuble who have challenged Japan for trying to devalue the yen to spur the world’s third-largest economy. Prime Minister Shinzo Abe, sworn in on Dec. 26, has called on the Bank of Japan (8301) to carry out unlimited monetary easing and accept a higher central bank inflation target to boost exports by pushing the yen lower against competitors.


The US Dollar corrects to its Triangle trendline.


— USD appears to have made a very deep 72.6% retracement while briefly dipping below the lower trendline of its massive Triangle Formation.  Despite the further decline, the dollar closed back above the trendline.  The bear trap for dollar shorts has now been sprung.


(Reuters) – The dollar rose for a second straight session against the euro on Friday, as investors began pricing in the possibility that the U.S. Federal Reserve could announce a small reduction in its massive stimulus at next week’s meeting.

   While market participants in general expect the Fed to start paring back its stimulus no later than March, a growing number expect a reduction in the Fed’s asset purchases may be announced

at the central bank’s Dec. 17-18 policy gathering.


Gold between a rock and a hard place.

— Gold rallied above its Cycle Bottom support to test the Lip of its Cup with Handle formation at 1270.00.  In the process it may have created a new Head & Shoulders formation (horizontal line) as well.  This gives gold two legitimate targets for its decline.  These targets may not be exclusive of the other, since Head & Shoulders patterns present probable Wave 3 lows, while Cup with Handle formations often complete the impulse.


(ZeroHedge)  A month ago, regulators in Europe began their investigation into manipulation of the “London gold fixing” (and we explained the methods here). While the complete history of gold manipulation goes a lot deeper than just banging the close on this crucial benchmark (which goes back to first world war); the decision by Germany’s financial regulator (BaFin) to probe Deutsche Bank signals greater concerns over the precious metals markets.  As The FT reports, BaFin has demanded emails and documents from Deutsche Bank as part of an investigation into potential manipulation of gold and silver prices.

Treasuries crossing the Broadening Wedge.

— After testing its Broadening Wedge trendline at 129.71, USB appears ready to descend through it with devastating consequences for the Long Bond.  The Cycles Model anticipates further decline through most of January before the next support may be reached.

(Bloomberg)  The yield gap between 10- and 30-year Treasuries shrank to the narrowest in almost three months on speculation inflation will remain in check as the Federal Reserve prepares to slow bond purchases.

The benchmark 10-year note yield fell from a one-week high after wholesale prices in the U.S. declined for a third month. It rose yesterday after data showed retail sales jumped more than forecast in November. The House of Representatives passed the first bipartisan federal budget in four years, fueling bets fiscal progress will make it easier for the Fed to reduce monthly bond purchases.

Crude finds support at mid-Cycle.

— After testing Intermediate-term resistance at 98.50, crude found support at mid-Cycle at 96.25.  A close above mid-Cycle support indicates more bullish activity may follow  The rally appears young and as yet undeveloped.  Once it breaks above weekly Intermediate-term resistance at 98.50, the rally may gain even more strength.  The rally has the capability of stretching through late January, giving it the time it needs to develop more fully.

China stocks reverse at mid-Cycle resistance.

–The Shanghai Index rally fizzled at mid-Cycle resistance at 2227.38, confirming a bearish left-translate Cycle turn.  SSEC made its Master Cycle low on November 14, so a reversal December 4 (less than 30 days) is very bearish.  A decline through mid-January may be in order, just for starters.

(ZeroHedge)  Which brings us to point number two: the latest target of the Chinese hot money colonization is none other than bankrupt Detroit.

Forbes explains:  Detroit, broke with almost no prospects for recovery, is the fourth most popular U.S. destination for Chinese real estate investors. In fact, it was bad news—the city’s July 18 bankruptcy filing—that triggered renewed interest.  “While the bankruptcy is viewed as a bad thing elsewhere, it raised the exposure level of Detroit’s real estate market in China,”says Evonne Xu, a Michigan attorney catering to Chinese purchasers.  Middle Kingdom, meet Motown.

Has the India Nifty is repelled by its Cycle Top.

— The India Nifty reversed down from its Cycle Top for the 4th time in 12 months.  It also may have touched the top trendline of ita Orthodox Broadening Top formation for the third time.  This suggests the current Cycle may resume its decline into the end of December or early January.  The decline may be deflationary to an extreme.  The potential for a panic decline to the weekly Cycle bottom (4738.90) is very high.

The Bank Index showing signs of weakness.

— BKX  continued to show weakness, closing just above its Short-term support at 66.28 this week.  Intermediate-term support and the trading channel trendline are just below at 64.89.  Next week BKX may be involved in a Flash Crash.

(ZeroHedge)  The realization that RBS is not exactly populated by the sharpest tools in the shed first hit roughly two years ago, when its crack fixed income team was fined $1.9 million for not knowing the difference between Price and Discount, as was shown in the Dynegy CDS settlement auction. However, that episode was rocket surgery compared to what Bloomberg’s Jonathan Weil uncovered, which rightfully prompted him to award RBS the “dumbest bank of the year” award for 2013.

(ZeroHedge) Curious how much the various banks who stood to be impacted by or, otherwise, benefit from either a concentration or dilution of the Volcker rule? According to OpenSecrets, which crunched the numbers, here is how much being able to continue prop trading meant to some of the largest US banks and lobby groups:

(ZeroHedge)  Volcker Rule – Who cares?  I know we are supposed to care more about this convoluted rule, but we just can’t.

The concept that somehow “prop” trading brought down the banks seems silly.  The idea that market making desks were a dangerous part of the equation is ludicrous.

They could have fixed this with a few simple changes, but that would have meant some blame would have had to be shifted onto the regulators…

Who would have thought???

Regards,

Tony

Anthony M. Cherniawski

The Practical Investor, LLC

P.O. Box 129, Holt, MI 48842

www.thepracticalinvestor.com

Office: (517) 699.1554

Fax: (517) 699.1558


Disclaimer: Nothing in this email should be construed as a personal recommendation to buy, hold or sell short any security.  The Practical Investor, LLC (TPI) may provide a status report of certain indexes or their proxies using a proprietary model.  At no time shall a reader be justified in inferring that personal investment advice is intended.  Investing carries certain risks of losses and leveraged products and futures may be especially volatile.  Information provided by TPI is expressed in good faith, but is not guaranteed.  A perfect market service does not exist.  Long-term success in the market demands recognition that error and uncertainty are a part of any effort to assess the probable outcome of any given investment.  Please consult your financial advisor to explain all risks before making any investment decision.  It is not possible to invest in any index.


The use of web-linked articles is meant to be informational in nature.  It is not intended as an endorsement of their content and does not necessarily reflect the opinion of Anthony M. Cherniawski or The Practical Investor, LLC.  


P.O. Box 129  Holt, MI  48842  (517) 699-1554  Fax: (517) 699-1558

Email: [email protected]  www.thepracticalinvestor.com


Outside the Box: WTF?

Guest Post By John Mauldin – Outside the Box: WTF?

It is a regular ritual for major US businesses: the end-of-the-quarter conference call in which the CEO dissects what just happened and gives us some insight on what to expect for the future of the company. My good friend Rich Yamarone, the chief economist at Bloomberg, is the creator of the Bloomberg Orange Book, a compilation of macroeconomic anecdotes gleaned from the comments CEOs and CFOs make on their quarterly earnings conference calls. He not only sits and listens to them present their views, he also picks up the phone and talks to them. He is very clued in on what’s happening in the real world of business.

In New York last week, at our dinner with a table full of economist types (including Art Cashin, Dan Greenhaus, and Ed Yardeni), Rich voiced his concerns about what he had been hearing. He let his inner Darth Vader out and ponderously informed us that we might soon be in a recession. The point was vigorously debated by Greenhaus and Yardeni, but Yamarone held his ground. So, for today’s Outside the Box, I asked Rich to summarize what he is hearing on the conference calls and tie it into his read on the economy. I am pleased that the resulting piece is delivered in his usual entertaining style, with lots of red meat. I think Lord Vader outdid himself.

I write this note from 35,000 feet, flying to Seattle, and there has been a LOT of white on the ground since I left home. Dallas is just today getting back to normal from a storm that left us with two inches of ice; and we were better off than 50 miles further north, where they had a four-inch mantle of slippery ice to contend with. Snow is so much easier.

I am off to Geneva tomorrow after a quick stop in Dallas to swap suitcases. That is a lot of uninterrupted reading and writing time, which I really need. Even worse than the ice, there has been a blizzard of email lately, and my inbox is overflowing worse than ever. I have always tried to enter the new year with an (almost) empty inbox, but this year keeping that resolution will be a challenge. If I owe you an email, hang in there; I’m working on it.

While I’m away, they are going to redo the office in the new apartment. Seems my contractor and my niece/architect/designer are not happy with the results, so someone has to start all over. And the glass doors keep getting cut wrong; but maybe by the time I get back I’ll see more of the finished product rather than continuing to live in a construction zone. Door handles would also be nice touch. Seems the hardware has been on back order for quite some time.

But in general I am spectacularly satisfied. Given the significant explosion from whatever was the initial budget, it is good that I am pleased. One thing I am actually quite amazed by is the quality of the new TVs. In spite of harassment from my kids, I had not gotten around to updating the TVs for about seven years, and the technology has made some great leaps since 2006. Watching movies on the latest Samsungs and the Sony 4K is a revelation. It is almost like being in the room with the actors, as if it were live theater seen on a stage. I caught a few moments of Apollo 13 with Tom Hanks and was simply blown away by the clarity. Apollo 13 featured some cutaways to 1970 tube TVs with their grainy pictures, and the contrast was almost jarring, though it brought back memories of what I thought was cool tech in 1970. I had not understood the hype until now. I guess TV was not one of my priorities, so the new stuff just came upon me all at once. But the kids are ecstatic about the new media room, so I guess that means I will get to see more of them.

There is just so much change happening everywhere, it is hard to keep up. But I try, as I know you do. Have a great week.

Your just trying to get through one email at a time analyst,

John Mauldin, Editor
Outside the Box
[email protected]

WTF?

By Rich Yamarone, Chief Economist, Bloomberg

What’s the Forecast? Economically speaking, existing conditions are cloudy with a chance of a storm. According to the latest entries in the Bloomberg Orange Book, we should expect to see more of the same – that is, sub-par economic activity with a propensity toward a downturn.

The economic data are poor given that the economy is 54 months into the expansion – the post-WWII average length of expansion is 60.5 months. The looming fiscal and monetary issues certainly aren’t likely to be stimulative. In fact, both are set to be more restrictive. Meanwhile, households remain plagued by inadequate real incomes and lacking employment prospects. Businesses are saddled with heavy government regulation and uncertain economic prospects – both domestically and globally.

I’m writing this note at the Lied Library on the UNLV campus in “Sin City,” also known as the Biggest Little City in the World,” “Glitter Gulch,” “The Marriage Capital of the World,” and “The Entertainment Capital of the World.” That’s a lot of nicknames for a city with about 600,000 people. The motto here is “What Happens in Vegas, Stays in Vegas.” From an economic standpoint, it should read, “What Happens in Vegas is What’s Happening in the U.S.” That is, the “haves” have and continue to spend particularly on luxury items. The “have-nots,” or the “have-not-a-lots,” are struggling. This is evidenced in the latest sentiment measures.

Those at the lower end of the income spectrum are considerably less confident than their upper-crust counterparts. And the higher income group isn’t exactly optimistic in recent months. This is crucial to the outlook since the middle-to-lower income group is the true driver of consumer spending, and subsequently overall economic growth. They determine the pace of expansion, recovery or downturn. The higher income group spends, and basically puts a floor of about 2 percent for total expenditures, while the lower income strata spends on necessities like food, fuel, shelter, and to an extent, clothing. The issue is that this middle income driver has been slipping into the lower income category, while the lower income group has fallen into the poverty level.

There’s a bit of irony here in Las Vegas. I’m an economist and part Welshman, making me one of the more frugal people on the planet. Economists aren’t exactly the first to run to “The Capital of Second Chances” – yet another nickname – and this place isn’t among the first consumers head off to when the going gets tough. For that reason, I have expenditures on casino gambling in my “Fab Five” indicators of discretionary spending.

During September, spending on casino gambling fell 1.6 percent from the previous month, and was up only 2.4 percent from year-ago levels. The outlook isn’t that encouraging according to the related comments in the Bloomberg Orange Book.

Caesar’s Entertainment CFO Don Colvin said: “Third quarter results, performance was driven by similar factors as the first half of the year, including continued softness in the domestic gaming market and competition.” Colvin added that “We see the Vegas gaming market kind of flattish I’d say and the hospitality in Vegas a strong positive…But we don’t believe there’s going to be a snapback in the challenged regional markets next year.” That’s not exactly encouraging commentary from an industry insider.

[Courtesy of my Bloomberg colleague, Julie Hyman, on assignment at Caesar’s in Atlantic City, NJ]

Dan D’Arrigo, MGM Resorts’ CFO, highlighted from where the strength is coming, and again it appears to be from those atop the income spectrum. D’Arrigo noted, “On the casino side, we continue to see strong activity from our high-end international customers as our marketing team remains focused on driving that business to our Strip resorts. Our efforts are evident as baccarat volumes grew over 20% in the quarter driving a 16% increase in table games revenue at our wholly owned Las Vegas resorts.” I’m pretty confident that most middle- and lower-income people don’t even know what baccarat is – and some might confuse this with singer/songwriter legend Burt Bacharach who wrote ‘Walk on By.” This is apparently what Americans are doing when it comes to hitting the gaming tables. [For the record, Burt Bacharach and the card game baccarat are not the same thing.]

Most market pundits point to the housing market as a possible source of strength. I’m not exactly convinced that there has been a definitive improvement. The Mortgage Bankers Association’s Purchase Index has been locked in a sideways channel since mid-2010. And since June when the Fed first sent out the feelers that it might commence a tapering of policy in September, the level had slumped.

Interest rates – the price of money – matter. Yes, that’s right, the prevailing level of mortgage rates do matter to would-be home buyers. To argue that a higher interest rate will not have an adverse effect on the housing market is fundamentally wrong.

Most market participants were caught off guard when the Federal Reserve didn’t reduce its asset purchase plans in September after building in higher rates in June when the expectations of a taper were initially floated. I thought that a “no taper” announcement in September was a much easier call than many had expected. Admittedly, I thought it was more of a fiscal issue than the unknown impact of the higher interest rate environment.

Bernanke said during the presser following the Fed’s meeting that “We are somewhat concerned. I won’t overstate it, but we do want to see the effects of higher interest rates on the economy, particularly in mortgage rates, on housing.” Well, most of the associated data show a deceleration from a mid-year peak. Housing starts were 883,000 in August, lower than the 919,000 in May and 1,005,000 in March. Existing home sales were 5.12 million, lower than the 5.39 million units in July and August, while new home sales totaled 421,000 in August, down from a 454,000 pace in June. Pending home sales have fallen for five consecutive months, and are 2.2 percent lower than a year ago.

The Fed minutes from the Sept. 17-18 meeting ultimately revealed “While downside risks to the outlook for the economy and the labor market were generally viewed as having diminished, on balance, since last fall, a number of significant risks remained, including those related to the potential economic effects of the sizable increases in interest rates since the spring, ongoing fiscal drag, and the possible fallout from near-term fiscal debates.”

I still believe that the pause was a function of the government shenanigans rather than concern over the rising interest rate environment. In my world, I bet the conversation around that big marble and mahogany table at 20th & Constitution probably went something like this…

Chairman: “Okay, let’s wrap this meeting up. Does anyone here have a conceivable and legitimate reason why we should keep our foot on the pedal, and refrain from pulling back the monetary stimulus?”

Unnamed Fed Governor: “Well, there’s always Congress…”

Chairman: “Congress? They haven’t done anything, why should we worry about them? What could they possibly do that could cripple the economy more than they already have? We know that both parties want restrictive policies, Republicans want to cut spending and Democrats want to raise taxes, but they don’t ever propose legislation. It’s a catatonic state of affairs over there.”

Unnamed Fed Governor: “They could shut-down, and furlough about 800,000 workers, crush already dampened spirits,  and send a message that they have no ability or interest in solving the nation’s top ills.”

Chairman: “Whoa, that’s quite a stretch there Governor, don’t you think? I mean, who would risk re-election and public humiliation just to send a message of incompetence? Er, um, ugh, ahh…you know, why don’t we hold off from tapering here? Maybe the feeble economic recovery cannot withstand the simultaneous withdrawal of monetary stimulus, restrictive fiscal policy, and a government shut-down.”

While the investment world is convinced that the U.S. housing market has recovered since home prices as measured by the S&P Case/Shiller 20-City Home Price Index is 13.3 percent higher than a year ago, a detailed perspective would suggest the contrary. Activity in the individual regions finds only four areas (Washington, DC, Los Angeles, San Diego, and San Francisco) that have home price indexes that are convincingly above those levels registered during the throes of the housing crisis. Our beloved Las Vegas, NV region has increased as the thick black line in the associated chart suggests, but only to a level seen in January 2009, which was a crisis level.

Two Orange Book accounts helped shed some light on the continued concerns in the housing industry:

Armstrong World’s CEO Matthew Espe noted: “Residential demand slowed down, still strong year-over-year, but I think sequentially slowed down as we entered the end of August and September. That’s probably – we would assess that as being a function of a little rise in the mortgage rates, some overbuild in the builders and maybe some tightening of the credit restrictions.”

Stuart Miller the CEO of Lennar was slightly upbeat, but predicated his optimism on a short-lived increase in rates. Miller said, “Clearly, interest rates have moved higher, and mortgage rates have moved from their unprecedented low point towards more normalized levels. Accordingly, over the past couple of months, we’ve experienced a slowdown in our sales pace and traffic in our communities, as the consumer has adjusted to the change in the interest rate environment. But it is our belief that this change is mild and temporary, given the extremely low levels of housing inventory in the market.”

The local folks here refer to “The Gambling Capital of the World” – now this is just getting silly – as “Lost Wages,” and that too is an issue currently plaguing the rest of the U.S. Average hourly earnings have increased by 2.2 percent over the last 12 months – and a less than desirable 1.3 percent once you adjust for inflation. Clearly running in place isn’t going to get the economy going. The earl chatter regarding the upcoming holiday season is that it will be heavily promotional.

And since consumers can’t spend what they don’t have, they’ve reduced the pace of spending to below that critical sub-2 percent pace of spending on real final sales of domestic product. There’s a little known rule of thumb in the economics world: when the annual growth rate of several economic indicators falls below 2 percent, the macro economy eventually slides into recession. Currently several of these statistics are flashing warning signals: real GDP (1.6 percent), real disposable personal incomes (2 percent), real consumer spending (1.7 percent), and real final sales of domestic product (1.6 percent). These are the broadest measures, possessing exceptional recession predicting abilities. The explanation for this is simple: like riding a bicycle, if you don’t pedal, you tip over. And when the tier one indicators don’t advance by a 2 percent pace, the economy grinds to a halt amid softer employment, incomes, and spending.

Linked ever-so-closely with changes in final sales of domestic product is the pace of employment, and both appear to be slumping in recent quarters. The frail economic recovery is simply not advancing at a swift enough pace to engender greater job creation. Staffing company, Kelly Services CEO Carl Camden said, “There are larger forces at play that continue to impact our business. 2013 has been beleaguered by the same slow and uneven growth trends we saw in 2012 and DC politics are shaking what little confidence US businesses had going into the fourth quarter…Given the uncertain climate and unimpressive job growth thus far in 2013, staffing revenues remain constrained in the staffing markets in which we’re engaged and there is still significant pressure on margins. Looking ahead, we don’t expect any meaningful improvement in the U.S. labor market and we believe that most companies will continue to hold off making key investments in people and capital until economic confidence and stability are restored.”

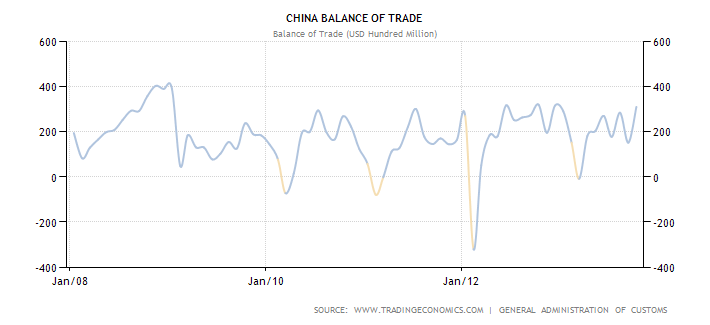
The most recent additions to the Bloomberg Orange Book show economic uncertainty is lingering. While it is doubtful that consumers withdrew spending altogether due to the temporary government closure in Washington, businesses that are dependent upon government reported feeling an impact. Housing activity advanced from low levels, but higher interest rates had a negative influence on activity. China’s economic recovery reportedly strengthened, while emerging markets activity deteriorated.

Interestingly, one quirky indicator – hair color sales – increased in the last reporting period, suggesting that some part of the population opted to self-style rather than head to the pricier salon.

The Bloomberg Orange Book Sentiment Index for the week ended Nov. 29 was 48.57, an increase from the 47.90 registered during the week ending Nov. 22. It was the 42nd consecutive weekly reading below 50.

Sub-50 readings suggest contractionary conditions, while above-50 is indicative of expansion. When looking at the Bloomberg Orange Book Sentiment Index, there are some things to keep in mind: Unlike the ISM or any of the Fed’s regional indices, the Bloomberg Orange Book includes comments from several industries, some of which are doing quite poorly — restaurants, select retailers, household products, etc. The ISM measures sentiment in the manufacturing sector, which is indeed on fire. In fact, very strong signals are coming from the manufacturers in the Orange Book. Unfortunately, there’s little-to-no associated hiring in this sector, but output is undeniably strong. The Orange Book comments that make up the Orange Book Sentiment Index are made with respect to the overall US economy, not just an individual sector.

To date, the lengthy string of sub-50 reading in the OB Sentiment Index has been spot on, predicting a sub-par economic performance. That’s exactly what we have experienced domestically here since the second quarter of 2012. Over the last six quarters, the average quarterly increase in real GDP has been 1.75% — that has traditionally signaled an economic recession — at least every time since 1948.

Some excerpts from the latest edition imply weakness in several, different industries.

Simon Property [SPG] Earnings Call 10/25/13: “…it is clear that the economy has slowed. You’ve seen it with wages, you’ve seen it with employment. Needless to say we don’t have to get into what’s going on in terms of leadership in our country, none of which we use as an excuse, because we put blinders on to the best of our abilities when it comes to that kind of stuff. But we’re operating at a high level in a very slow growth economy, and we’re outpacing the growth in the economy and that’s all that we can do, but we are affected by the economy.”

Caterpillar [CAT] Earnings Call 10/23/13: “….while it looks like there’s a good chance that the world economy could improve next year, there’s still much risk and uncertainty. The direction of U.S. fiscal and monetary policy remains uncertain, and the climate in Washington is divisive. Eurozone economies are far from healthy, and China continues to transition to a more consumer demand led economy. In addition, despite higher mine production around the world, new orders for mining equipment have remained low. As a result, we’re holding our preliminary outlook for 2014 sales and revenues flat with 2013, in the plus or minus 5% range.”

DuPont [DD] Earnings Call 10/22/13: “The macroeconomic environment and in particular global industrial production is improving sequentially, but at a slower pace than we expected three months ago. As a result, we recently lowered our global industrial production outlook for 2013 from 2.5% growth to slightly under 2%.”

Brinker International [EAT] Earnings Call 10/23/13: “The malaise we’ve seen in the category didn’t let up this quarter. Consumer sentiment is guarded at best and consumer confidence remains somewhat volatile. And there’s some evidence that guests have shifted some of their spending to larger ticket items like homes and automobiles. And while we believe this is a temporary phenomenon, but one that has certainly impacted casual dining here in the short term. And while employment rates are showing signs of improvement, casual dining in particular is being impacted by struggles many young adults are facing, particularly those in that 18 to 24 age range. Many are graduating college significantly un- or underemployed, weighted down with debt and often moving back home with their parents. And as a parent with two of those, it’s a scary thought.”

Air Products [APD] Earnings Call 10/29/13: “Economic activity in the second half of 2013 was slower than we had initially anticipated in most regions. Given the current economic conditions, we are planning for economic growth to be modest again in 2014. Globally, for the regions we operate in, we are forecasting manufacturing growth of 2% to 4%. In the U.S., uncertainty in the economy remains, despite the government restart. The combination of unresolved fiscal challenges, weak job growth, low consumer confidence and diminished global demand are likely to continue to act as a headwind on economic growth, despite the positive drivers of lower energy costs and strength in housing. We are forecasting a range of 2% to 4% growth.”

Revlon [REV] Earnings Call 10/24/13: “Total company net sales in the third quarter were $339.4 million, an increase of 1.1% excluding the impact of foreign currency fluctuations as compared to last year. This increase was primarily driven by higher net sales of Revlon color cosmetics despite low year-over-year new product net sales particularly in the U.S. as well as higher net sales of Revlon ColorSilk hair color and Revlon Beauty Tools.”

Timken [TKR] Earnings Call 10/24/13: “It’s now clear to us that the weakness in several of the key markets we serve, including the emerging market infrastructure, mining and energy exploration, is more a structural and will be longer lasting than we had expected. This leads us to believe that the slow steady improvement in demand that we’ve seen thus far in 2013 will extend well into next year. This situation has been exacerbated in the third and fourth quarter of this year by seasonal reductions in demand in some sectors.”

AutoZone [AZO] Earnings Call 9/25/13: “A key macro issue facing our customers today is the reinstitution of payroll taxes back to historic norms. This reduction in our customers’ take-home pay began at the beginning of the new calendar year and at this point it has been difficult to objectively quantify the ramifications of this change, however, we believe this is and will continue throughout the year to be a headwind to our consumer’s spending habits.”

Yamarone

The Orange Book is an exclusive publication of Bloomberg Brief Economics – a daily newsletter featuring proprietary Bloomberg data and analysis from Rich Yamarone and five other leading economists. To subscribe, please visit http://bit.ly/BriefJM.

Like Outside the Box?
Sign up today and get each new issue delivered free to your inbox.
It’s your opportunity to get the news John Mauldin thinks matters most to your finances.

© 2013 Mauldin Economics. All Rights Reserved.
Outside the Box is a free weekly economic e-letter by best-selling author and renowned financial expert, John Mauldin. You can learn more and get your free subscription by visiting www.MauldinEconomics.com.
Please write to [email protected] to inform us of any reproductions, including when and where copy will be reproduced. You must keep the letter intact, from introduction to disclaimers. If you would like to quote brief portions only, please reference www.MauldinEconomics.com.
To subscribe to John Mauldin’s e-letter, please click here: http://www.mauldineconomics.com/subscribe
To change your email address, please click here: http://www.mauldineconomics.com/change-address

Outside the Box and MauldinEconomics.com is not an offering for any investment. It represents only the opinions of John Mauldin and those that he interviews. Any views expressed are provided for information purposes only and should not be construed in any way as an offer, an endorsement, or inducement to invest and is not in any way a testimony of, or associated with, Mauldin’s other firms. John Mauldin is the Chairman of Mauldin Economics, LLC. He also is the President of Millennium Wave Advisors, LLC (MWA) which is an investment advisory firm registered with multiple states, President and registered representative of Millennium Wave Securities, LLC, (MWS) member FINRA, SIPC, through which securities may be offered . MWS is also a Commodity Pool Operator (CPO) and a Commodity Trading Advisor (CTA) registered with the CFTC, as well as an Introducing Broker (IB) and NFA Member. Millennium Wave Investments is a dba of MWA LLC and MWS LLC. This message may contain information that is confidential or privileged and is intended only for the individual or entity named above and does not constitute an offer for or advice about any alternative investment product. Such advice can only be made when accompanied by a prospectus or similar offering document. Past performance is not indicative of future performance. Please make sure to review important disclosures at the end of each article. Mauldin companies may have a marketing relationship with products and services mentioned in this letter for a fee.

Note: Joining The Mauldin Circle is not an offering for any investment. It represents only the opinions of John Mauldin and Millennium Wave Investments. It is intended solely for investors who have registered with Millennium Wave Investments and its partners at http://www.MauldinCircle.com (formerly AccreditedInvestor.ws) or directly related websites. The Mauldin Circle may send out material that is provided on a confidential basis, and subscribers to the Mauldin Circle are not to send this letter to anyone other than their professional investment counselors. Investors should discuss any investment with their personal investment counsel. You are advised to discuss with your financial advisers your investment options and whether any investment is suitable for your specific needs prior to making any investments. John Mauldin is the President of Millennium Wave Advisors, LLC (MWA), which is an investment advisory firm registered with multiple states. John Mauldin is a registered representative of Millennium Wave Securities, LLC, (MWS), an FINRA registered broker-dealer. MWS is also a Commodity Pool Operator (CPO) and a Commodity Trading Advisor (CTA) registered with the CFTC, as well as an Introducing Broker (IB). Millennium Wave Investments is a dba of MWA LLC and MWS LLC. Millennium Wave Investments cooperates in the consulting on and marketing of private and non-private investment offerings with other independent firms such as Altegris Investments; Capital Management Group; Absolute Return Partners, LLP; Fynn Capital; Nicola Wealth Management; and Plexus Asset Management. Investment offerings recommended by Mauldin may pay a portion of their fees to these independent firms, who will share 1/3 of those fees with MWS and thus with Mauldin. Any views expressed herein are provided for information purposes only and should not be construed in any way as an offer, an endorsement, or inducement to invest with any CTA, fund, or program mentioned here or elsewhere. Before seeking any advisor’s services or making an investment in a fund, investors must read and examine thoroughly the respective disclosure document or offering memorandum. Since these firms and Mauldin receive fees from the funds they recommend/market, they only recommend/market products with which they have been able to negotiate fee arrangements.

PAST RESULTS ARE NOT INDICATIVE OF FUTURE RESULTS. THERE IS RISK OF LOSS AS WELL AS THE OPPORTUNITY FOR GAIN WHEN INVESTING IN MANAGED FUNDS. WHEN CONSIDERING ALTERNATIVE INVESTMENTS, INCLUDING HEDGE FUNDS, YOU SHOULD CONSIDER VARIOUS RISKS INCLUDING THE FACT THAT SOME PRODUCTS: OFTEN ENGAGE IN LEVERAGING AND OTHER SPECULATIVE INVESTMENT PRACTICES THAT MAY INCREASE THE RISK OF INVESTMENT LOSS, CAN BE ILLIQUID, ARE NOT REQUIRED TO PROVIDE PERIODIC PRICING OR VALUATION INFORMATION TO INVESTORS, MAY INVOLVE COMPLEX TAX STRUCTURES AND DELAYS IN DISTRIBUTING IMPORTANT TAX INFORMATION, ARE NOT SUBJECT TO THE SAME REGULATORY REQUIREMENTS AS MUTUAL FUNDS, OFTEN CHARGE HIGH FEES, AND IN MANY CASES THE UNDERLYING INVESTMENTS ARE NOT TRANSPARENT AND ARE KNOWN ONLY TO THE INVESTMENT MANAGER. Alternative investment performance can be volatile. An investor could lose all or a substantial amount of his or her investment. Often, alternative investment fund and account managers have total trading authority over their funds or accounts; the use of a single advisor applying generally similar trading programs could mean lack of diversification and, consequently, higher risk. There is often no secondary market for an investor’s interest in alternative investments, and none is expected to develop.


China Investing Opportunities for 2014 – Pros and Cons

Article by Investazor.com

China is known as one of the emerging countries (next to South Korea, Singapore, Taiwan and Hong Kong) with an amazing rhythm of growth (7-8% increase of the GDP), currently having the position of the second largest economy in the world and seriously threatening to take the first place in this rank (currently held by the United States). China was not always the economic power it is today. This meteoric rise started in 1978 along, with Deng Xiaoping’s reform program.

A look in the past…

By the mid 70’ China was a wreck. The “cultural revolution” initiated and led by Mao Zedong took China down the wrong path. The majority of the country’s economic production was controlled by the state and as a result, by 1978 nearly ¾ of the industrial production was produced by state-owned enterprises (SOEs), according to centrally planned output targets.

The Chinese economy was in a relatively stagnant and inefficient state, mainly because of the centrally planned economy policies which gave few profit incentives for firms, workers, and farmers. Additionally, competition was virtually nonexistent, foreign trade and investment flows were mainly limited to Soviet bloc countries, and price and production controls caused widespread distortions in the economy.

Life after the reforms

Deng Xiaoping, the architect of China’s economic reforms, was the first to acknowledge the fact that his country desperately needed reform, portraying the whole situation by the following words: “Black cat, white cat, what does it matter what color the cat is as long as it catches mice?”

Besides articulating the Four Cardinal Principles, he was the first to propose and insist that China undertake reform, adopt an open policy and invigorate the economy. The four cardinal principles actually marked the entry in a new era for the Chinese socialism. The implications of the Four Cardinal Principles were huge because besides them everything could be questioned, from political ideas to economic measures. The reform strategy stated by Deng Xiaoping contained 3 big directions: economy, foreign affairs and internal policy.

Internal policy

He understood that in order to build a powerful and prosperous country, first, he would have to reunify China, which, in other words meant to resolve the questions of Taiwan, Hong Kong and Macao. Deng Xiaoping’s solution: “one country, two systems”. This concept helped a lot in the process of building the socialism of today’s China. After the internal political issue was solved, it was the time for the economic reform to take the lead.

Economy

Back then, 80 per cent of China’s population lived in the countryside; it was there that the reform was to begin. First step was to initiate price and ownership incentives for farmers in order to allow Chinese farmers to sell their production. The new agricultural policy, led by Deng Xiaoping led to a substantial boost in China’s agricultural output. Another important reform was the decision to allow local municipalities and townships to invest in their own industries. After the success in the countryside, Deng decided to take the reform to the next level, urban areas.

Because urban reform was more complicated than rural reform, Deng urged that some regions should be allowed to become prosperous, so that others would follow their example. The first step was to allow the private sector to develop properly, as a supplement to the socialist sector.

So, on his proposal, four special economic zones were established and 14 coastal cities were opened to the outside world with the purpose of attracting foreign investment, boosting exports, and importing high technology products into China. On the basis of mutual benefit, China would vigorously expand its economic cooperation with foreign countries, absorb their capital and introduce their advanced technologies, all of this in order to accelerate the development of its own economy.

Foreign policy

Deng Xiaoping was the one responsible for China’s independent foreign policy, which in essence consists of standing firmly on the side of the Third World countries, opposing to the western powers. In term of results this policy made China the biggest investor in areas such as Africa and South East Asia, regions well known for their abundance in mineral and energy resources which are ingredients of strategic importance in feeding a booming economy, such as that of China.

Results

Since the introduction of economic reforms, China’s economy has grown substantially fast, which is, China’s average annual real GDP has grown by nearly 10% .This means, on average, that China has been able to double the size of its economy in real terms every eight years.

Chinese GDP Growth 1979-2013
Average Real GDP Growth Major Global Economies

However, the global economic slowdown, which began in 2008, came as a drag for the economy and China’s real GDP growth fell from 14.2% in 2007 to 9.6% in 2008 to 9.2% in 2009. The financial crisis prompted the Chinese government to implement a large economic stimulus package and an expansive monetary policy which eventually boosted domestic investment and consumption and most importantly helped prevent a sharp economic slowdown in China.

Nevertheless, in 2010 China’s real GDP returned above the 10% benchmark and grew by 10.4% while in 2011 got back to the 2009 value and it rose by 9.2%. Taking into account this statistics, China has been able to maintain steady economic growth rates, especially compared to those of other major economies.  In 2012, China’s real GDP growth slowed to 7.8%. The International Monetary Fund (IMF) in July 2013 projected that China’s real GDP would grow 7.8% in 2013 and 7.7% in 2014 signaling that China’s economy may enter in a cooling period.

 Third Chinese Plenum

On 15th of November 2013 a 60-point document was released by the Communist Party on reform pledges after leaders met to map out policy changes for the coming decade. To sum up, the much anticipated and recently completed Third Chinese Plenum upgraded the importance of markets in its philosophy  from previous policy statements which often described markets as playing only a “basic” role in allocating resources, but it also made clear that it had no plans to radically reduce the role of the state in the economy. The target for achieving success with these reforms is 2020.

Taking the discussion to a more particular note, item 12 of that 60 point document focused on improving financial markets, including moving to a registration-based system for issuing stocks, Communist Party leaders pledging to change the system as part of a package of reforms to allow markets to play a “decisive” role in setting prices and allocating resources.

On 30th of November, two weeks after the Third Plenum and the reforms associated with it, China Securities Regulatory Commission hits the markets with an announcement. China’s securities regulator issued a reform plan for initial public offerings, as the government prepares to lift a more than one-year freeze on new listings in the world’s second-biggest economy and about 50 companies are expected to complete the IPO approval preparations and list or be ready to do so by the end of January. There are more than 760 companies in the queue for approval and it will take about a year to complete an audit of all the applications, it said.

This statement comes in the context in which, China, the world’s largest IPO market in 2010, with a record $71 billion raised, hasn’t had an initial public offering since October 2012 as the CSRC cracked down on fraud and misconduct among advisers and companies.

So, with an inefficient banking sector as it is in China, these series of IPOs could be a big step towards a revival and also could make for a good investment. I think the sector which may be between those with the highest growth next year is the financial one, especially the stock markets.

The reasoning would be the following. With so many IPOs next year, the banks will have its hands full, so the winners of this situation would be the Chinese banking giants. As Benjamin Graham would say, the IPO game is not a game for the intelligent investor because you can buy stocks of those new listed companies at a discounted price after the euphoria starts to fade and you can figure out which stocks really has growth prospects and which you can buy right after they hit bottom. Hence, the investors will follow which banks will be responsible for the large majority of the IPOs underwriting process and will buy their stocks because in this whole story the banking system is the main beneficiary.

Economic indicators

Chinese Balance of Trade

The Chinese trade balance increased in October to 31.1 billion USD as exports grew with 5.6%, stronger than expected. The exports were sustained by the increased of shipments to E.U. with 12.7% while those to the U.S. grew 8.1%. In the first 10 months of 2013, China’s total trade reached 3.4 trillion USD, up by 7.6 percent over a year earlier, but below the government’s target of 8 percent.

For the foreseeable future, economists are afraid that the weak evolution of the world’s economy will aggravate the process of China becoming the most powerful country in the world. China succeeded in becoming a significant and reliable exporter for economies like the United States (accounts for roughly 17% of China’s exports) and Europe (accounts for approximately 16% of China’s exports) but these economies are slowing too. Should the government be worried about the capacity of its domestic demand to absorb its domestic production capacity?

The same scenario is available for the evolution of the Gross Domestic Product as the possibility of missing its 7.5% target increased. If in the period 2003-2008 the yearly evolution of the GDP ranged between 15.7% and 22.9%, staring with 2009 since now, the GDP didn’t exceed 17.8%, last year being reported to 9.8% with lower expectations for 2013. The largest share in the calculation of the GDP is taken by the industry and manufacturing fields (of which the most prominent comprise of petrochemical, metallurgy, forestry, medicine, food and machinery). As the Chinese government doesn’t seem ready to accept a below target of the GDP, economists are expecting the Central Bank to intervene and take measures as: a cut in the interest rate and sustaining the yuan devaluation.

Chinese Inflation Rate

Inflation in China raised in October to 3.2%, with food prices rising the most. Premier Wen Jiabao believes that China is under inflationary pressure. Also, he sets the inflation target to 3.5% for 2013, lower with 0.5% than the target for the previous year as the price stability was always an important characteristic of the Chinese economy. As it concerns the final of the year, the inflation is believed to stay under reasonable levels. Given the fact that China is considering important reforms which are due to sustain the economic growth, inflation may fluctuate, exceeding the limits set.

Investing opportunities

China’s strongest point is the fact that it is a large consumer of labor force, keeping its economy in movement. By becoming the larger supplier of products like TVs, washing machines, air conditioning machines or microwaves, China is making itself indispensable to the world and is boosting its exports to incredible results.

Difficulties: an inefficient banking sector and a weak services sector.

Advantages: large market of human resources, cheap labor force, favorable market for investors, attractive territory for new businesses.

Since the beginning of the 21st century it was raised the issue of revaluation of the “people’s money” or renminbi. The parties that suggested this move wanted to see the national currency fluctuate free, thus the exchange rate will be influenced only by market forces. It was also targeted an appreciation of the currency which would arouse many reactions considering the fact that China is an important exporter for the world’s economies. China withstood in front of all these pressures.

It is interesting to observe the exporting characteristic of the Chinese territory, aspect that help China become the second economy in the world. Since China produces large amounts of products, on which many countries rely, China is also offering small production costs which are reflected in small prices. This situation forces other nations which have their GDP strongly influenced by exports to line up to certain rules like: buying chines sub assemblies in order to be able to produce cheaper products, moving the production process in China or searching other countries with cheap labor force, increasing the productivity based on automation. The exporting countries are forced to make such changes in order to survive to a competitor as China.

It is known that the main competitor of China is the United States. In the event that China will surpass the U.S. we could expect significant reactions concerning that the two economies are driven by different polices and regimes. Economies will question the democratic aspect together with the American system of laws which are now out passed by a communist regime, a country that doesn’t offer an adequate protection of intellectual property rights, with a regime of subsidies rigorously controlled. The rise of China is permanently questioning whether or not its politics and rules are more efficient that the European or American ones.

Challenges

American SMEs are very active in China. As American small to medium sized enterprises account for 99.7% of all U.S. companies, they are trying to expand their businesses to other relevant markets and China is one of the attractive markets. The AmCham Shanghai SME Center is designed to support and help American SMEs to get access on the Chinese market. Both China and the U.S. are very aware of the fact that strengthening the relationships between them, by developing the SMEs on the Chinese territory, implies eliminating trade barriers and generates economic growth. The most significant challenge on this matter is the regulatory environment. A survey, based on talking with the American SMEs activating on the Chinese territory, is reporting the fact that the regulatory system in China is very unclear and leads to additional costs and undue risks to their operations. The legal and regulatory system can be opaque, inconsistent, and often arbitrary.

One of the issues of the Chinese banking system is the lack of ability to allocate credit according to market principles, favoring the State Owned Enterprises (SOE). According to a study, in 2009, 85% of all bank loans ($1.4 trillion) were allocated to SOEs (most of these borrowings are believed to remain unpaid, resulting thus in a great number of nonperforming loans held by the banks).

Lack of effective protection of intellectual property rights is another serious problem as 44% of U.S. SMEs cited the lack of “protection and enforcement of your IPR” and almost one-third indicated concern for the theft of their company’s trade secrets. Another issues raised by more than two-thirds of SMEs were the unfair competition and the trouble in finding the right customers.

Another challenging aspect of the Chinese market is the heavy reliance on an export-led growth model. Parts of the Chinese bureaucracy still seek to protect local firms, especially state-owned enterprises, from imports, while encouraging exports.

As a strong characteristic of the Chinese economy is the fact that it is a planned economy (with five-year plans setting economic goals, strategies, and targets) we can extract from here the challenging aspect by analyzing a few issues. First of all, a planned economy leads to an unprofitable allocation of resources considering the lack of the law of supply and demand. Also, in such an environment, the economic decisions depend on the government or state rather than on the interaction between consumers and businesses.

These issues of the Chinese economy pose serious problems in developing many sectors of the country and in aligning to the world’s economic standards.

The post China Investing Opportunities for 2014 – Pros and Cons appeared first on investazor.com.

The Next Revolution in Computing

By MoneyMorning.com.au

For centuries, carbon existed only in two forms: diamond and graphite.

However in the mid-eighties, this changed. An inventor and futurist by the name of Buckminster Fuller observed what later became known as Fullerenes. These are a family of molecules which are made entirely of carbon. They have a hollow shaped tube or spheres.

Yet, until the publication of Japanese scientist Sumio Iijima’s research on carbon nanotubes (CNTs) in 1991, few paid attention to the real world applications of CNTs.

Many wrongly credit Iijima with ‘inventing’ carbon nanotubes. It was in fact Soviet era Russian scientists who first observed CNTs 40 years earlier. But the Soviet government restricted international access to Russian scientific journals.

So it was Iijima’s research that drove the investigation into the potential of carbon nanotubes. His findings got the science boffins buzzing about nanotechnology’s future.

Simply put, CNTs are tubes of carbon, normally only a few nanometres (nm) wide. To put that in context, one millimetre is equal to 10,000,000 nanometres.

But don’t let the small size of CNTs fool you. According to a fabric review website, a carbon nanotube looks ‘like cotton thread, conducts electricity and heat like a metal wire and is as strong as carbon fibres.

It’s a big statement, but scientists are only just beginning to test the theoretical possibilities.

Upon discovery, scientists always understood CNTs were the strongest fibre available. They’re extremely lightweight, with a strength to weight ratio 117 times that of steel.  They’re one atom thick with high electrical conductivity and thermal properties. Meaning electrons and heat move through them easily.

Because of their tensile strength – the amount of force needed to pull something before it breaks – you’ll find CNTs in niche products. Skis, golf clubs, ultra-light weight bicycles, Kevlar vests and even wind turbines.

The problem is, while scientists were aware of CNT’s possibilities, they haven’t been able to explore the full potential. Mostly this is because carbon atoms are difficult to work with.

And the key to unlocking their potential is controlling the chirality, or it’s ‘twist’. This determines the optical and electronic properties of carbon nanotubes.

Now several universities around the world have developed methods to control this chirality.

This is why the hype around CNTs is back. The new ways discovered allow more control over the carbon, and will ensure it dominates the science journals for next year. You’ll see more and more information on what CNTs could do, can do… and eventually will do.

First Step for Smaller and Faster Gadgets

The opportunities this technology presents are truly mind blowing.

I’ll cover the most exciting research over the next few weeks.

Look, don’t get me wrong. Some big name companies have abandoned their nanotube research for now. Bayer Material Science is one of those. In a statement this year the company said ‘…that the technical potential areas of application that once seemed promising from a technical standpoint are currently either very fragmented or have few overlaps with the company’s core products and their application spectrum.

But don’t let a statement like that dismiss the concept.

Just because it doesn’t fit one company’s business model, somewhere in the world, there are many other firms and scientists looking for ways to push the boundaries of what we know.

This may be a bold claim, but within a decade, there’s a chance that silicon computer chips will be a thing of the past. Let me explain…

For the past 20 years, silicon microchips have enabled computers to get smaller and process information quicker than many thought possible.

However, early on in the process of making things smaller, two major problems have been present. The first, is the smaller things got, the smaller the copper wire has to be. But as copper wiring shrinks, so does its conductivity.

The second issue is heat. Silicon chips may have gotten smaller, but the heat they generate has increased. More simply, our electronic devices are hotter. And it’s all because of the silicon transistors. Transistors are semiconductors that provide electronic signals and power, and are a key component of all modern electronics.

Have you ever felt the heat from a laptop, tablet, PC or mobile phone and thought ‘wow, that’s hot’?  Well, that’s the silicon transistors working to produce all the power.

In fact silicon chips will soon reach their limits because of these two factors.

You see, for years progress in electronics meant shrinking each transistor.

The smaller a transistor, the more you could put in a device. And the more you could include, the more computer processing power. Simply put, the higher the number of the transistors, the quicker information could move from one component to the other.

But the problem is, silicon transistors generate an immense amount of heat. The more that make up an electrical gadget, the more heat it creates. Not only that, but all the extra heat wastes power. The name for this is ‘energy dissipation’.

And now, shrinking conductivity and energy dissipation are bringing an end to the era of the silicon chip.

Because we’re reaching the upper limits of processing abilities in computers, researchers are working double time to find the next step.

And some engineers at Stanford University in America have done just that.

Is This the End of Silicon?

Many other scientists before the Stanford team tinkered with carbon nanotube transistors. Yet no one had found a way to make a complex circuit, something which could provide a real alternative to integrated circuits, or as we know them, the silicon chips used in modern computing.

The Stanford team were able to use previous research and build on it. Not only did they enhance the fabrication process for CNT based circuits, they went on to develop a ‘wafer thin’ CNT circuit capable of computation.

Stanford professor Subhasish Mitra, an electrical engineer and computer scientist who lead the team, said,’People have been talking about a new era of carbon nanotube electronics moving beyond silicon. But there have been few demonstrations of complete digital systems using this exiting technology.

The Carbon Nanotube Circuit


Click to enlarge

Believe it or not, the picture above is the entire computer. It doesn’t look like much, but it’s a considerable leap for science.

This processor can perform basic counting and number sorting functions. It can even multitask and swap between operating systems.

That’s impressive, given that it only has a total of 178 transistors. That’s nothing when you consider an iPad 4′s microchip has around 200 million transistors.

Also, this wafer thin computer has an operating speed of 1 kilohertz (KHz). Again, the iPad 4 runs at 1,400 megahertz (MHz).

(Now if you don’t ‘speak computer’, kilohertz and megahertz describes the core clock speed of a computer processor.  So one KHz represents one thousand cycles per second. One MHz is one million cycles per second.)

By today’s measures, it’s might seem hard to get excited about a computer processor that runs significantly less efficiently than today’s standard. Especially one that can only count and sort numbers.

However, like Stanford Professor Mitra said, it’s an important step in the potential for CNTs to replace silicon in transistors.

This achievement has finally proven there is an alternative to silicon transistors. This breakthrough is proof that CNT computers are doable.

Considering scientists have known for some time the limitations of silicon chips, what took the CNTs researchers so long to finally develop this product?

It mostly came down to technique.

Carbon nanotubes are difficult to work with. The key factor behind the CNT transistors was learning the right technique to ‘grow’ the carbon nanotubes. You see, they don’t grow in straight lines. Only 99.5% of the CNTs form the lines required for a microchip. However given that there are billions of nanotube lines on a chip, the smallest misalignment would render the chip useless.

This discovery is a big deal. It meant the Stanford team worked out how to control the metallic properties of CNTs and deal with the misalignment, without the need to hunt for them like ‘needles in a haystack’.

This is the key to making CNT transistors suitable for mass production.

Yes, this is early stage research. But all revolutionary products take time.

In the late 1950′s, scientists had only just worked out how to place electrical components in thin sheets of silicon.  It was almost twenty years later that enough electric circuits went into a silicon chip to create a whole computer.

It’s a safe bet that the move to carbon nanotube computing will be quicker than the uptake of silicon chips.

Shae Smith
Assistant Editor, Money Weekend

Join Money Morning on Google+


By MoneyMorning.com.au