European Wrap Up, ECB is Aware of the Risks

Article by Investazor.com

Today on the European session the economic data was pretty mixed. While France reported both manufacturing and services flash PMIs under estimates, Germany and Italy surprised with Manufacturing PMIs above expectations and Services PMIs under. The European Trade Balance is up to 14.5B euros, but was published lower than expectations.

At the EU Parliament in Brussels, Draghi announced that the ECB is waiting for a slow pace recovery of the economy, reflected also by the low inflation. Still he also said that the EU economy should benefit from rising export demand. The ECB president is well aware of the downside risks of low inflation and confirmed the fact that the Central Bank is ready to act.

United States released today the Revised Nonfarm Productivity, which rose by 3.0 percent, Manufacturing PMI (54.4, lower than estimates), TIC Long term Purchases went up to 35.4B, the Capacity Utilization Rate rose by 79% and the biggest surprise, the Industrial Production which rose with 1.1%, well above the estimates of 0.6%.

eurusd-short-term-technical-resize-16.12.2013
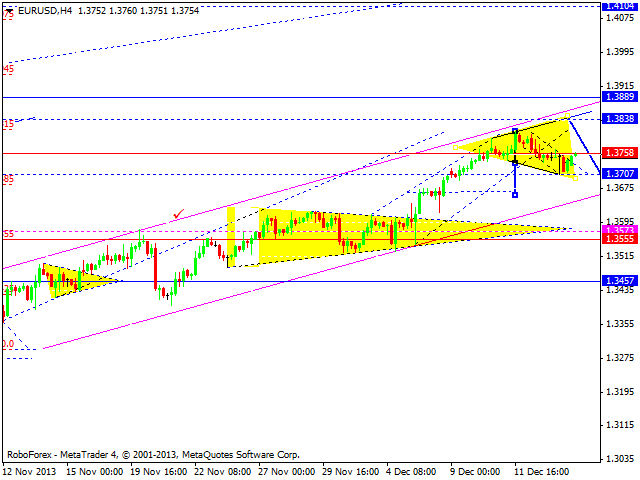
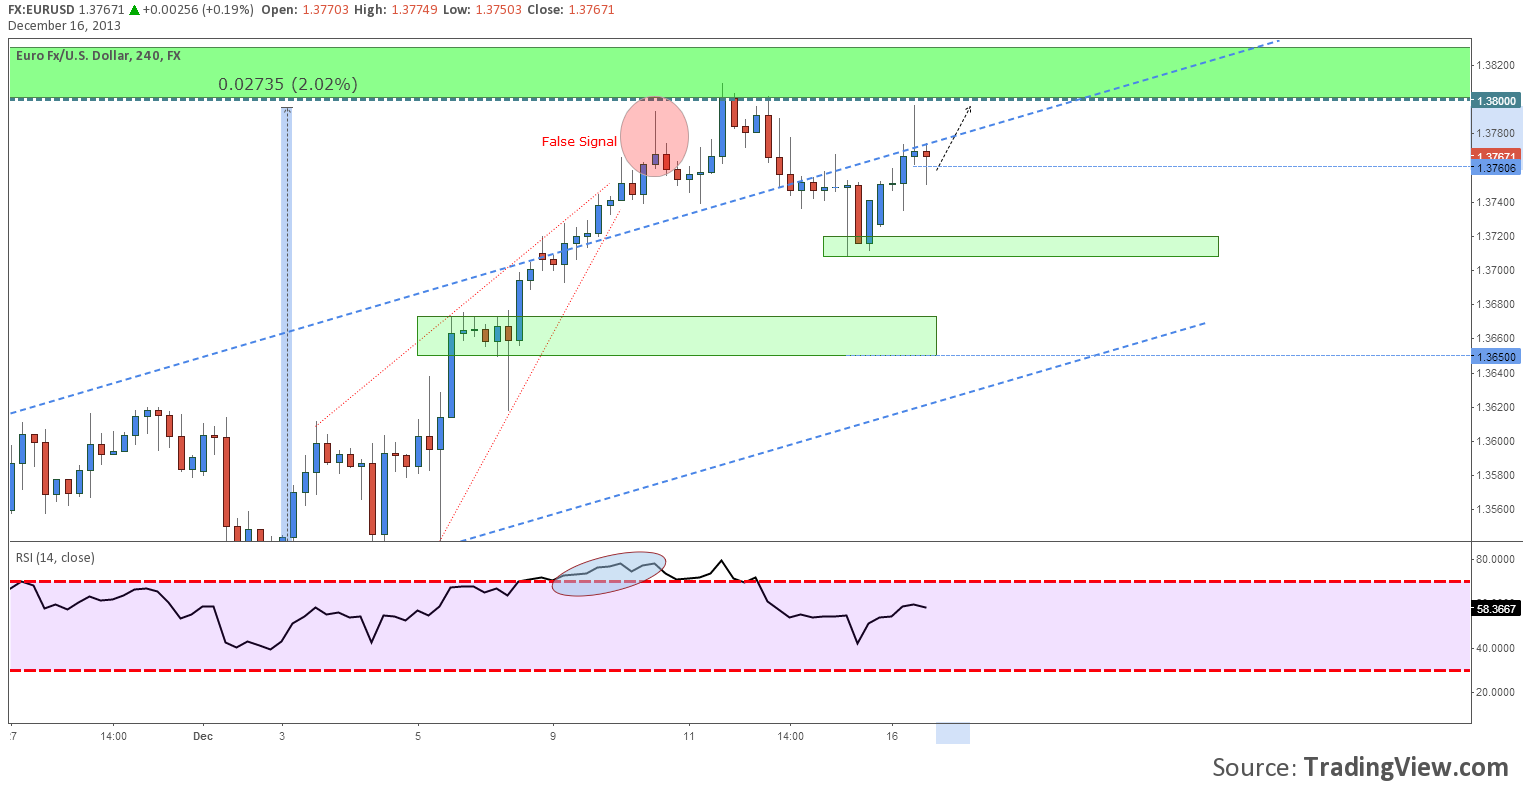
EURUSD couldn’t breach 1.3800. After it touched 1.3797 earlier today, the price action defined a pretty nice Shooting Star on the H4 time frame. The signal was already confirmed and the Euro started to drop and touched a local low at 1.3750. It has reacted more volatile after the Industrial Production was published for the United States and stood almost unchanged while Mario Draghi was having his speech. From the technical point of view, there are higher chances for the price to get back to 1.3800 in the next several hours.

dow-jones-indu-short-term-technical-resize-16.12.2013
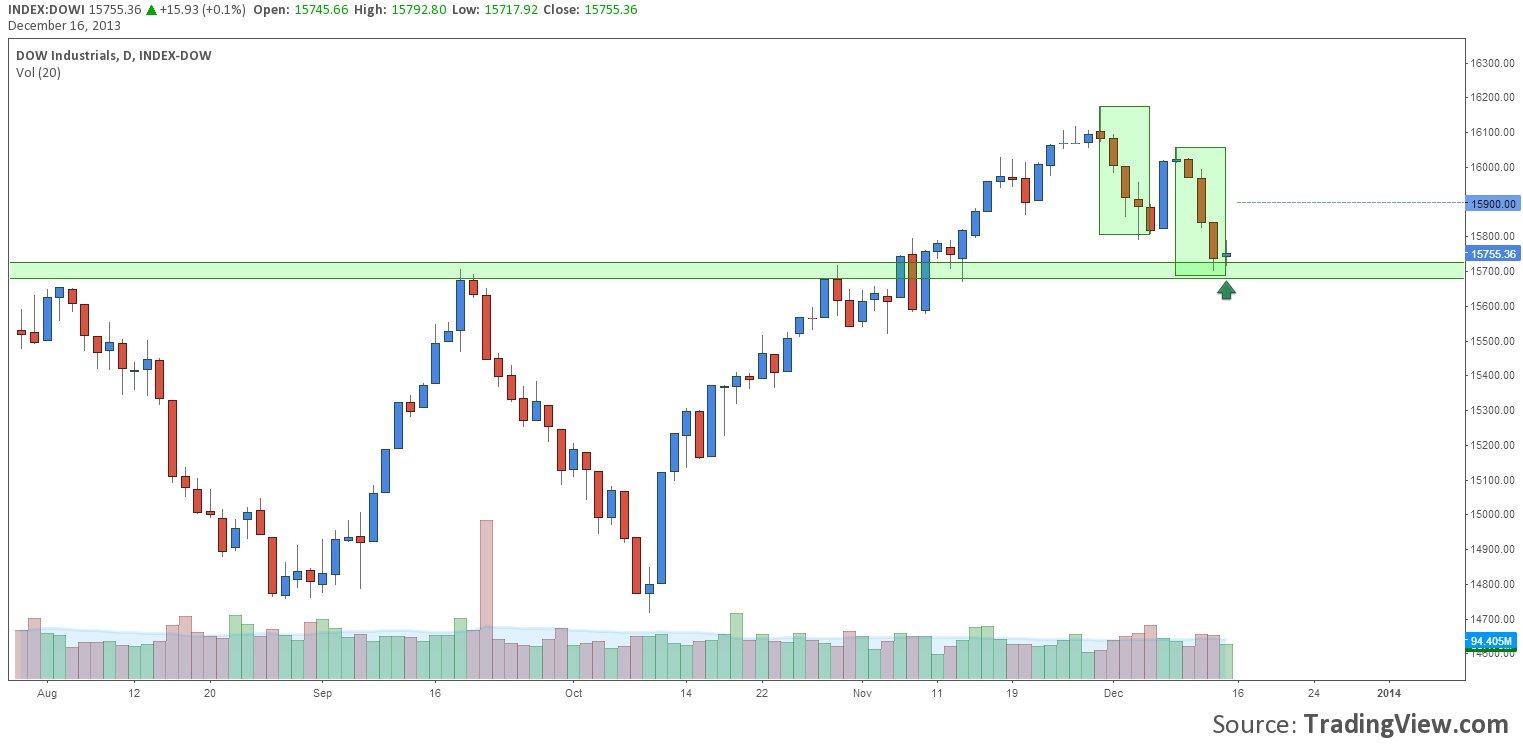
The Dow Jones Industrial Average dropped in the first half of December back to 15700 where it found a past resistance that was turned into a support. We are expecting a bounce from here back to 15900, because the price reached a pretty interesting demand zone and the fundamental data sustains a rise in the DJI price.

The post European Wrap Up, ECB is Aware of the Risks appeared first on investazor.com.

Federal Reserve: 100 Years of Destroying the Purchase Power of Money?

By Michael Lombardi, MBA

Nearly 100 years ago, on December 23, 1913, the Federal Reserve was created. The central bank was created for many reasons, such as minimizing the impacts of panics, becoming a banker of last resort and “smoothing” economic cycles.

But along the way to keeping the monetary system stable, something happened: the value of money deteriorated.

What you could buy for $1.00 in 1913 costs $23.59 today. (Source: Bureau of Labor Statistics web site, last accessed December 11, 2013.) A simple calculation would show that prices have increased by 2,259% over the last 100 years.

Something else to ponder: there have been more erratic movements in inflation since the Federal Reserve was created than in the century prior to then, when the Fed didn’t exist! Since the Federal Reserve was born in 1913, there were 10 years when inflation in the U.S. economy came in at more than 10%. Between 1800 and 1912, there were only four years when inflation in the U.S. was greater than 10%. (Source: Federal Reserve Bank of Minneapolis web site, last accessed December 11, 2013.)

“What’s your point, Michael?”

The unprecedented amount of paper money the Fed has created (out of thin air) since the Credit Crisis of 2008 will come back to haunt us—that’s my fear.

The Federal Reserve’s balance sheet has grown to about $4.0 trillion. M2 money stock, that’s the supply of paper money in the U.S. economy, has gone up 27% since 2009. (Source: Federal Reserve Bank of St. Louis web site, last accessed December 11, 2013.)

And through its “quantitative easing” program, the Federal Reserve continues to print $85.0 billion per month in new paper money with no end in sight. On top of this, it’s kept interest rates artificially low for years.

All this “printing” will eventually devalue the U.S. dollar and further destroy the buying power of Americans. Our lesson in history has been that the more dollars in circulation, the less those dollars buy. Sure, the official numbers don’t show there’s a problem with inflation (yet), but ask the average American Joe, and he won’t tell you his cost of living is going down.

We are living in unprecedented times. We’ve never had a situation in which the Federal Reserve printed so much new money. Many people are unfazed by this because it doesn’t really make a difference in their everyday life…right now.

But two serious risks have developed: 1) the stock market has become so dependent on the “easy money” policies that prevail today, that should the money printing stop or be significantly tapered, the market could crash; 2) inflation is “chomping at the bit.” Yes, I understand the “official” figures don’t show it, but by the time they do, it will be too late. The damage will already be done.

Bottom line: be very cautious about the stock market and prepare for some serious inflation.

This article Federal Reserve: 100 Years of Destroying the Purchase Power of Money? is originally publish at Profitconfidential


Analysts Split Over Fed’s 2014 Impact on Gold as QE in Spotlight

London Gold Market Report

from Adrian Ash

BullionVault

Mon 16 Dec 08:35 EST

The PRICE of gold bounced from a steady drop Monday lunchtime in London, trading back at $1234 per ounce as Asian stockmarkets ended sharply down but Europe ticked up ahead of this week’s US Federal Reserve policy decision, due Wednesday.

 China’s gold premiums above international prices edged lower again, dropping to $6 per ounce at the close of solid trading on the Shanghai Gold Exchange.

 Silver tracked and extended the moves in gold, cutting an earlier 1.2% drop in half to record a London Fix of $19.50 per ounce – exactly the level of Monday last week.

 Looking ahead to Wednesday’s Fed announcement, “A deferral of [QE] tapering and year-end squaring should be positive for gold,” says a Japanese conglomerate’s precious metals team.

 Last week’s high of $1268 per ounce reached Tuesday came as speculative traders in US gold futures and options raised their bullish bets and trimmed their bearish positions, new data from regulators showed Friday.

 Over the week-ending Tues 10 December, the so-called speculative “net long” of bullish minus bearish bets held in US gold derivatives by non-industry traders rose by more than one-fifth to a 3-week high.

 Equal to 184 tonnes by value, however, the net long speculative position on gold remained near multi-year lows, down by two thirds from the start of 2013.

 “If the Fed announces that it will be scaling back its bond purchases,” says Commerzbank in Germany, “[it] could pave the way for higher prices” as it removes uncertainty.

 “Tapering,” agrees a Singapore dealing desk in a note, “does not automatically mean a one-way bet on lower gold.”

 But while the US Fed “will likely not do anything at its meeting,” reckons INTL FCStone, a US brokerage and dealer, any “telegraphing” of its early 2014 intentions “will set up a weaker tone in gold heading into year-end, with a good chance that we could take out our 2013 lows in the process.”

 Last week J.P.Morgan analysts cut their 2014 average gold forecast by 10% to $1263 per ounce.

 2014 prices will average $1294 per ounce says Bank of America Merrill Lynch, repeating its forecast from September according to the Dubai Chronicle.

 “Bearish conditions persist,” says Swiss investment and London bullion bank UBS.

 “We see little to change our near-term outlook of being mildly bearish on gold,” agrees ANZ Bank’s precious metals note Monday.

 “Gold has trended downward since late August,” notes a technical analysis from Societe Generale.

 “Since late October, a steeper channel has traced but [now] a sideways market is possible.”

 Whatever the Fed decides Wednesday on its quantitative easing program, unemployment above 6.5% means the US zero interest-rate policy will remain “appropriate”, the central banks has repeated over the last 12 months, so long as inflation doesn’t rise above 3% or 4% per year.

 The latest US budget deal does not extend unemployment benefits launched in 2008 for the longer-term jobless.

 That means some 1.3 million people stand to lose benefits from December 28th, potentially knocking 0.2 or even 0.5 percentage points off the official US jobless rate, according to Goldman Sachs and J.P.Morgan analysts, currently at a 5-year low of 7.0%.

Adrian Ash

BullionVault

Gold price chart, no delay | Buy gold online


Adrian Ash is head of research at BullionVault, the secure, low-cost gold and silver market for private investors online, where you can fully allocated bullion already vaulted in your choice of London, New York, Singapore, Toronto or Zurich for just 0.5% commission.


(c) BullionVault 2013

Please Note: This article is to inform your thinking, not lead it. Only you can decide the best place for your money, and any decision you make will put your money at risk. Information or data included here may have already been overtaken by events – and must be verified elsewhere – should you choose to act on it.


France Falling Prey to Eurozone Slowdown Good News for U.S. Investors?

By for Daily Gains Letter

Good News for U.S. InvestorsThere’s an investment opportunity in the making at one of the eurozone nations for U.S. investors, and it’s becoming more compelling each passing day.

We know the eurozone still burns. The economic slowdown in the common currency region still prevails. We have heard from the European Central Bank (ECB) that it’s still trying to work very hard to break the strength of the economic slowdown. The central bank has lowered the benchmark interest rate and hinted that it might go ahead with a form of quantitative easing. In the past, we also heard the ECB say it will do whatever it takes to save the eurozone.

Sadly, it’s failing.

You see, when the eurozone crisis began, the problems were contained to a limited number of countries, but now we see the economic slowdown spreading through the region; now, the stronger eurozone nations are falling prey to it.

The opportunity? France.

France is the second-biggest economic hub in the eurozone. The economic slowdown in the French economy continues to gain strength. We heard that in the third quarter, the French economy contracted by 0.1%. In the second quarter, it showed growth of 0.5%. (Source: “French economy contracts 0.1 pct in third quarter,” Reuters, November 14, 2013.)

Unemployment in the French economy is also on the rise. In September, the unemployment rate in France reached 11.1%—that’s 3.26 million individuals who were out of work. In October, it declined to 10.9%, but that’s still higher than it was during the same period a year ago. In October of 2012, the unemployment rate in the second-biggest eurozone nation was 10.5%. (Source: “Euro area unemployment rate at 12.1%,” Eurostat web site, November 29, 2013.)

That isn’t all. Economic slowdown in the French economy is running deep, too. Industrial production is declining. In October, the industrial output in the French economy declined for the second straight month; it was down 0.3% in both September and October. (Source: “In October 2013, manufacturing output increased slightly (+0.4%),” National Institute of Statistics and Economic Studies web site, December 10, 2013.)

How does one actually profit from this situation?

As the economic slowdown in the French economy prevails, businesses in this eurozone nation will have troubles showing growth in their profits, and it won’t be surprising to see some register massive losses. As a result, their stock prices will decline—this is what’s creating the investment opportunity.

Why is it so compelling?

Please look at the chart below of the French CAC 40 index, the main stock index in the French economy, and pay attention to the circled area.

French CAC 40 Index Chart

Chart courtesy of www.StockCharts.com

Not too long ago, French stocks dropped below their 50-day moving average (MA)—a signal that suggests bearish pressure is mounting. The last time that French stocks touched their 50-day MAs, they found support and moved to the upside. This time, they have broken below and seem to be declining.

Investors in the U.S. may profit from this situation by shorting exchange-traded funds (ETFs) like iShares MSCI France (NYSEArca/EWQ). This ETF tracks the performance of stocks traded on the French stock market, so shorting it would let investors profit from the downside.


Source: http://www.dailygainsletter.com/investment-strategy/struggles-in-france-the-next-big-trade-for-u-s-investors/2223/


European Stocks Opens Lower Ahead of Fed Meeting

By HY Markets Forex Blog

European stocks opened lower on the first day of the trading week, as market participants focus on the anticipating meeting of the Federal Reserve (Fed) scheduled for December 17-18. Investors continue to speculate over whether the central bank would begin to scale-back on its monthly stimulus.

The pan-European Euro Stoxx 50 edged 0.2% lower at 2,922.40, while the German DAX declined 0.06% to 9,001.30.

At the same time, the French CAC 40 moved down 0.19% to 4,051.50, while the UK’s main gauge FTSE 100 fell 0.25% lower at 6,422.80.

The French flash manufacturing Purchasing Managers’ Index (PMI) dropped to 47.1 points in December, down from the previous reading of 48.4 in November and below forecast of 49.0 points, reports from the Markit Economics confirmed.

Meanwhile in Germany, the country is expected to report its manufacturing and services flash PMI reports at 8:30am GMT.  An increase of 53 in the manufacturing reading for December is expected, slightly up from the previous reading of 52.7 points in November, while services reading is expected to show a slight drop.

Markit Economic is expected to release the eurozone’s flash manufacturing and services PMI for this month later today.

The National Institute for Statistics (Istat) in Italy is expected to report the trade balance data for the month of October at the same time.

The President of the European Central Bank (ECB) Mario Draghi is expected to testify on monetary policy before the European Parliament’s Committee on Economic and Monetary Affairs in Brussels later during the day.

European Stocks – Federal Reserve Meeting

Members of the Federal Open Market Committee will meet for the final time this year for the Fed December meeting scheduled to begin Tuesday till Wednesday. The meeting will reveal clues as to when the central bank would begin to taper its monthly asset-purchasing program.

Some of the recent macroeconomic reports released are indicating a stronger recovery in the world’s largest economy. Analysts are expecting tapering to begin following the meeting, due to the improved labour market and the US budget deal concluded last week.


Win a luxurious trip to the Maldives & up to $30,000 cash for trading with us!

Visit for details http://alturl.com/2kysk 

The post European Stocks Opens Lower Ahead of Fed Meeting appeared first on | HY Markets Official blog.

Article provided by HY Markets Forex Blog

Yen Bounces Back After Positive Tankan Survey

By HY Markets Forex Blog

The Japanese yen bounced back from its recent lows against the US dollar on Monday, after BoJ reported that the country’s major manufacturers are in the best condition in six years.

The nation’s yen edged 0.38% higher to ¥102.83 at the time of writing, rebounding from last week’s lows as the greenback gained on ‘Fed-tapering’ speculation. The yen dropped to a five-year low of ¥103.92 on Friday

Approximately 34% of analysts forecasted that the US Federal Reserve (Fed) will probably decide to reduce $85 billion in monthly bond purchases at its December 17-18 meeting, while some traders are forecasting the US central bank would begin to taper its bond-buying program by March next year.

The Japanese currency was dragged lower on worries the nation’s economy won’t make it out of the 15-year deflation spiral. Concerns were raised after a worse-than-expected third quarter gross domestic product (GDP) data was reported.

However, on Monday the Bank of Japan (BoJ) released its Tankan survey, revealing upbeat results, as it reported sentiment among large-manufacturers rose to 16 points in the fourth quarter, the highest reading since December 2007 and surpassing forecast of 15. The Japanese currency initially weakened after the survey release.

Factory Sentiment

The outlook for next year’s first quarter came in below forecast, the reading came in at 14 points; rising from 11 points and below the forecasted reading of 17.

Bank of Japan (BoJ)

The Bank of Japan, which buys more than 7 trillion yen ($68 billion) of the country’s government bonds monthly, will begin its two-day meeting on December 19. The bank’s policymakers are expected to agree with upgrading their near-term assessment of the economy this month based on decent output and consumption data.

The Japanese yen dropped approximately 15.6% versus the greenback over the year measured on a total return basis.


Get $100 FREE Funded into your MT4 Account as well as many more amazing benefits! Register with HY Markets today.

http://www.hymarkets.com/english/reg/reg.hyml …


The post Yen Bounces Back After Positive Tankan Survey appeared first on | HY Markets Official blog.

Article provided by HY Markets Forex Blog

Best Days for Gains in Housing Stocks Behind Us?

By for Daily Gains Letter

Housing Stocks Behind UsMortgage rates are on the rise. In November, the 30-year fixed rate mortgage stood at 4.26% compared to 3.35% a year earlier in November 2012. The average rate for the 30-year fixed rate mortgage in 2007 prior to the subprime meltdown was 6.34%, according to data from Freddie Mac. (Source: “30-Year Fixed Mortgage Rates Since 1971,” Freddie Mac web site, last accessed December 13, 2013.)

Much of the decline in mortgage rates was driven by the Federal Reserve’s massive quantitative easing policies that saw the central bank buy $85.0 billion in bonds per month in an effort to drive down lending rates and drive up consumer demand in the housing market.

Yet after adding trillions to the balance sheet of the Fed, the housing market has recovered and is currently on pretty solid ground, with higher demand and prices.

But all of this bond buying will eventually stop and the impact will push mortgage rates higher. Of course, the amount by which bond buying is reduced will be dependent on the economic renewal and jobs market. I do not know how high mortgage rates will rise in one, two, or even five years, but they will move higher as long as the economy and jobs market continue to improve.

The housing market could easily absorb a small rise in mortgage rates, but with the lowest mortgage rates behind us for the time being, I suspect the housing market will inevitably slow down as far as home price increases and sales. This could take a few more years.

With the Fed expected to begin its bond tapering early in the New Year, I expect the 30-year fixed rate mortgage rate to continue to edge higher, along with bond yields.

The combination of higher bond yields and mortgage rates is not conducive to the kind of stock market and housing market rally we have seen since March 2009.

The best days for easy price gains in equities and the housing market are behind us. There will still be opportunities to make money in the stock market in 2014, but it will not be to the same degree that we are seeing this year, which means it will be more difficult to make stock market gains in 2014.

The housing market is also likely to see some flatness as we move into 2014. At least the flow of new homes coming onto the market could slow from the current torrid pace as mortgage costs rise. The rise in the price of homes will likely also slow from the previous year, but continue to be well below the crazy prices witnessed in 2006.

S&P Case-Shiller Home Price Index Chart

Chart courtesy of www.StockCharts.com

Home prices could eventually reach the 2006 levels again, but it will take some time. With the outlook for the housing market somewhat more muted in 2014, I would advise avoiding the homebuilders and continuing to add to the home supplies companies instead, such as The Home Depot, Inc. (NYSE/HD) and Lowes Companies, Inc. (NYSE/LOW). A good small-cap home supplies stock that also looks interesting is Builders FirstSource, Inc. (NASDAQ/BLDR).


Source: http://www.dailygainsletter.com/real-estate/best-days-for-gains-in-housing-stocks-behind-us/2226/

U.S. Misery Index Falls to Four-Year Low

By for Daily Gains Letter

U.S. Misery IndexIf you think you can judge a book by its cover, then you must believe the U.S. economy is doing really, really well. After all, consumer confidence is up and misery is down. However, looking past the cover, the pages of underlying economic indicators suggest the average American investor should be a little concerned.

But first, the good news! The U.S. Misery Index has fallen to a four-year low. The Misery Index is calculated by adding a country’s unemployment rate to the inflation rate, the logic being that we understand what stubbornly high unemployment mixed with the soaring price of goods translates into—misery.

The higher the score, the more miserable we are. For example, in August 2008, when the U.S. stock markets started to tank, the Misery Index stood at 11.47; when President Obama came to office in January 2009, it registered at 7.83; during the debt ceiling crisis in the summer of 2011, the index topped 12.87. Over the last three consecutive months, it’s been on the decline. In July, it came in at 9.36 and in October, it was 8.3. (Source: “Misery Index by Month,” United States Misery Index web site, last accessed December 13, 2013.)

According to the widely followed Thomas Reuters/University of Michigan preliminary December consumer confidence index, consumer confidence rose to 82.5—the strongest reading since July. In November, consumer confidence was 75.1, according to the index; economists were predicting a reading of 76.0.

Why the increased optimism? American consumer confidence levels are improving thanks to the better-than-expected drop in November unemployment, improved non-farm employment numbers, and strong preliminary gross domestic product (GDP) results. Stronger-than-expected consumer confidence readings are good news for retailers while consumers debate how much they should spend during this holiday shopping season.

However, that robust consumer confidence reading might be a little premature.

While unemployment numbers came in better than expected, the unemployment rate is still at seven percent, job openings are scarce, and wages are stagnant. Despite improving consumer confidence, 25% of Americans expect to miss a credit card payment in the near future, and even more say they need to cut back on credit card spending. That might be tough with 19% saying that they’re being forced to use their credit cards more often as a result of the bad economy. (Source: Rasmussen Reports web site, last accessed December 13, 2013.)

So why the increased consumer confidence? If it’s not because of Main Street, it must be due to Wall Street; after all, the S&P 500 is up 26% so far this year and the Dow Jones Industrial Average is up more than 21%. If you take a look at the stock market, everything looks amazing! Unfortunately, corporate profits aren’t really benefiting too many people.

Corporate Profits vs. GDP vs Labor Income Chart

As you can see from the chart above, since the start of the 21st century, it’s fair to say there has been an increasing discrepancy between labor income and corporate profits, especially since the so-called economic “recovery.” Labor income and GDP really have been pretty flat since the markets crashed. Corporate profits, not so much.

Distribution of Stock Market Wealth Chart

When it comes to the stock market and labor market, it looks like the stock market won. That’s good news for the wealthier top 10% of the country who hold roughly 80% of all stock market wealth. (You can see the further distribution of stock market wealth in the chart above.)

There is more reason to question the current consumer confidence sentiment. For the last four quarters, or all of 2013, more and more companies on the S&P 500 have been revising their earnings downward: 78% in Q1, 81% in Q2, 83% in Q3, and 89% (so far) in Q4.

These numbers aren’t the building blocks for sustained economic growth, nor are they justification for the improving consumer confidence numbers.

Where does that leave investors? For starters, credit card companies like Visa Inc. (NYSE/V), MasterCard Incorporated (NYSE/MA), and American Express Company (NYSE/AXP) might be worth researching a little.

Those suspicious of the upward tick in consumer confidence might want to consider looking at defensive consumer staple exchange-traded funds, like Consumer Staples Select Sector SPDR (NYSEArca/XLP).


Source: http://www.dailygainsletter.com/stock-market/u-s-misery-index-falls-to-four-year-low/2218/


Forex Technical Analysis 16.12.2013 (EUR/USD, GBP/USD, USD/CHF, USD/JPY, AUD/USD, GOLD)

Article By RoboForex.com

Analysis for December 16th, 2013

EUR/USD

Euro is still forming the fifth ascending wave with target at 1.4100; short-term trend is still bullish. We think, today price may grow up and reach new maximum. Alternative scenario implies that pair may start correction. We should note, that any correction may be considered as an opportunity to increase long positions. If price really starts new correction, its target will be at 1.3555.

GBP/USD

Pound fell down and completed the first wave, which may be considered as correction. We think, today price may move upwards and reach level of 1.6400. one should note, that market is moving inside the third ascending wave and this correction may be considered as link structure and take the form of either one wave or five-wave structure with target deep 1.6100. Any correction is an excellent opportunity to increase long positions. Predicted target of the growth is at 1.7150.

USD/CHF

Franc continues moving inside descending structure. Right now, market is forming another consolidation channel, which looks a bit like divergent triangle pattern. Any attempts of price to start ascending movement may be considered as an opportunity to increase long positions. We think, today price may fall down and reach level of 0.8820.

USD/JPY

Yen started forming descending impulse. We think, today price may extend it to reach level of 102.58 and then return to level of 103.37. Later, in our opinion, pair may continue moving inside down trend. The first target of this descending movement is at 99.70.

AUD/USD

After reaching its another target, Australian Dollar is forming consolidation channel to continue falling down. Next target is at 0.8720. Alternative scenario implies that pair may return to 0.9046 and then continue moving inside down trend.

GOLD

Gold continues forming consolidation channel; market reached new minimum and maximum of this consolidation, which may be considered as divergent triangle pattern. We think, today price may price may form new structure to reach new minimum and then rebound from level of 1223 downwards. Later, in our opinion, instrument may complete this descending wave by falling down and reaching 1195, and then form reversal structure for new ascending movement.

RoboForex Analytical Department

Article By RoboForex.com

Attention!
Forecasts presented in this section only reflect the author’s private opinion and should not be considered as guidance for trading. RoboForex LP bears no responsibility for trading results based on trading recommendations described in these analytical reviews.