Currency Speculators turned bullish on US Dollar bets, Euro drops to the bearish side

By CountingPips.com

cot-values

The latest data for the weekly Commitments of Traders (COT) report, released by the Commodity Futures Trading Commission (CFTC) on Friday, showed that large traders and speculators turned around their bets to become bullish on the US dollar last week.  The previous four weeks had seen speculators and traders on the bearish side.

Non-commercial large futures traders, including hedge funds and large International Monetary Market speculators, had an overall US dollar long position totaling $4.51 billion as of Tuesday May 13th, according to the latest data from the CFTC and calculations by Reuters. This was a weekly change of +$6.54 billion from the -$2.03 billion total short position that was registered on May 6th, according to Reuters that totals the US dollar contracts against the combined contracts of the euro, British pound, Japanese yen, Australian dollar, Canadian dollar and the Swiss franc.

The US dollar aggregate bullish position is the highest USD level since March 11th when total bullish contracts equaled +$10.56 billion.  The bullish gain of $6.54 billion was the largest weekly increase since November 12th 2013 when positions jumped by $7.44 billion for the week.

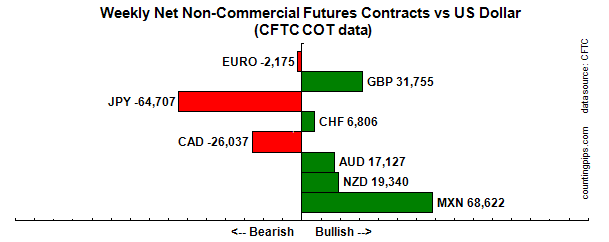
Overall for the week against the other major currencies, speculators bet in favor the Canadian dollar, Australian dollar and the Mexican peso last week while there were weekly declines for the euro, British pound sterling, Japanese yen, Swiss franc and the New Zealand dollar.


cot-standings

Notable changes:

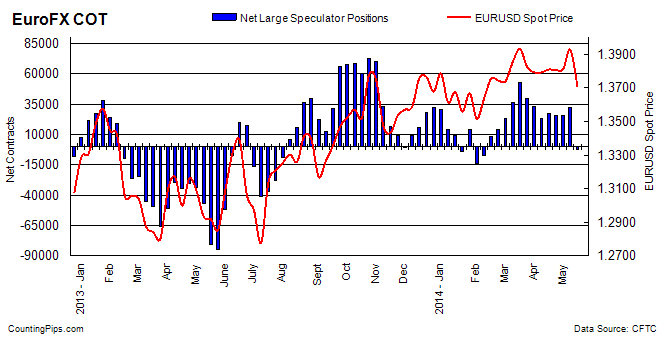
  • Euro positions fell sharply over to the bearish side for the first time since February 2nd as the European Central Bank suggested they were open to easing monetary policy in June
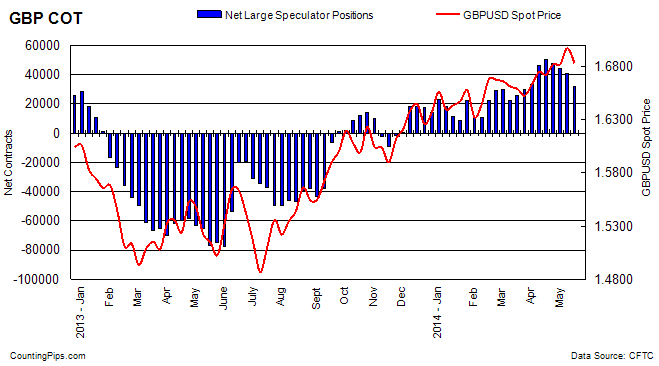
  • British pound sterling positions fell for a 4th straight week after reaching a multi-year high on April 15th
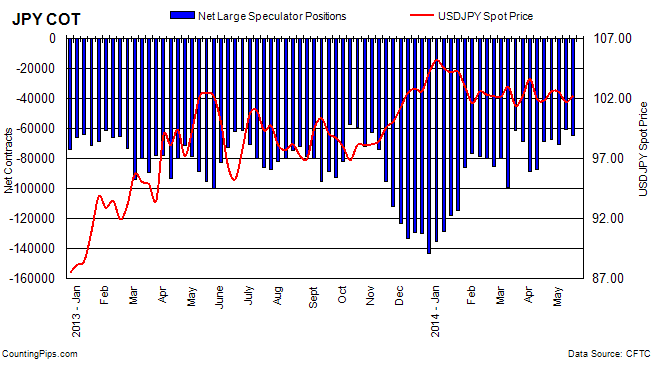
  • Japanese Yen net positions added bearish positions after touching the lowest bearish level since October 15, 2013 the previous week
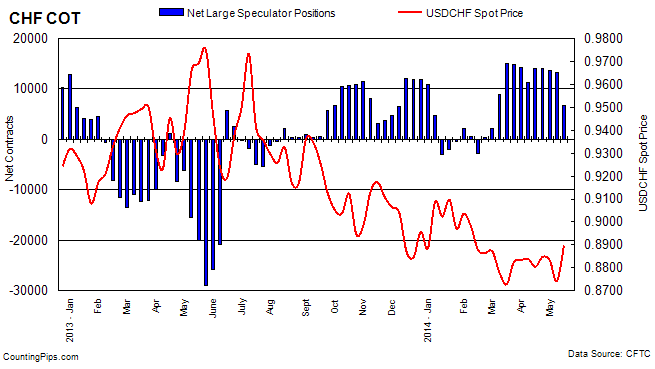
  • Swiss franc bullish positions declined by roughly half last week to +6,806 contracts
  • Australian dollar net positions rose to their best level since April 30th 2013 after turning bullish on April 8th
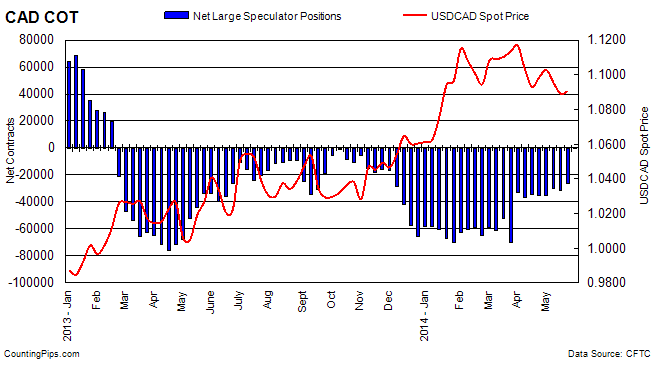
  • Canadian dollar positions, still bearish at -26,037 contracts, stood at the least bearish position since November 2013


* All currency positions are in direct relation to the US dollar where, for example, a bet for the euro is a bet that the euro will rise versus the dollar while a bet against the euro will be a bet that the dollar will gain versus the euro. Please see charts and data below.


Weekly Charts: Large Speculators Weekly Positions vs Currency Spot Price

EuroFX:

eurofx

Last Six Weeks data for EuroFX futures

DateOpen InterestLong SpecsShort SpecsLarge Specs NetWeekly Change
04/08/2014261439926356933523300-9938
04/15/201427072210625278564276884388
04/22/20142662591012047543025774-1914
04/29/20142715151022857655125734-40
05/06/201427701311067378122325516817
05/13/20142681428438386558-2175-34726


British Pound Sterling:

gbp

Last Six Weeks data for Pound Sterling futures

DateOpen InterestLong SpecsShort SpecsLarge Specs NetWeekly Change
04/08/201422666791642451654647712905
04/15/20142266888747236874505984121
04/22/2014237055896924189247800-2798
04/29/2014236030859134167944234-3566
05/06/2014241264837944314840646-3588
05/13/2014230333711683941331755-8891


Japanese Yen:

jpy

Last Six Weeks data for Yen Futures

DateOpen InterestLong SpecsShort SpecsLarge Specs NetWeekly Change
04/08/201418181413340100802-874621176
04/15/20141648431435183067-6871618746
04/22/20141656741656483807-672431473
04/29/20141688201384684198-70352-3109
05/06/20141670932038181109-607289624
05/13/20141647071747182178-64707-3979


Swiss Franc:

chf

Last Six Weeks data for Franc futures

DateOpen InterestLong SpecsShort SpecsLarge Specs NetWeekly Change
04/08/20144475219275794011335-2896
04/15/201448976239059839140662731
04/22/20144688821732770914023-43
04/29/20144742421960825713703-320
05/06/201455538251021191813184-519
05/13/20144528216951101456806-6378


Canadian Dollar:

cad

Last Six Weeks data for Canadian dollar futures

DateOpen InterestLong SpecsShort SpecsLarge Specs NetWeekly Change
04/08/20141203362870463011-343072687
04/15/20141195252828863714-35426-1119
04/22/20141187072752962984-35455-29
04/29/20141235893009360388-302955160
05/06/20141222872804459644-31600-1305
05/13/20141216322698653023-260375563


Australian Dollar:

aud

Last Six Weeks data for Australian dollar futures

DateOpen InterestLong SpecsShort SpecsLarge Specs NetWeekly Change
04/08/201496887376303432033108190
04/15/201498933404633236680974787
04/22/20141076964954033170163708273
04/29/2014109934500193931310706-5664
05/06/201410493644805361688637-2069
05/13/20141073025014733020171278490


New Zealand Dollar:

nzd

Last Six Weeks data for New Zealand dollar futures

DateOpen InterestLong SpecsShort SpecsLarge Specs NetWeekly Change
04/08/201432898265216755197661286
04/15/2014331002667168241984781
04/22/20143257926056588120175328
04/29/20142985822979449918480-1695
05/06/201433025250274334206932213
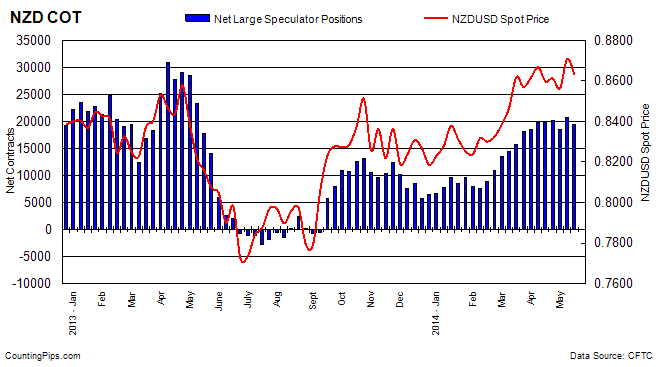
05/13/20143093223806446619340-1353


Mexican Peso:

mxn

Last Six Weeks data for Mexican Peso futures

DateOpen InterestLong SpecsShort SpecsLarge Specs NetWeekly Change
04/08/201413033170371138705650134717
04/15/2014131412710381680154237-2264
04/22/2014128932683291481853511-726
04/29/2014128100680731845549618-3893
05/06/2014146455676631977947884-1734
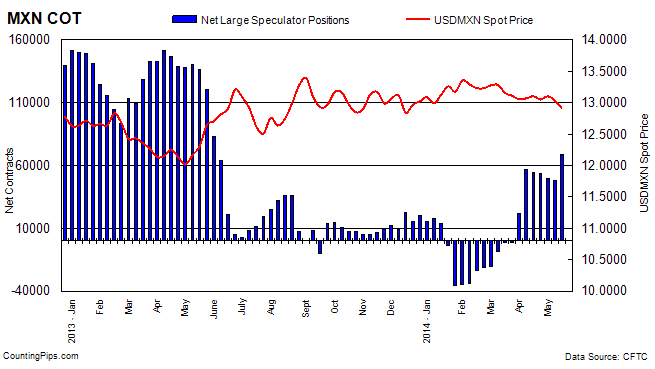
05/13/201414920986137175156862220738


*COT Report: The weekly commitment of traders report summarizes the total trader positions for open contracts in the futures trading markets. The CFTC categorizes trader positions according to commercial hedgers (traders who use futures contracts for hedging as part of the business), non-commercials (large traders who speculate to realize trading profits) and nonreportable traders (usually small traders/speculators).

The Commitment of Traders report is published every Friday by the Commodity Futures Trading Commission (CFTC) and shows futures positions data that was reported as of the previous Tuesday (3 days behind).

Each currency contract is a quote for that currency directly against the U.S. dollar, a net short amount of contracts means that more speculators are betting that currency to fall against the dollar and a net long position expect that currency to rise versus the dollar.

(The graphs overlay the forex spot closing price of each Tuesday when COT trader positions are reported for each corresponding spot currency pair.)

See more information and explanation on the weekly COT report from the CFTC website.


Article by CountingPips.comForex Apps & News

US 10-Year Treasury Note Speculators sharply decreased their bearish positions

By CountingPips.com

Weekly CFTC Net Speculator Report


10yr

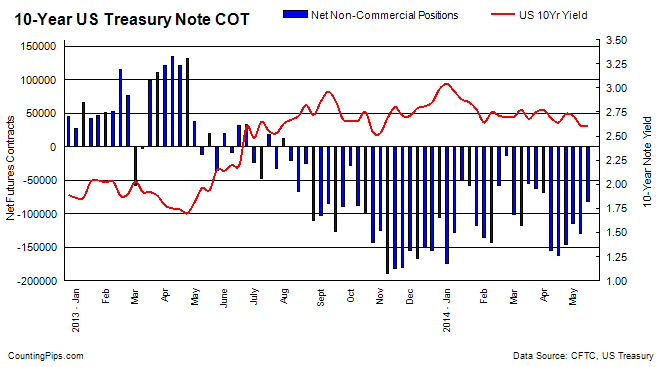
Large Speculators net bearish positions rise to a total of -129,409 contracts

10 Year Treasuries: Large futures market traders and speculators reduced their overall bearish bets in the 10-year treasury note futures last week to the lowest level in six weeks, according to the latest Commitment of Traders (COT) data released by the Commodity Futures Trading Commission (CFTC) on Friday.

The non-commercial futures contracts of the 10-year treasury notes, primarily traded by large speculators and hedge funds, totaled a net position of -82,180 contracts in the data reported for May 13th. This was a change of +47,229 contracts from the previous week’s total of -129,409 net contracts that was recorded on May 6th.

The 10-Year Note non-commercial net bearish positions are now at their lowest level since April 1st when total net positions equaled -68,776 contracts.

Over the weekly reporting time-frame, from Tuesday May 6th to Tuesday May 13th, the yield on the 10-Year treasury note showed no change at the 2.61 level, according to data from the United States Treasury Department.


Last 6 Weeks of Large Trader Non-Commercial Positions

DateOpen InterestLong SpecsShort SpecsNet Large SpecsWeekly Change10 Year Yield
04/08/20142572114327159482333-155174-863982.69
04/15/20142497347344056506334-162278-71042.64
04/22/20142493544349474495339-145865164132.73
04/29/20142528687332918447343-114425314402.71
05/06/20142618485340698470107-129409-149842.61
05/13/20142735107421083503263-82180472292.61


*COT Report: The weekly commitment of traders report summarizes the total trader positions for open contracts in the futures trading markets. The CFTC categorizes trader positions according to commercial hedgers (traders who use futures contracts for hedging as part of the business), non-commercials (large traders who speculate to realize trading profits) and nonreportable traders (usually small traders/speculators). Find CFTC criteria here: (http://www.cftc.gov/MarketReports/CommitmentsofTraders/ExplanatoryNotes/index.htm).


Article by CountingPips.comForex Trading Apps


VIX Futures Speculators raised bearish positions to highest since September in COT data

By CountingPips.com

Weekly CFTC Net Speculator VIX Report


vix


VIX Futures Contracts: Large traders and speculators added to their overall bearish bets in the VIX futures market last week for a third straight week and to the highest level since September, according to the latest data from the Commodity Futures Trading Commission (CFTC) released on Friday.

The VIX non-commercial futures contracts, comprising of large speculator and hedge fund positions, totaled a net bearish position of -82,686 contracts in the data reported for May 13th. This was a change of -19,220 contracts from the previous week’s total of -63,466 net contracts that was registered on May 6th.

The third straight weekly increase in bearish positions brings overall net contracts to the highest bearish level since September 17th 2013 when net positions stood at a level of -91,017 contracts.

Meanwhile, the VIX index over the same reporting time-frame last week edged lower from a 13.80 reading on Tuesday May 6th to a 12.13 reading on Tuesday May 13th, according to the Chicago Board Options Exchange (CBOE) Volatility Index.


Last 6 Weeks of Large Trader Positions

DateOpen InterestLong SpecsShort SpecsNet Non-CommercialsWeekly ChangeVIX Score
04/08/2014359952105096136842-31746-117314.89
04/15/201436888796296132242-35946-420015.61
04/22/2014362130106598140655-34057188913.19
04/29/2014365215110843156329-45486-1142913.71
05/06/2014391848104252167718-63466-1798013.80
05/13/2014419669111532194218-82686-1922012.13

*COT Report: The weekly commitment of traders report summarizes the total trader positions for open contracts in the futures trading markets. The CFTC categorizes trader positions according to commercial hedgers (traders who use futures contracts for hedging as part of the business), non-commercials (large traders who speculate to realize trading profits) and nonreportable traders (usually small traders/speculators). Find CFTC criteria here: (http://www.cftc.gov/MarketReports/CommitmentsofTraders/ExplanatoryNotes/index.htm).


Article by CountingPips.comForex Apps & Analysis


Crude Oil Speculators added to net bullish positions last week

By CountingPips.com

Weekly CFTC Net Speculator Crude Oil Report

crudeoil

CRUDE OIL: Large futures market traders and speculators raised their overall bullish bets in crude oil futures last week after declines the previous two weeks, according to the latest Commitment of Traders (COT) data released by the Commodity Futures Trading Commission (CFTC) on Friday.

The non-commercial contracts of crude oil futures, primarily traded by large speculators and hedge funds, rose to a total net position of +387,739 contracts in the data reported for May 13th. This was a change of +4,646 contracts from the previous week’s total of +383,093 net contracts for the data reported through May 6th.

Last week’s modest increase brings non-commercial net positions back from the lowest level since February 11th when net positions totaled +382,334 contracts.

Over the same weekly reporting time-frame, from Tuesday May 6th to Tuesday May 13th, the crude oil price gained from $99.81 to $101.86 per barrel, according to Nymex futures price data from investing.com. Brent crude prices, meanwhile, also showed a rise from $107.12 to $108.67 per barrel from Tuesday May 6th to Tuesday May 13th, according to prices from investing.com.

Last 6 Weeks of Large Trader Non-Commercial Positions

DateOpen InterestLong SpecsShort SpecsNet Non-CommercialsWeekly ChangeOil Price
04/08/201416554725120351122483997878004102.33
04/15/201416742765234901139394095519764103.78
04/22/20141619737517023106898410125574101.92
04/29/20141651521522018119691402327-7798100.58
05/06/20141638412492901109808383093-1923499.81
05/13/201416274034950801073413877394646101.86

*COT Report: The weekly commitment of traders report summarizes the total trader positions for open contracts in the futures trading markets. The CFTC categorizes trader positions according to commercial hedgers (traders who use futures contracts for hedging as part of the business), non-commercials (large traders who speculate to realize trading profits) and nonreportable traders (usually small traders/speculators). Find CFTC criteria here: (http://www.cftc.gov/MarketReports/CommitmentsofTraders/ExplanatoryNotes/index.htm).

Article by CountingPips.comForex Trading News


Gold Speculators trim bullish bets following 3 weeks of rises

By CountingPips.com

Weekly CFTC Net Speculator Gold Report

gold

GOLD: Futures market traders and large speculators decreased their net bullish bets in the gold futures market last week after traders had raised their bullish positions for the previous three weeks, according to the latest Commitment of Traders (COT) data released by the Commodity Futures Trading Commission (CFTC) on Friday.

The non-commercial futures contracts of Comex gold futures, traded by large speculators and hedge funds, totaled a net position of +91,634 contracts in the data reported through May 13th. This was a change of -6,322 contracts from the previous week’s total of +97,956 net contracts that was registered on May 6th.

The gold non-commercial net positions stood at the highest level since April 1st before last week’s decrease.

Over the weekly reporting time-frame, from Tuesday May 6th to Tuesday May 13th, the gold price declined from $1,307.60 to $1,295.20 per ounce, according to gold futures price data from investing.com.


Last 6 Weeks of Large Trader Non-Commercial Positions

DateOpen InterestLong SpecsShort SpecsNet Non-CommercialsWeekly ChangeGold Price
04/08/20143654001496936109488599-115461310.10
04/15/20143695771474326814079292-93071302.90
04/22/2014372593146880650478183325411284.90
04/29/2014378092147769625428522733941296.20
05/06/20144047001609826302697956127291307.60
05/13/20143970291571766554291634-63221295.20

*COT Report: The weekly commitment of traders report summarizes the total trader positions for open contracts in the futures trading markets. The CFTC categorizes trader positions according to commercial hedgers (traders who use futures contracts for hedging as part of the business), non-commercials (large traders who speculate to realize trading profits) and nonreportable traders (usually small traders/speculators). Find CFTC criteria here: (http://www.cftc.gov/MarketReports/CommitmentsofTraders/ExplanatoryNotes/index.htm).

Article by CountingPips.comForex Trading Apps


Thoughts from the Frontline: Special Updates from the Strategic Investment Conference: Day 1

By Worth Wray

Good morning from sunny San Diego, California!

As the sun rises on the second day of the Strategic Investment Conference, I am absolutely blown away. John and Altegris put on an amazing show, and this is simply unlike any investment conference I have ever attended.

Let me explain…

In my experience, these industry events are usually more about networking than content. I go to investment conferences in hopes of expanding my thinking and challenging my preconceived ideas about the world… but all too often I find myself sitting in half-empty auditoriums listening to rock-star economists who are resting comfortably on their laurels rather than bringing their A-games.

At your average conference, over the course of several days and several dozen presentations, I usually expect to hear only a handful of truly original ideas… but not here. Here, I can hardly keep up.

Instead of skipping sessions to explore the resort or lounge by the pool, here everyone stays in the room. It’s so refreshing to see 650 people guarding their seats, hanging on every word, and drinking from a fire hose of transformational ideas.

Day 1 started off with the king of modern-day economists, David Rosenberg, who goes on ruffling a lot of feathers. Rather than obsessing over whether the state of the global economy is good or bad, Dave challenged us to see beyond the deflationary headwinds and focus on how things are changing at the margin. Markets move as things get better or worse; and at the margin, Dave argues, inflation pressures are building. I know this sounds odd to a lot of us who are still worried about deflation; but Dave notes that out of 140MM workers in the large, insulated US economy, roughly 40MM higher-skilled workers have the bargaining power to push wages higher and turn the inflationary dial… even as low- and medium-skilled workers see their wages decline.

Next up, we had an epic debate between Bloomberg Senior Economist Rich Yamarone and Jefferies Chief Market Strategist, David Zervos. Rich is worried that after six years of fragile growth, the US economy is prone to recession and skating on very line ice. He argues that the middle class is getting hollowed out, because no positive wage pressure can be exerted by the vast majority of Americans. More people are being forced to take multiple jobs to make ends meet, in part because the Affordable Care Act is changing the way businesses employ nonessential workers.

With his thumb on the pulse of the real economy through his Orange Book research, Yamarone gives us his top five real-world indicators, which tell a story very different from the official macro data. Meanwhile, in high spirits and with a powerful faith in central banks, Zervos exhorts us to be lovers, not haters. Deflation cannot take hold, he asserts, as long as the Federal Reserve is pouring money into the system. Today, sitting in low-volatility cash is more dangerous than being in higher-volatility stocks, he argues. David laid out two choices and encouraged the crowd to pick a path.

Then we moved on to a comprehensive look at the global economy as the always brilliant Grant Williams and Jonathan Tepper took the stage to share their ideas about China, Japan, Europe, and other markets. Jonathan argued that low volatility and tight European credit spreads are not necessarily signs of lasting recovery but rather the sort of irrational calm that always comes before a crisis. Expanding on Jonathan’s point, Grant warned that if and when this bubble of complacency pops, the impact will shake the world. And then he explained how sudden shifts in confidence in China and Japan could tip off the next global panic.Patrick Cox, who writes Mauldin Economics’ Transformational Technology Alert, ran(!) us through a jaw-dropping, hugely inspiring PowerPoint show and commentary, one of the highlights of which was his prediction that the US energy boom will enable the widespread adoption of robotics here, which will reverse 40+ years of manufacturing outsourcing.

We heard from several other excellent speakers during the day, including Gary Shilling, and Vice Admiral Robert Harward… a great American who once commanded the Navy SEALS and who gave us all hope that with the support of the greatest warriors in human history, America’s best days lie ahead.

There’s lots more I could share with you about yesterday’s developments, but it’s time to hit the send button. John Mauldin is about to take the stage with one of the most powerful presentations I have ever seen, and I don’t want to miss a second. We have been working on this speech for more than six weeks, and I am inspired by his ability to find hope in the midst of debt-related worries and to look into and through the macro chaos to give us a profoundly positive vision of the future.

Thankfully, I have not had to take copious notes, because there’s no way the pace of this event would allow me to keep up with all the information coming at me.  To fill in the blanks, I’ll be able to refer to the recordings of all the authorized presentations from the event when my MP3/CD Audio Set arrives in a few weeks.  If you couldn’t make it to SIC but want to tune in to the insights shared by 20 of the world’s top independent thinkers, you can order the audio set here today at our discounted pre-event price. Based on what I’ve already experienced at the conference, I can tell you the SIC Audio Set will be loaded with invaluable information and worth every penny.

Thanks again for your support, and I hope you can join us next year!


Worth Wray
Chief Strategist, Mauldin Companies


How to Manage a Crisis… Before It Happens

By Dennis Miller, millersmoney.com

My wife Jo and I live in Central Florida, and having ridden out a few hurricanes in our lives, we’re as well prepared as we can be for emergencies. We have, among other things, a generator, food, batteries, candles, and a water purification kit.

My wife and I visited Punta Gorda, FL, after the town suffered severe hurricane damage in 2004. After driving one block to the grocery store, we raced out of there with burning eyes and handkerchiefs covering our noses and mouths. We immediately drove back to the motel, changed our clothes, and put what we were wearing in a plastic bag. We’d never seen anything like that before, and it left quite an impression.

Realistically, the chance of a hurricane doing that kind of damage to us is small—we’re over 50 miles inland from both coasts and 70 feet above sea level. However, in 2004, the eye of three hurricanes passed right over our little town for the first time in recorded history, so even if the probability is less than 1%, the fallout would be so bad that we prepare anyway.

What about a financial catastrophe? How well prepared do you need to be?

Folks near my age have lived through a few bubbles and the subsequent crashes and recoveries. Though we never experienced “the Big One” as our parents did in the 1930s, which was so bad that it shaped the attitudes and values of a couple of generations.

In a full-blown financial crisis, your material world collapses. It might come on the heels of medical problems and the resulting high bills and lost income, or it might come in tandem with runaway inflation or a political meltdown.

Financial Preparation

A full-blown financial crisis often develops so stealthily that only the most observant people will know what hit them, and it typically affects everyone. Those who prepared well are likely to fare much better and avoid the catastrophic consequences, which brings us to core holdings.

Core holdings are, quite literally, survival insurance. They are assets we sock away and hope we never have to sell. They should make up 10% of your overall net worth and be diversified in form and location.

In light of the warning signs that we see in the economy and the stock market, now is a good time to review your own core holdings.

What types of investments should be in that category depends on the type of risk you’re trying to protect against.

Protecting Against Inflation

Start with precious metals—gold and silver, in particular. I recommend starting with “junk silver,” which you should be able to buy locally. Then add gold, silver, and platinum bullion coins. One of the best ways to buy competitively is to go to a coin show. You will find several dealers displaying their wares and can quickly determine the market price.

You can also buy bullion from reputable dealers online, and as you increase your holdings, consider holding some metal internationally. (For the best ways to invest in gold, see the free special report, The 2014 Gold Investor’s Guide.

Don’t confuse these holdings with exchange-traded funds like GLD. Those are not core holdings. They are paper investments purchased with the intention of selling them for a profit at a later date. While they may (or may not) move consistently with metal prices, your paper is not redeemable for metal. You may want to own these in your portfolio just like any other asset you think will go up in value.

Your core holdings, however, need not be limited to metals. We hold foreign-currency-denominated CDs from EverBank that are FDIC-insured in ours. While their yield is currently low, we hold them as a hedge against inflation.

When the US dollar buys less, certain foreign currencies increase in value and will buy more. By way of example, I have held Swiss francs for years. They used to be worth $0.80 to the dollar; now they are worth more than $1.10.

Farmland is another great hedge against inflation. It’s a valuable asset and is in limited supply. There’s no new land growing in Kansas.

Protecting Against Confiscation

Historically, governments have resorted to extreme measures like confiscation when their debt load gets out of hand. Confiscation can take more than one form.

In 1933, President Roosevelt, by Executive Order 6102, made it illegal to own gold. It required everyone to deliver all of their gold coins, bullion, and certificates to the Federal Reserve, in exchange for $20.67 per ounce. Once people had surrendered their gold, the government raised its official price from $20.67 to $35 per ounce. Does that mean gold went up in value overnight? No, the value of the dollar went down.

A second form of confiscation is taxes, sometimes marketed as “emergency taxes.” A government that is spending more than it takes in will eventually have its day of reckoning. Fearing a collapse, they’ll resort to extreme measures. I wrote about the confiscation in Cyprus last year, and we are seeing similar things happening in Argentina. Who are the targets? Anyone with money.

While no one can predict for sure what our government will do, prudent investors diversify some of their investment capital offshore. The example of Cyprus has shown that those who moved some of their money offshore were spared. Once the government shut the currency window, however, it was too late for the others.

How Bad Could Things Get?

I have no idea. When I attended the 2011 Casey Fall Summit, three of the speakers described what it was like to live through hyperinflation. Argentina has already confiscated much of its citizens’ retirement plans, forcing them to invest in government debt.

The speaker from Yugoslavia shared the following slide showing the magnitude of hyperinflation in his country:

Of course we can’t say for sure that hyperinflation will or will not happen in the United States. But the Federal Reserve had been in business for 95 years and had $800 billion on its balance sheet as recently as 2007. Now it has $4 trillion, which is somewhere between a 400- and 500-year money supply. The minute the world loses confidence in the dollar or it loses its status as the world’s reserve currency, the decline in purchasing power could be horrendous.

Even if the probability of hyperinflation is tiny, remember that your biological clock is ticking. You may be close to leaving the workforce or already out. The adverse consequences of high inflation, hyperinflation (which are two different conditions), and/or outright government confiscation of wealth are so catastrophic that an unprepared investor may never be able to recover. That could mean bunking in your adult child’s guest room instead of doing the million fun things you’d planned for retirement.

It’s time to make sure your core holdings are where they need to be, just in case. Jo and I review our financial holdings each year at tax time. That reminds me… We store our emergency food and mark the expiration date on the cases. About a month before expiration, we load the cases in the van and take them to the local food bank, then head to Sam’s Club to reload.

Hurricane season will be here before you know it. It’s time to check your inventory.

There are countless ways to protect yourself from a financial crisis—and only a few are mentioned here. The Miller’s Money team is constantly on the lookout for the best ways to protect and grow your nest egg. Sign up for our free e-letter, Miller’s Money Weekly, today.


The article How to Manage a Crisis… Before It Happens was originally published at millersmoney.com.

Central Bank News Link List – May 17, 2014 – Turkey inflation to peak soon, central bank’s Basci says

By CentralBankNews.info

Here’s today’s Central Bank News’ link list, click through if you missed the previous link list. The list comprises news about central banks that is not covered by Central Bank News. The list is updated during the day with the latest developments so readers don’t miss any important news.

Pakistan holds rate, stays vigilant to keep low inflation

By CentralBankNews.info
    Pakistan’s central bank maintained its policy rate at 10.0 percent, as expected by most economists, saying recent improvements in economic confidence, foreign exchange reserves and low inflationary pressures need to be nurtured to ensure their sustainability.
     The State Bank of Pakistan (SBP), which has held its rate steady since raising it by 100 basis points in 2013, said average inflation in the current 2013/14 fiscal year has remained volatile – due to expected movements in food prices and administered prices – but still in single digits “and policy vigilance is required for this trend to continue.”
    Average consumer price inflation in the 2013/14 fiscal year from July 1, 2013 through April, was 8.7 percent, above the bank’s target of 8.0 percent but well below the bank’s forecast from March of inflation between 10 and 11 percent.
   For fiscal 2015, the central bank expects average inflation of around 8.0 percent based on moderate aggregate demand, a deceleration in broad money growth due to contained government borrowing, expectations of low inflationary pressure and a stable outlook for international commodity prices.
    Headline inflation in Pakistan rose to 9.18 percent in April from 8.53 percent in March, with core inflation also rising to 8.50 percent from 7.6 percent. Over the last 12 months core inflation has remained stable around 8.0 percent.

    Indicators of Pakistan’s economic activity are improving, but the central bank said “further reforms, especially in the energy sector, would help consolidated the momentum” and “improvement in productivity and competitiveness is a must to continue to build foreign exchange reserves in the medium term while meeting external obligations.”
    Provisional estimates show growth in Pakistan’s Gross Domestic Product in fiscal 2014 of 4.1 percent, slightly above the SBP’s forecast in its latest quarterly report of 3-4 percent.
    In 2012/13 the economy expanded by 3.6 percent, down from 4.4 percent in 2011/12 but broadly similar to 2010/11’s 3.7 percent.
    Earlier this month in Dubai the International Monetary Fund forecast that Pakistan’s GDP would expand by 3.3 percent in the current fiscal year, accelerating to 4 percent next year.
    In its statement in connection with the IMF’s third review of Pakistan’s extended fund facility from May 1-9, the IMF “urged the SBP to remain vigilant on recent inflationary pressures in their monetary policy decisions, while containing their ambitious program to rebuild reserves.”
   “For FY2014/15, the authorities should target an additional reduction in inflation towards their medium-term goal of 6-7 percent,” the IMF said.
    Economic growth this year is being led by a 5.8 percent rise in industrial sector output, the SBP said, adding that private credit also points toward improved economic activity.
    In the first nine months of fiscal 2013/14, net credit to the private sector was almost 2-1/2 times more than the same period last year and the monthly average of gross credit disbursements, were around 150 billion rupees higher this year, the SBP said.
    “These trends show that the interest rate is only one factor in affecting economic activity,” the SBP said, adding improved sentiment, a better availability of energy, and lower government borrowing from the banking system has encouraged the private sector.
    “The continuation of these trends, however, would require a sustained effort to ease impediments to growth through implementation of necessary reforms,” the bank said, particularly in the energy sector where reforms can help raise productivity, ease the fiscal burden and reduce the import bill.
    Pakistan’s trade deficit remained high at US$12.2 billion in the first nine months of 2013/14, but helped by robust growth in workers’ remittances, the current account deficit of $2.3 billion “seems quite manageable at this point in time,” the SBP said.
    Pakistan’s foreign exchange reserves surged to $8.0 billion by May 9 from $5.4 billion end-March, helped by better-than-projected inflows from the issuance of euro bonds of $2 billion and other inflows from multilateral sources.
    “This marked improvement in reserves and the consequent stability in the foreign exchange market is the main indicator of improved sentiments in and about the economy,” the SBP said, adding that positive sentiment could help attract further financial inflows and boost reserves more.
    After tumbling in 2008, the depreciation of the Pakistani rupee has been steady in recent years as it  fell by 27 percent from 79 to the U.S. dollar in early 2009 to 108 by early December 2013.
    But since Dec. 4, 2013 the rupee has gained strength, and was trading at 98.5 to the dollar on Friday, up 6.5 percent this year.
    The SBP said the rupee’s real effective exchange rate had appreciated by 8.0 percent in the third quarter of fiscal 2013/14 and cautioned that “its potential impact on the trade balance needs to be monitored carefully going forward.”
   
    http://ift.tt/1iP0FNb

The State of the Market

By MoneyMorning.com.au

Each January, except in a year following a general election, the US president delivers the State of the Union address.

It usually involves the president saying, ‘The State of the Union is strong’.

They’ll say it’s strong even if the Union isn’t strong.

So as we begin the approach towards the middle of this year and investors wonder if now is the time to buy stocks, we’ll ask about the State of the Market.

Is the market strong? Let’s see…

There is no simple or single way to measure the ‘strength’ of the market.

You can’t put it on a scale.

You can’t get it to bash something with a hammer to see if the bell rings.

And you can’t get it to pump iron to prove that this market is the most manly and strongest market of them all.

So what can you do? Can you look at the economy? Will that give you a clue? Not really…

The stock market and the economy aren’t the same thing

It’s important to remember a key thing about investing.

The economy and the stock market aren’t the same thing.

A simple way to think about the difference is this.

The economy is what’s happening now.

On the other hand the stock market is what investors think the economy will do in the future.

Does that make sense?

When you think about the economy you should think about businesses, consumers, manufacturers, retailers, and service providers.

It’s everything that involves the interaction of one group of individuals with another. It’s what they’re doing today.

But that’s not the stock market.

Sure, the stock market involves the interaction of individuals. And like the economy, the stock market has buyers and sellers.

But unlike the economy the stock market isn’t about what’s happening today. The stock market reflects what investors think will happen in the future.

It’s for that reason that, unlike many other folks, we have a relatively positive outlook on the future.

We’re not saying the future will be perfect and without problems. That wouldn’t be reasonable. But what we are saying is that throughout history the world has faced many problems. But thanks to the ingenuity of humans, things have generally turned out fine.

Not great, but getting better

That thought in itself can be dangerous.

It can lead people to think that they can do absolutely anything and things will be fine.

That’s only true until it isn’t true.

Arguably the whole subprime mortgage mess during the 1980s through to the late 2000s was a big part of that. Those creating the toxic assets figured that it didn’t matter what they did because the government would ultimately bail them out.

Boy, did they get that right.

The government did bail them out. And although it wouldn’t be fair to say things are back to normal, it would be fair to say that for most people things are looking better.

That’s perhaps with the exception of the one in five Americans currently on food stamps.

But that’s today. Isn’t it possible that things could gradually improve in the future? And if so, doesn’t it make sense to invest today in anticipation of future improvements?

It makes sense to us.

So how do we see the future?

You don’t need high growth for a boom

As we’ve mentioned, we have a positive outlook.

And it’s for one key reason.

As we look at it, China’s economic growth path is only beginning. That may seem a strange view considering the rapid growth over the past 20 years.

But the reality is that China is shifting from an emerging market economy into an emerged market economy. This is where we see parallels with the US economy at the turn of the 20th century.

The assumption by many analysts is that now China isn’t growing at 8% or 9%, the economy will collapse and there won’t be a major driving economic force in the world.

We don’t believe that for a second. And we’ve got history on our side too. Look at this chart:


Source: Trading Economics
Click to enlarge

As you can see from this chart, the average annual gross domestic product (GDP) growth for the US between 1948 and 1989 was around 3%.

This period coincides with what you could call the ‘Golden Age’ of American living. It was when the US ruled the world as both a manufacturer and a consumer of goods…all with a 3% average annual growth rate.

China’s GDP growth rate at the moment is 7.5%.

You see, in terms of where China is on the economic growth chart, it hasn’t even reached 1948 yet. And yet we’re supposed to believe that this economic behemoth has already peaked and that’s it’s only downhill from here?

We don’t buy it.

Yes, China may have peaked in terms of the economic growth rate, but it’s nowhere near peaking in terms of total economic growth.

That’s yet to come.

And that’s exactly why we’re backing China to take over as the world’s largest economy in the near future. It may not happen this year or next year, but it will happen.

When it does it will have a huge and disruptive impact on the world economy, and Australia stands to be right at the forefront to take advantage of it.

In short, you’ve got two options to play the growth of China. You can either stand by and watch it all happen. Or you can be an active part of it by investing in the companies and industries set to gain the most.

We know what we prefer. We hope you take the same view.

Cheers,
Kris
+

Two stories from Money Morning this week…

This week I wrote about why some people are particularly miffed at the fact that we offer a 30-day money back guarantee on our paid investment advisories. For many people who don’t subscribe that’s not enough. They don’t want to pay a cent for the valuable investment analysis we provide. In Monday’s Money Morning I explained why a small annual membership fee for one of our best investment advisories really is a small price to pay for taking part in this impending bull market.

In Wednesday’s Money Morning I explained that much of the ‘market crash’ talk was overdone. I explained that there were signs in the market to suggest that another boom is on the way. It’s early days, but these are the signs that make me positive about the future for stocks.

And this…

Introducing Money Morning Premium, the most important change to your Money Morning service that we’ve made in a long time. Click here  for more details…

Join Money Morning on Google+


By MoneyMorning.com.au