Gold fell by -0.50 percent – June 01 2018

Gold End of Day: June 01 2018

The GLD ETF, which tracks the price of gold, finished the North American session today with a decline of -0.50 percent and closed the day around the 122.49 price level, according to unofficial data at the New York close. The GLD ETF opened at 122.58 with the high of the day being 123.09 and the low of the day at 122.44.

The Gold RSI level is Bearish:

The Relative Strength Index, an indicator that can indicate overbought (above 80) and oversold levels (below 20), shows that the current RSI score is at 38.1 for a Bearish reading on the daily time-frame.

Gold Trends:

The GLD ETF, which tracks the price of gold, has recorded an increase by 0.11 percent over the past 10 days while seeing a slide of -4.00 over the past 30 days. The 90-day change is -3.76 while the 180-day return and the 365-day return are -2.48 and 13.36, respectively.

By investmacro.com

Nigeria holds rate, concerned over upward price trend

By CentralBankNews.info
    Nigeria’s central bank maintained its policy rate at 12.0 percent, as widely expected, saying core inflation has continued to send conflicting signals since January and “if the upward trend continues as observed in April 2014, it could be a major factor in the upward trend in prices.”
    The Central Bank of Nigeria (CBN), which has kept its policy rate steady since October 2011, also said high domestic liquidity could exert pressure on both the exchange rate and consumer prices, accentuating the already high demand for foreign exchange, further depleting external reserves.
    In a statement from Acting Governor Sarah Alade, who will be handing the reins of the CBN to Godwin Emefiele next month, the bank’s monetary policy committee voice concern over the eroded fiscal buffers that have exposed the Nigerian economy to domestic and external shocks, accentuating the regime of persistently high interest rates, elevated demand for foreign exchange and declining accretion of reserves.
   “The Committee enjoined the management of  the bank to continue to monitor developments in the fiscal space with a view to taking appropriate monetary policy actions,” the bank said.
    Nigeria’s headline inflation rate rose slightly to 7.0 percent in April from 7.8 percent, within the central bank’s 6.0 – 9.0 percent target range. Core inflation, which had eased to 6.6 percent in January, rose further to 7.5 percent in April after 7.2 percent in February.

    Nigeria’s gross official reserves declined to US$ 38.3 billion as of May 15 – the equivalent of some 9 months of imports – from $37.4 billion end-March and $42.85 billion end-December.
    However, the central bank also said it was satisfied with the overall domestic economic environment, with stable inflation, recent stability in the foreign exchange rate of the naira currency, stable interbank rates and a strong growth outlook.
    “Over the medium term, the major risks to price stability appeared to be emanating from both external and internal sources,” the bank said.
    The external risks to Nigeria’s economy stem from higher yields and interest rates in the U.S. and rather low economic activity in emerging markets, both of which could have repercussions for foreign exchange inflows and stability of the exchange rates.
   Internal risks include high systemic banking system liquidity, elevated security concerns and expected high election-related spending in the run-up to the 2015 general elections.
    The naira has been depreciating steadily against the U.S. dollar since 2009 and fell in February when the country’s president suspended the central bank’s internationally-respected governor, Lamido Sanusi.
    But the currency started to appreciate in March, helped by the central bank’s tightening when its raised the cash reserve requirement on private sector deposits by 300 basis points to 15.0 percent.
    Since March 1, the naira has  gained 2.1 percent, quoted at 162.34 to the U.S. dollar today, but it is still down 1.5 percent since the start of the year.

    http://ift.tt/1iP0FNb

Stocks Market Report 20th May

By HY Markets Forex Blog

Stocks – Asia

Stocks in the Asian region were seen traded higher on Tuesday, bouncing back from the previous losses.

Japan’s benchmark Nikkei 225 index climbed 0.49% higher ending the session at 14,075.25, while Tokyo’s Topix index rose 0.29% closing at 1,153.38. Yahoo Japan climbed by 13% on Tuesday after Softbank canceled plans to sell the telecommunications company, eAccess to the search engine giants.

Hong Kong’s Hang Seng index gained 0.78% to 22,877.90 at the time of writing, while the mainland Chinese benchmark Shanghai Composite climbed 0.16% higher to 2,008.46. The Chinese computer  manufacturer Lenovo gained 2.68%, while the telecom company china Unicom lost 2.72%.

In China, the government intends to push for development in the capital markets by spreading stock sales to ensure similar figures each month, China Securities Regulatory Commission Chairman Xiao Gang said in a statement.

The South Korean Kospi index slid 0.19% lower to 2,011.26 at the time of writing, while in Australia, the nation’s benchmark S&P/ASX index edged 0.32% higher closing the session at 5,426.50. Treasury Wine soared 19.29% after turning down a takeover offer from Kohlberg Kravis Roberts.

The Reserve Bank of Australia released minutes from its last monetary policy meeting, which showed no additional hints regarding the bank’s interest rates forecast.

“The board noted that overall growth in coming quarters was likely to be below trend given expected slower growth in exports, the decline in mining investment and the planned fiscal consolidation,” the minutes stated.

Stocks – Europe

European stocks were little changed on Tuesday as investors focus on the UK inflation rate data for April due to be released later in the day.

The European Euro Stoxx 50 declined 0.09% opening at 3,164.50, while the German DAX slid 0.13% to 9,647.80 at the time of writing. Meanwhile, the French CAC 40 fell 0.31% starting the session at 4,456.30, while the UK’s benchmark FTSE 100 edged 0.12% lower to 6,836.30.


Visit www.hymarkets.com   to find out more about our products and start trading today with only $50 using the latest trading technology today.

The post Stocks Market Report 20th May appeared first on | HY Markets Official blog.

Article provided by HY Markets Forex Blog

Gold Prices Trades below $1,300; Ukraine Elections in Focus

By HY Markets Forex Blog

Gold futures were seen trading slightly lower on Tuesday, during the Asian trading session as traders focus on Ukraine’s upcoming presidential election scheduled for May 25.

Gold futures edged 0.29% lower at $1,290.10 an ounce on the comex in New York at the time of writing, while futures for silver lost 0.22% to $19.310 an ounce at the same time. The US dollar, which advanced 1.7% higher against the 17-nation euro currency in the last two weeks, was slightly changed before the release of the Federal Reserve’s April 29-30 meeting minutes scheduled for Wednesday.

Gold – Ukraine

As traders focus on Ukraine’s presidential election which is scheduled for Sunday, tensions in the eastern region of the country eased after the Russian President Putin ordered Russian troops in Rostov, Belgorod and Bryansk regions to withdraw from the Ukrainian boarder.

Tensions in Ukraine spurred the commodity’s safe-haven status as the prices for the metal climbed 7.5% this year due to the country’s turmoil.

Assets in the world’s largest gold-backed exchange-traded fund, SPDR Gold Trust, came in at 2.70 tons lower to 782.85 tons on Friday.

Philadelphia’s Fed President Charles Plosser is expected to give a speech later in the day in Washington, while the Fed President of New York, William Dudley is also expected to speak in New York Today. The Central bank has reduced its asset purchases at each of its monthly policy meeting for the past three months to $45 billion per month.


Visit www.hymarkets.com   to find out more about our products and start trading today with only $50 using the latest trading technology today.

The post Gold Prices Trades below $1,300; Ukraine Elections in Focus appeared first on | HY Markets Official blog.

Article provided by HY Markets Forex Blog

Pressure On the Euro, Pound and Franc Remains

The EURUSD Is In A Narrow Range Again

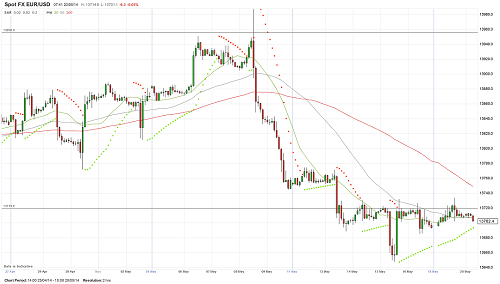
The EURUSD continues trading in a tight range where it has already been for a week except falling to 1.3648. Yesterday, it rose above 1.3720 and tested 1.3734 and after that it returned to 1.3706. Thus, a forecast is the same – growth attempts encounter interest to sale that keeps the risks of testing the support around 1.3618. Breaking through current resistance will lead to a rise in the direction of the 38th figure, however the pair is trading below, a bearish sentiment will be kept.

euro us dollar forex currency chart

The GBPUSD Running A Risk To Recover A Decline

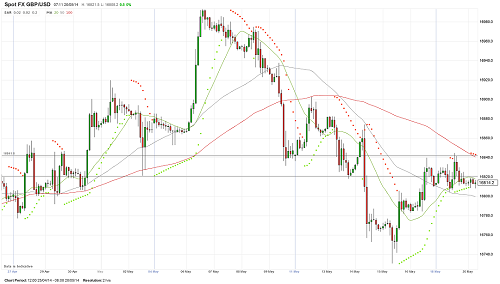
The GBPUSD is also consolidating in a tight range. Resistance is around 1.6842, and support is around 1.6805. Inability to rise and to consolidate above 1.6842 is a negative factor for the pair. In theory, bears are trying to test 1.6730 in a short time again. However, today data on consumer inflation in the UK will be published that can influence significantly on the dynamics of the GBPUSD.

gbpusd forex trading chart

The USDCHF Can Test 0.8959

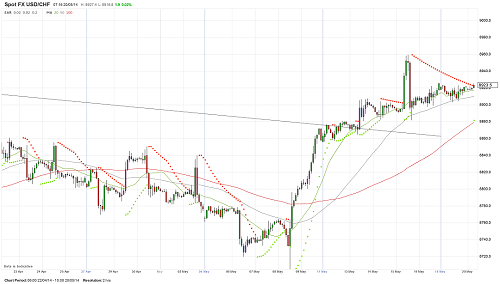
Yesterday, fluctuations in the EURUSD were not marked. It stuck in a tight range this time between the levels of 0.8903 and 0.8923. The franc remains under pressure along with the risks of testing the USDCHF bulls by the current high at the level of 0.8959. Breaking through this level will open the way to the 91st figure. A fall below 0.8840-0.8800 will weaken a bullish impulse and put the 87th figure at risk.

chf


provided by IAFT


Gold Range Tightens; Break-Out Scenarios in Play

Technical Sentiment: Consolidation

Key Takeaways

  • Gold’s trading range will continue to narrow until a break-out occurs;
  • 50-Day Moving Average provides resistance at $1307;
  • Support extends as low as $1282-$1284

While intraday traders may be focusing too much on “gold strengthening above $1300” / “gold weakens below $1300”, this large round number is not the real level of interest in the current market conditions. Gold has been stuck in a triangle formation and the boundaries of this triangle, not the $1300 handle, represent the key levels which will determine the direction of the break-out.


Technical Analysis
Gold 20th May

Even without the aid of trendlines or moving averages, it is clear that gold has been pressured from both directions. The range has been increasingly tighter as the precious metal formed Lower Highs and Higher Lows, the necessary conditions for a perfect triangle formation.

The large moving averages do not provide too much information at this point mainly due to the location of the triangle, right on the 100-Day SMA and 200-Day SMA. The 50-Day Moving Average coincides with the resistance at $1307, yet price action already confirmed the resistance trendline. Thankfully, gold’s movement as of late have not been chaotic, consequently most pivot levels since April have been respected. In the case of a break-out we can rely on several levels.

For a bullish scenario Gold needs to maintain the Higher Lows configuration. Support has been confirmed around $1288 in recent days, yet the triangle support extends as low as $1282-$1284. A bullish break-out will be confirmed on a rally above $1307. This move will first target $1314-$1315, with a main target around $1331 (April 14th top).

The bearish scenario first has to clear this week’s low in order to test the triangle support. Even if a break below $1282 will show price outside the triangle formation, only below $1277 Gold will be completely bearish after invalidating the Higher Lows configuration. The first target for bears will be $1268 (April 24th Low), followed by support levels $1260 and $1231.

*********
Prepared by Alexandru Z., Chief Currency Strategist at Capital Trust Markets


Bill Williams’ Indicators Analysis 20.05.2014 (USD/CAD, NZD/USD)

Article By RoboForex.com

Analysis for May 20th, 2014

USD CAD, “US Dollar vs Canadian Dollar”

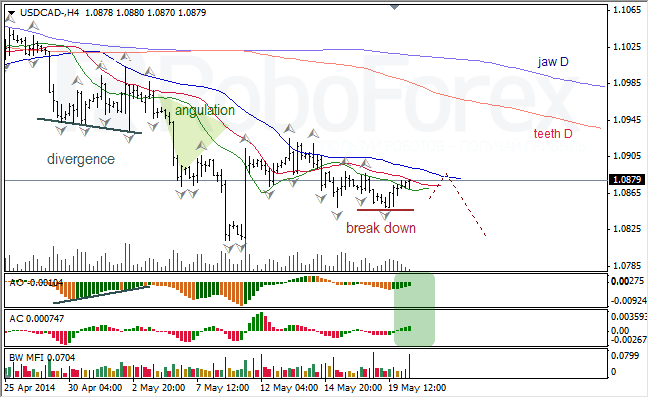
At H4 chart of USD CAD, Alligator is going to sleep; D Alligator is still moving southwards. Indicators are in green zone; price is forming bullish fractal; there is Squat bar on the MFI. Bullish fractal may reach Alligator’s jaw (blue line), and then I expect breakout of fractals to the downside.

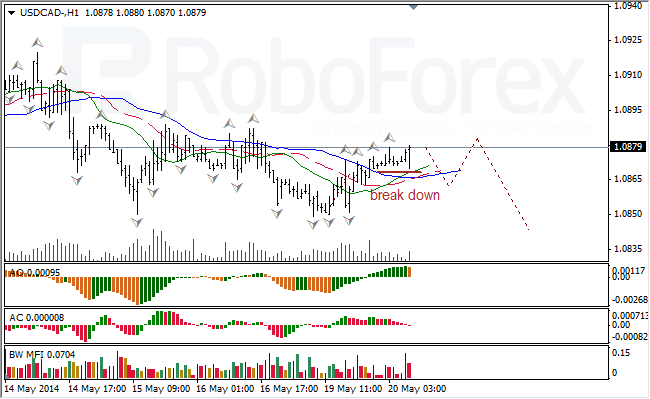
At H1 chart of USD CAD, Alligator is reversing upwards. AO is in red zone, AC is near balance line; there is Squat bar on the MFI. After two equidistant fractals, I expect breakout of fractals to the downside.

NZD USD, “New Zealand Dollar vs US Dollar”

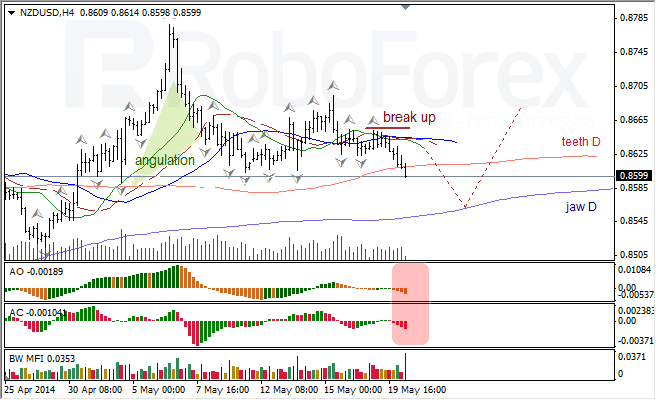
At H4 chart of NZD USD, Alligator is opening its mouth downwards. AO and AC are in red zone; there is Fade bar on the MFI and might be Squat one too. Bearish fractal may reach D Alligator’s teeth, and then I expect breakout of fractals to the upside.

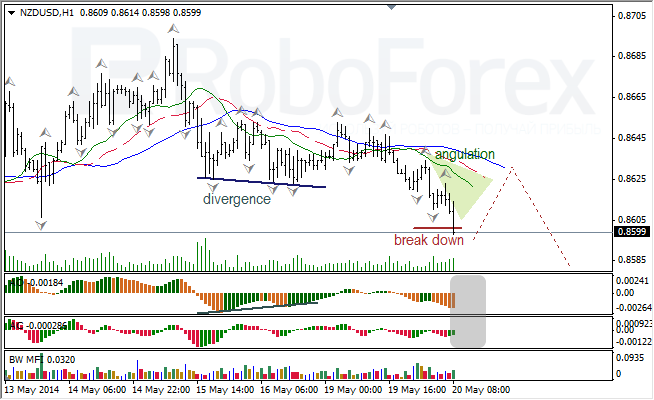
At H1 chart of NZD USD, Alligator is moving southwards. AO and AC are in grey zone; there is Green bar on the MFI and no Squat ones. Bullish fractal may reach Alligator’s jaw, and then I expect breakout of fractals to the downside.

RoboForex Analytical Department

Article By RoboForex.com

Attention!
Forecasts presented in this section only reflect the author’s private opinion and should not be considered as guidance for trading. RoboForex LP bears no responsibility for trading results based on trading recommendations described in these analytical reviews.


Wave Analysis 20.05.2014 (EUR/USD, GBP/USD, USD/CHF, USD/JPY)

Article By RoboForex.com

Analysis for May 20th, 2014

EUR USD, “Euro vs US Dollar”

Possibly, Euro finished the second “leg” C of (D) of ascending zigzag (D) of [B] in the form of diagonal triangle. In this case, later price is expected to start forming final descending zigzag (E) of [B].

Probably, price started forming final descending zigzag (E). Right now, Euro is forming its first “leg”A of (E). After completing local ascending correction [ii] of A, pair may continue falling down inside impulse [iii] of A.

Possibly, pair is forming local ascending correction [ii] of A, which may be followed by descending impulse [iii] of A.

GBP USD, “Great Britain Pound vs US Dollar”

Possibly, Pound completed ascending zigzag D of (B) of large skewed triangle (B), which may be followed by final descending zigzag E of (B).

Possibly, price started forming final descending zigzag E. Right now, Pound is forming local ascending correction(ii) of [a] of Eof the first “leg”[a] of E. If this assumption is correct, then after completing it, pair may continue falling down inside impulse (iii) of [a].

Probably, price is forming local ascending correction (ii) of [a], which may be followed by descending impulse (iii) of [a].

USD CHF, “US Dollar vs Swiss Franc”

Probably, Franc completed diagonal triangle [c] of D of descending zigzag D of (4), which may be followed by final ascending zigzag E of (4).

Probably, price started forming final ascending zigzag E. Right now, Franc is forming its first “leg”[a] of E. After completing local descending correction (ii) of [a], pair may continue growing up inside impulse (iii) of [a].

Possibly, pair is forming local descending correction (ii) of [a], which may be followed by ascending impulse (iii) of [a].

USD JPY, “US Dollar vs Japanese Yen”

Probably, Yen is forming long horizontal correction 4 of (A). In this case, later price is expected to start final ascending movement inside wave 5 of (A).

Probably, pair finished descending zigzag [c] of 4 of horizontal triangle 4, which may be followed by ascending zigzag [d] of 4.

Possibly, price completed descending zigzag [c] of 4 and started forming ascending zigzag [d] of 4 of horizontal triangle 4.

RoboForex Analytical Department

Article By RoboForex.com

Attention!
Forecasts presented in this section only reflect the author’s private opinion and should not be considered as guidance for trading. RoboForex LP bears no responsibility for trading results based on trading recommendations described in these analytical reviews.


EUR/USD Heading For 200-Day Moving Average

Technical Sentiment: Bearish


Key Takeaways

  • German Producer Price Index decreases by 0.1%
  • Euro remains pressured as ECB readies for action;
  • EUR/USD fails to correct upwards, eyes 200-Day Moving Average.

Traders were uneasy to push EUR/USD over the 1.3730 handle in recent sessions as Euro pressure mounts in direct correlation with the likelihood that ECB will act next month. The pair is expected to slowly grind lower ahead of US FOMC Meeting Minutes and Thursday’s Flash Manufacturing PMI releases. The Flash PMIs are expected to post small decreases, but if numbers disappoint too much we’ll be looking at a breach below the 200-Day Moving Average this week.


Technical Analysis

EURUSD 20th May

On the 15th last week, EUR/USD formed a bullish Pin bar which led traders to believe a correction was about to come after the drop from the 1.3992 area. The bullish price action pattern offered no follow through as EUR/USD flirted with the resistance at 1.3730 (just below the 100-Day Moving Average) yet never broke above it. If price crosses above this level, rallies won’t be capped until 1.3800/20.

Daily Stochastic remains in oversold territory but with bearish rejections off the resistance EUR/USD may continue the dip towards the next support, which in this case is represented by the 200-Day Moving Average at 1.3626. This level also coincides with a price pivot zone dating back to late 2013.

A breach of the 200-Day Moving Average will open the way for 1.3475 to be tested – the main support from February (level confirmed on multiple occasions between September and October 2013).

On the other hand, if EUR/USD does provide another bullish signal and corrects for a wave or two, rallies will aim to test the 100-Day Moving Average (1.3738) and the 50-Day Moving Average (1.3809), since these lines have been aimed at and respected by the market in recent months.

*********
Prepared by Alexandru Z., Chief Currency Strategist at Capital Trust Markets


Thoughts from the Frontline: Special Updates from the Strategic Investment Conference: Day 3

By Worth WrayGood morning from 30,000 feet, somewhere over the great American West!

I admit to being a little overwhelmed as I write to you on my way home from the Strategic Investment Conference. After three days with two dozen of the finest investors, economists, and political scientists anywhere in the English-speaking world, it is going to take me weeks to think through the real-world implications of all I have learned.

While I will have to rely on my overloaded memory and late-night notes to reflect on the dozens of one-on-one conversations I had, I am so thankful to the folks at Mauldin Economics and Altegris for recording the sessions themselves, which will let me replay the experience over and over in the coming weeks. (You can do so, too, by ordering the SIC MP3/CD Audio Set at our discounted pre-event price. It’s available here.)

Much to my surprise, after two days of mind-blowing presentations and provocative conversations about debt overhangs, monetary policy, technological transformation, and the growing bubble in investor complacency, the conference ended on its strongest note yet!

Early in the day, GaveKal Research co-founder (and Europe’s preeminent financial journalist) Anatole Kaletsky shared a handful of variant perceptions that challenged my thinking and shattered my often self-deceptive sense of certainty. Contrary to the optimistic and technologically promising view of the future shared by John Mauldin, George Gilder, Newt Gingrich, and Jack Rivkin, Anatole suggested that the jury is still out on the future path of productivity growth. The still open question about productivity (which Anatole says may take 15 years to answer) has enormous implications not only for the climax and resolution of the global debt drama but also for the very structure of the global economy in the years ahead.

Looking to the shorter term, Anatole echoed a wise but too-often-overlooked comment from Gluskin Sheff Chief Economist & Strategist David Rosenberg on day 1 of the conference. Markets move as economic activity, liquidity conditions, and valuations get better or worse at the margin… and at the margin, Anatole suggests, the great and powerful headwinds on everyone’s minds may be slowly turning into tailwinds.

He laid out a powerful and actionable view of the future that I seriously need to consider in the coming weeks, starting with this question: Is the US stock market (an asset class that tends to dominate traditional investment portfolios) at the end of a five-year cyclical rebound and due for a correction…

… or are US stocks finally breaking out in a structural upswing after 14 years in a secular bear market purgatory?

While I remain concerned about the corrosive effects of dogmatic and irresponsible central bank policy – not to mention historically elevated valuations in the face of negative real interest rates – Anatole has learned to look past emotion and ask the uncomfortable questions. These are the moments when my brain goes into overdrive, and I feel absolutely alive.

What many people do not realize about Anatole is that he draws not only on the wisdom gained from a long career but also on an unparalleled personal network of legendary investors like George Soros, Stan Druckenmiller, and Kyle Bass… to name just a few.

The day ended with a lively debate, featuring an eye-opening range of competing views, that extended our conversation from questions about global markets and economies to geopolitics. While Harvard Professor Niall Ferguson expressed worries about the global dangers of US isolationism, the degeneration of American culture, and the troubling trajectory of government debt in the face of a dysfunctional political system, Eurasia Group President Ian Bremmer argued that US ambiguity is far more dangerous than isolationism.  Hamstrung by a lack of support from the American people to enforce hollow threats over “red lines” in Syria and the Ukraine, the Obama administration has not actually said what it wants in the world… leaving US allies and enemies to assume the worst (a point that Anatole shared with great vigor).

I wish I could outline their entire conversation for you – ranging from the future of the Eurozone and the rising risk of Russian imperialism to the enormous risks of Chinese reforms – but it is time to hit the send button.

I am leaving the Golden State with more questions than answers… but then again, that’s the mark of a great conference! Hope you can join us next year, and feel free to drop me a line anytime on Twitter at @WorthWray.


Worth Wray
Chief Strategist, Mauldin Companies