Article By RoboForex.com
Analysis for April 22nd, 2014
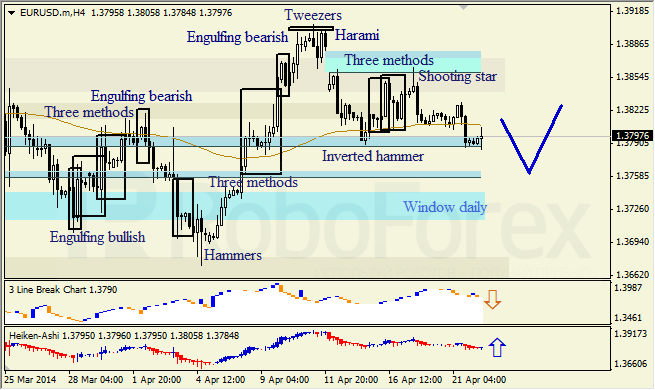
EUR USD, “Euro vs US Dollar”
H4 chart of EUR USD shows descending movement, which is indicated by Shooting Star pattern near resistance from upper Window. Middle Window is support level. Three Line Break chart confirms descending movement; Heiken Ashi candlesticks indicate possibility of bullish pullback.
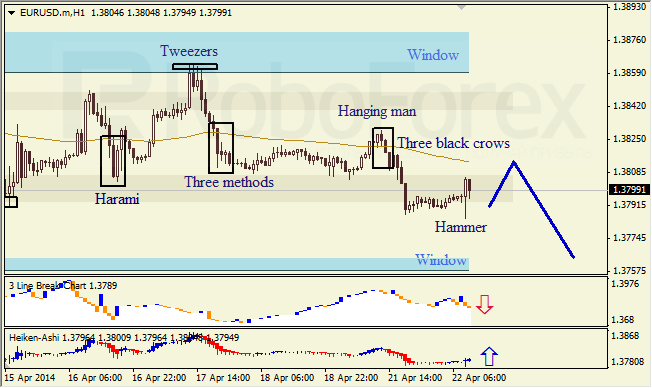
H1 chart of EUR USD shows bearish tendency, which is indicated by Hanging Man and Three Black Crows patterns. Lower Window is support level. Three Line Break chart confirms bearish movement; Hammer pattern and Heiken Ashi candlesticks indicate possibility of bullish pullback.
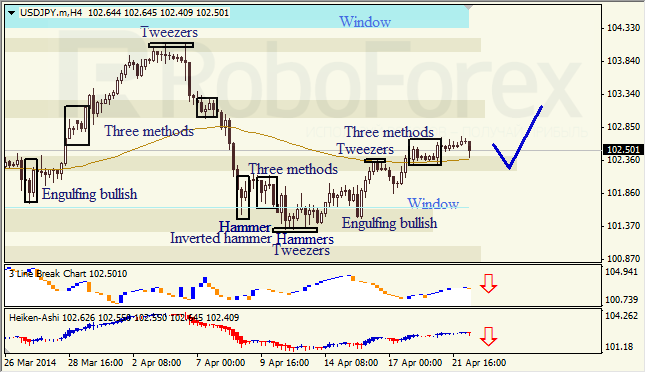
USD JPY, “US Dollar vs Japanese Yen”
H4 chart of USD JPY shows ascending movement, which is indicated by Three Methods continuation pattern. Three Line Break chart and Heiken Ashi candlesticks indicate bearish pullback.
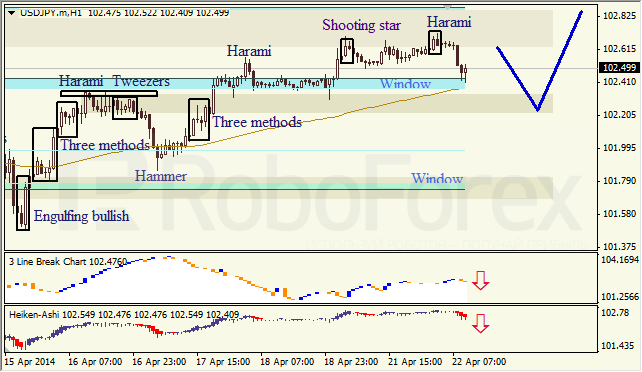
H1 chart of USD JPY shows correction within ascending trend, which is indicated by Harami pattern. Three Line Break chart and Heiken Ashi candlesticks confirm descending movement.
RoboForex Analytical Department
Article By RoboForex.com
Attention!
Forecasts presented in this section only reflect the author’s private opinion and should not be considered as guidance for trading. RoboForex LP bears no responsibility for trading results based on trading recommendations described in these analytical reviews.