Article by Investment U

USO, which tracks WTI futures, and BNO, which offers exposure to Brent crude, show the WTI-Brent spread (or WTI vs. Brent) over the past few years.
I think it’s safe to say crude oil may be the most essential commodity around the globe.
It’s a new world out there. The United States is just one of the super economies around and many of the others are new to the game and are growing at a rate much larger than ours.
We use crude oil for everything from running our cars to making plastic. The need for oil causes conflicts and gives power to those countries that have an abundance of it. Taking all this into account, not too many of us actually know how it’s priced. A lot of us hear how much it costs per barrel or get mad when prices go up at the pump. But what’s the method behind the madness?
Hopefully, I can shed a little light on the process…
All Oil is Not Equal
If you drill for oil in different parts of the world, you may get oil, but it might not be all the same oil. Excuse me for getting all scientific, but there are varying degrees of oil based on a number of metrics such as the oil’s American Petroleum Institute (API) gravity. This API gravity is used to compare a petroleum liquid’s density to water. The scale ranges from 10 to 70. “Light” crude oil usually has an API on the higher side of the scale, while heavy oil falls on the lower end of the range.
After you find the API gravity, investors will then look at how sweet or sour petroleum is. This “flavor” depends on the oil’s sulfur content – 0.5% is a key benchmark. When oil has a total sulfur level greater than half a percent, then it’s considered sour. Content less than 0.5% indicates that oil is sweet.
You can find sour oil in a lot more places around the world – like Canada, the Gulf of Mexico, some South American nations, as well as most of the Middle East – than its sweet counterpart. Sweet crude comes from the good old USA, the North Sea region of Europe, and parts of Africa and Asia.
The industry uses both types, but the sweet crude is the prize pony because it requires less processing in order to get out all of the bad stuff. What to take away? Light and sweet forms of crude oil are strongly desired. The heavier form usually trade at a discount in comparison.
WTI vs. Brent
Now we have a foundation so we can begin to price these different types of oil on the world market. Right now, there are two major benchmarks for world oil prices, West Texas Intermediate (WTI for short) crude oil and Brent crude oil. Both are light sweet crude oils, but WTI is generally sweeter and lighter.
Benchmarks are needed so traders can determine transactional settlement prices. Crude oil can be found all over the world, so the types vary. With so many different variances, benchmarks are used to give a reference point that can be globally quoted and traded. There are actually over 160 different types of crude produced in the world. And as we just discussed, each type of crude is priced differently based on its quality.
Understanding the WTI-Brent Spread
WTI is a regional benchmark reflective of supply/demand issues in the American Midwest, while Brent is a European benchmark reflective of specific European issues (with slightly higher exposure to regions such as Africa and the Mideast).
WTI is a crude oil specific to the Midwest region of the United States. Where you find it that explains its large discount to Brent. There is a glut in the amount of crude oil going to refineries in the Midwest due to an increased supply from Canada and North Dakota’s Bakken Shale. The excess supply pushes prices of WTI at the refineries in Cushing, Oklahoma.
Brent reflects the supply/demand balance in Europe. Because of this, many industry analysts believe that Brent is a more global benchmark and reacts more to global events. Think of how the issues in Libya last year and now Syria and Iran pushed Brent prices higher.
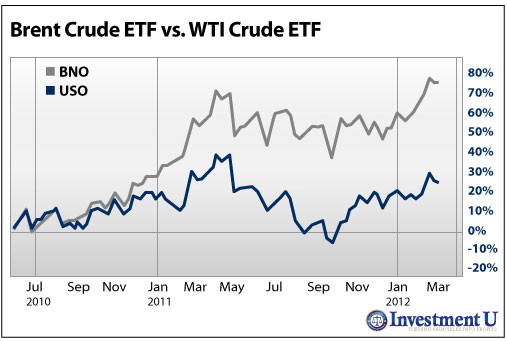
Two ETFs, the United States Oil Fund (NYSE: USO), which tracks WTI futures, and the United States Brent Oil Fund (NYSE: BNO), which offers exposure to Brent crude, show the performance difference of the major benchmarks over the last few years. Since its inception in mid 2010, BNO and Brent oil alike have put a beating on WTI with a return around 75% for the fund. In comparison, USO has gained 25% – which isn’t bad.
The graph below gives us a visual of the difference:

It’s my belief that volatility in Middle East can account for the difference we’ve seen lately.
Take the following into consideration going forward…
- How long can this vast gap in returns last? If the issues in the Middle East stabilize, we might see the premiums come back together. I’m referring to stability as no immediate signs of war or revolution. You could possibly get trapped into buying a commodity that is set to fall based on overarching macroeconomic factors.
- On the flip side, the region has a history of instability so it might be a while before we see the region calm down and Brent fall. If you play the chaos card, take Brent as the best crude option.
- WTI and Brent are still the two prominent benchmarks used to set global oil prices, but this could change in the next few years. Major producers are shifting allegiance or going in a different direction all together. Brazil’s Petrobras (NYSE: PBR) – which Investment U has written about on several occasions – recently switched its benchmark pricing from WTI to Brent. Saudi Arabia, Iraq and Kuwait all shifted their benchmark pricing for U.S. exports from WTI to the Argus Sour Crude Index.
- These two benchmarks will become less important as markets will probably seek one global benchmark. The widening WTI-Brent spread is accelerating this trend. However, that’s probably years away from becoming a reality.
Hope this helps.
Good Investing,
Jason Jenkins
Article by Investment U