USD/SEK’s Bearish Momentum

printprofile

As we can see from the chart below (provided by ForexYard), the USD/SEK has been trading within a major downtrend for some time now. The current reading has pushed below the Sept. 2009 price, making this a 2-year low price mark.

Moreover, as we can see from the Relative Strength Index (RSI) the price remains in neutral territory and does not show any accumulation of technical pressure to the upside.

The Stochastic (slow) on our weekly chart, however, does reveal what appears to be an impending bullish cross. There appears to be several days or weeks before this cross occurs, on the other hand, which means the bearish momentum remains dominant for the time being.

Technical analysts have said they expect some level of retracement in the USD/SEK towards 6.5000 by mid-February, likely assisted by a boost to the USD from Valentine’s Day retail sales growth. The peaking SEK values are also expected to start cutting into corporate profits in Sweden over the next several months and at least a few forecasts are beginning to reflect this expected shrinkage.

For the moment, however, traders may expect a continuation of bearishness in the USD/SEK as the pair seems to retain solid downward momentum heading into the first week of February.

USD/SEK – Weekly Chart
USDSEK - Weekly Chart

Swedish Krona Reaches 10-yr High vs. EUR

printprofile

The Swedish economy has been outperforming many of its regional neighbors over the past few years and traders are beginning to see a signal that its currency is breaking barriers.

The krona (SEK) touched a 2-year high against the US dollar (USD) yesterday, a high of 6.3886. As a recent safe-haven away from the sovereign debt crisis of the euro zone, the SEK also pushed towards a 10-year high against the euro (EUR), reaching 8.7830 before bouncing back to its recent price near 8.8200.

Sweden’s relative growth was highlighted by December’s trade surplus figures, revealing an expansion beyond the expected 7.9B SEK to a whopping 10.9B SEK. Growth in Sweden’s large telecom industry, with Ericsson leading the way, helped boost Swedish exports and drive the trade surplus to this December reading.

Swedish fashion retailer H&M, however, experienced a mild dip in Q4 profits, but announced its plans to open another 250 stores in fiscal 2011, citing market optimism. The stronger SEK has begun to gouge Sweden’s retail industry by increasing the price of domestic goods, but the impact has so far not been dire enough to dampen Sweden’s economic growth forecasts.

WTI Crude Oil Aiming For $100 Per Barrel


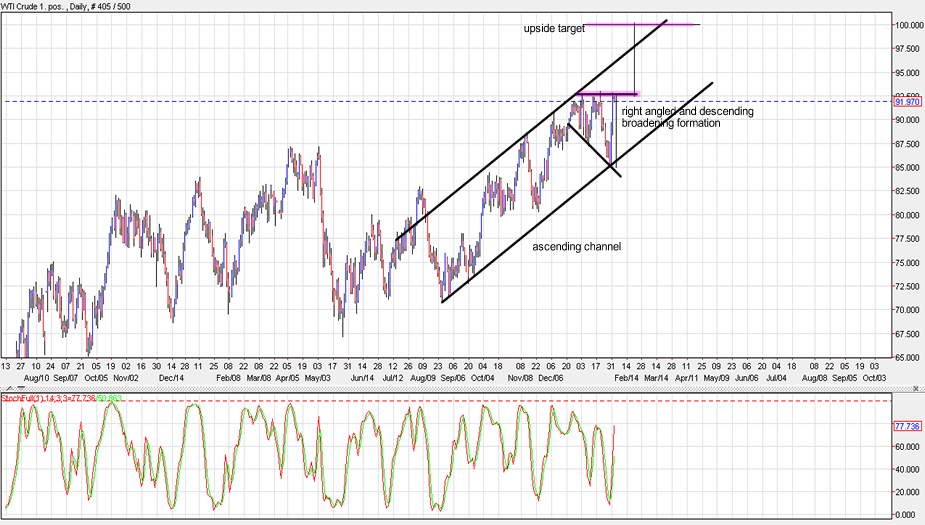
WTI Crude soared back to $92.84 per barrel yesterday (January 31, 2011) during the height of the social and political unrest in Egypt. Aside from the negative sentiment that the crisis has brought, traders were also worried that the people’s uprising could interrupt the flow of trade in Suez Canal. Like I said in my previous post (kindly see it here), about 8% to 10% of global sea trade with 1 million to 1.6 million barrels of crude oil per day pass through the canal. Another 3 million or so barrels of crude oil pass through an adjacent pipeline, putting the total to about 4.7% of the global output. Hence, any disruption in the canal could cause a shortage in global oil supply. In fact, some major shipping lines like AP Moller-Maersk had already halted their operations.

On the technical side, the price of WTI crude oil had risen sharply from a low of $85.11 per barrel on Friday to a high of $92.84 yesterday. As you can see from its daily chart above, WTI crude oil has been trading within an ascending channel for several months now. From mid-December of 2010, it has started to form a right-angled and descending broadening formation. And from the looks of it, it appears that it is already ripe for an upside breakout. In the event the prices of WTI crude oil move past $92.50, it could further rise and touch the psychological $100.00 marker. On the flip side, it could once again head towards the support of the ascending channel if it fails to break above $92.50. But given the channel’s present direction, the chances that the price of WTI crude oil moving north is higher.

Higher crude oil prices could weigh on the equities markets since such makes the cost of running industries more expensive. As you all know, majority of the world’s energy comes from petroleum. While such could negatively impact the global businesses in general, on the one hand, it could also benefit the companies that produce or refine oil especially if they are able to hedge their inventories on lower prices.
WTI Crude soared back to $92.84 per barrel yesterday (January 31, 2011) during the height of the social and political unrest in Egypt. Aside from the negative sentiment that the crisis has brought, traders were also worried that the people’s uprising could interrupt the flow of trade in Suez Canal. Like I said in my previous post (kindly see it here), about 8% to 10% of global sea trade with 1 million to 1.6 million barrels of crude oil per day pass through the canal. Another 3 million or so barrels of crude oil pass through an adjacent pipeline, putting the total to about 4.7% of the global output. Hence, any disruption in the canal could cause a shortage in global oil supply. In fact, some major shipping lines like AP Moller-Maersk had already halted their operations.

On the technical side, the price of WTI crude oil had risen sharply from a low of $85.11 per barrel on Friday to a high of $92.84 yesterday. As you can see from its daily chart above, WTI crude oil has been trading within an ascending channel for several months now. From mid-December of 2010, it has started to form a right-angled and descending broadening formation. And from the looks of it, it appears that it is already ripe for an upside breakout. In the event the prices of WTI crude oil move past $92.50, it could further rise and touch the psychological $100.00 marker. On the flip side, it could once again head towards the support of the ascending channel if it fails to break above $92.50. But given the channel’s present direction, the chances that the price of WTI crude oil moving north is higher.

Higher crude oil prices could weigh on the equities markets since such makes the cost of running industries more expensive. As you all know, majority of the world’s energy comes from petroleum. While such could negatively impact the global businesses in general, on the one hand, it could also benefit the companies that produce or refine oil especially if they are able to hedge their inventories on lower prices.

More on LaidTrades.com

Daily Wrap: 1/31/2011

According to the Commerce Department, we Americans spent more money last month that economists though we would. And that news is sending all three major stock indexes higher today.

AUDUSD continued its sideways movement

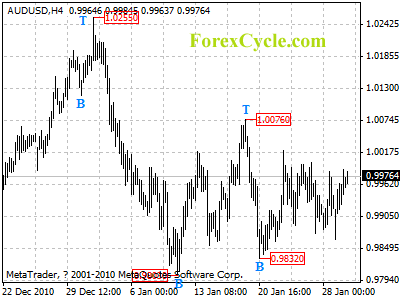
AUDUSD continued its sideways movement in a range between 0.9803 and 1.0076. Lengthier consolidation in the range is still possible in a couple of days. Key support is at 0.9832, a breakdown below this level could trigger another fall to 0.9600 area. Key resistance is at 1.0076, above this level will indicate that the long term uptrend from 0.8066 (May 25, 2010 low) has resumed, then further rise towards 1.0500 could be seen.

audusd

Daily Forex Forecast

Week Ahead Market Report: 1/31/2011

Investors this week are likely to focus on the news from Egypt and its effect on the global economic recovery. Good morning, Im Kristin Bianco, with the Week Ahead Market Report for January 31, 2011.

Analyst Moves: Citigroup, Ford

This morning, Morgan Stanley lowered its EPS estimates on shares of Citigroup (C) through 2012 as higher costs and lower revenue could impact earnings going forward. In the report, Morgan Stanley maintained its equal weight rating and its $5 price target.

Consumer Spending Rose 0.7% In December

The Commerce Department reported consumer spending rose to a seasonally adjusted 0.7% in December, indicating that the economy entered into Q1 with momentum.Income rose 0.4% in December for the second straight month. The savings rate fell to 5.3% in December from 5.5% in November.Economists had expected a 0.4% increase in income and a 0.6% gain in spending.

EUR/USD Reaches Retracement Target

By Russell Glaser

With textbook precision the EUR/USD has completed a 61.8% retracement of the November to January move, but the weekly chart shows a sign of caution.

Following the 4Q 2010 decline from 1.4280 to 1.3456, the EUR/USD has climbed as high as 1.3760, a level which coincides with the 61.8% Fibonacci retracement at 1.3744. Since reaching this key technical barrier, the pair has shown a loss of momentum with significant selling occurring at this price.

The weekly chart displays a harami cross has formed from the two previous week’s candlesticks, a potential reversal signal in the recent uptrend. Support for the pair comes in at last week’s low of 1.3540 followed by 1.3500, as well as the January 17th low of 1.3250.

A breach above the previous week’s high at 1.3750 would be supportive of the pair with further long term resistance located at the mid November high of 1.4080, followed by the October high of 1.4280.

EURUSD Weekly

Forex Market Analysis provided by ForexYard.

© 2006 by FxYard Ltd

Disclaimer: Trading Foreign Exchange carries a high level of risk and may not be suitable for all investors. There is a possibility that you could sustain a loss of all of your investment and therefore you should not invest money that you cannot afford to lose. You should be aware of all the risks associated with Foreign Exchange trading.

FOREX: Large Currency Speculators add to Euro long positions, US Dollar shorts

By CountingPips.com

The latest Commitments of Traders (COT) report, released on Friday by the Commodity Futures Trading Commission (CFTC), showed that futures speculators added to their short positions of the US dollar against the other major currencies while increasing long positions in favor of the euro. Non-commercial futures positions, those taken by hedge funds and large speculators, were overall net short the US dollar by $18.2 billion against other major currencies as of January 25th. This is a rise from the total short position of $15.06 billion on January 18th, according to the CFTC data and calculations by Reuters which calculates the dollar positions against the euro, British pound, Japanese yen, Australian dollar, Canadian dollar and the Swiss franc.

EuroFx: Currency speculators added to their net long positions in the euro against the U.S. dollar with a total of 22,901 long positions as of January 25th. This is a sharp turnaround for euro positions that were long by 4,109 contracts on January 18th and were short by 45,182 contracts on January 11th.

The COT report is published every Friday by the Commodity Futures Trading Commission (CFTC) and shows futures positions as of the previous Tuesday. It can be a useful tool for traders to gauge investor sentiment and to look for potential changes in the direction of a currency or commodity. Each currency contract is a quote for that currency directly against the U.S. dollar, where as a net short amount of contracts means that more speculators are betting that currency to fall against the dollar and net long position expect that currency to rise versus the dollar.

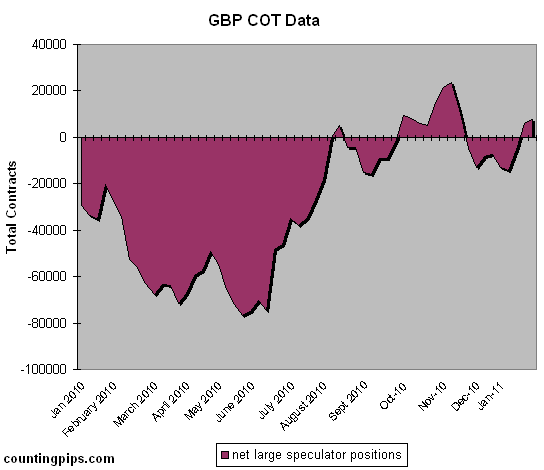
GBP: Speculators increased their net long British pound sterling positions as of January 25th after turning to net long positions last week. Pound sterling contracts rose to a total of 7,888 long positions after totaling 5,794 long positions as of January 18th.
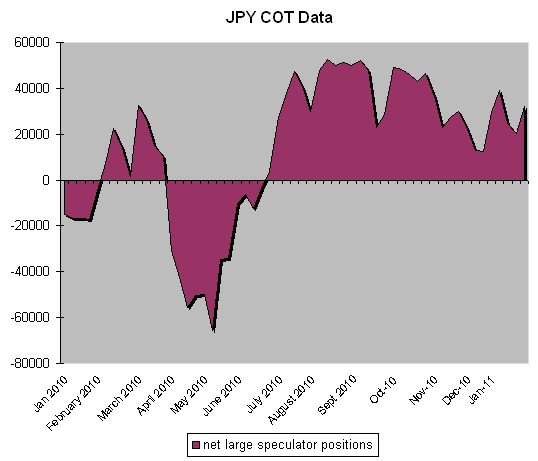
JPY: The Japanese yen net long contracts rose after two declining weeks as of January 25th to a total of 32,218 long contracts. Yen positions had totaled 20,529 net long contracts reported on January 18th.
CHF: Swiss franc long positions edged lower for a third straight week to a total of 6,594 long contracts as of January 25th after totaling a net of 6,992 long contracts on January 18th. This marks the lowest level in Swiss franc long positions since July 27th, 2010.
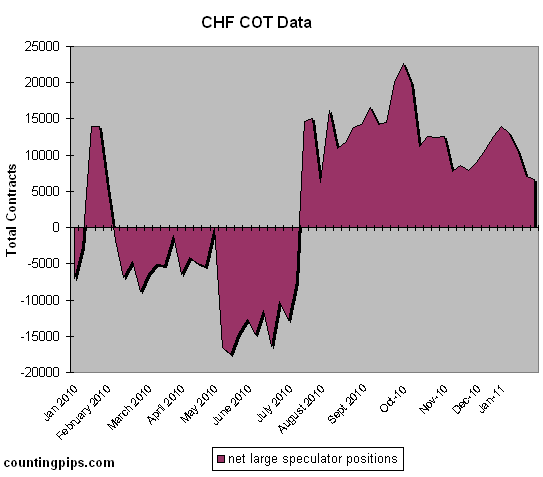
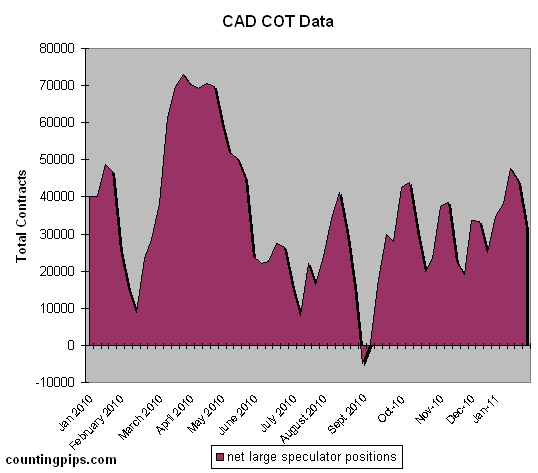
CAD: The Canadian dollar positions decreased lower for second consecutive week. CAD long positions registered 31,719 contracts after totaling 44,055 net longs on January 18th.
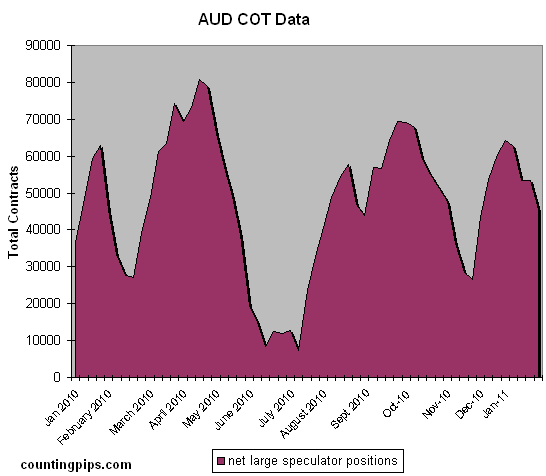
AUD: The Australian dollar long positions dropped lower from the previous week. AUD contracts totaled a net amount of 45,458 long contracts as of January 25th from 53,508 long contracts on January 18th.
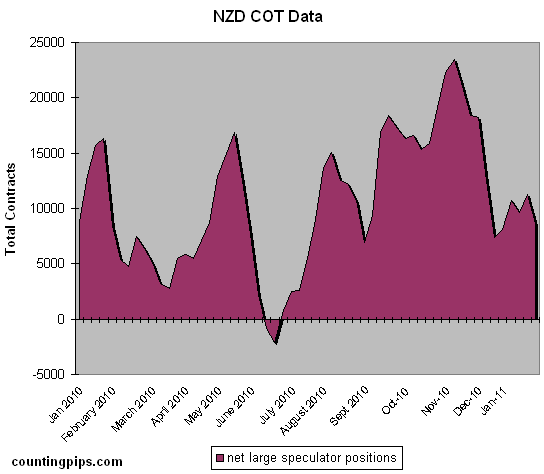
NZD: New Zealand dollar futures positions decreased to a total of 8,627 long positions as of January 25th. NZD large speculator long positions had advanced the previous week to a total of 11,247 long contracts on January 18th.
MXN: Mexican peso long contracts continued to rise for a third consecutive week as of January 25th to 95,245 net long positions after totaling 90,202 longs the week prior on January 18th.
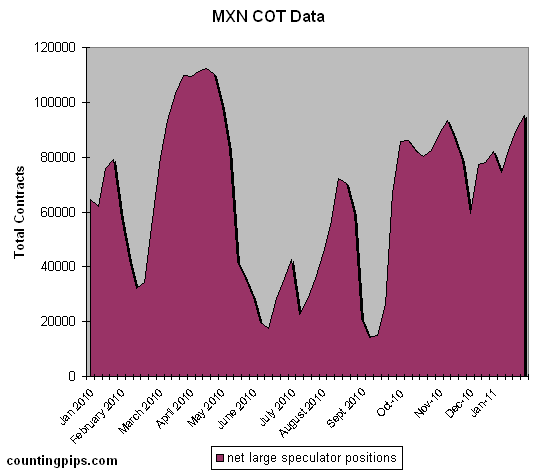
COT Data Summary as of January 25th, 2011
Large Speculators Net Positions vs. the US Dollar

Euro: +22,901
British pound sterling: +7,888
Japanese yen: +32,218
Swiss franc: +6,594
Canadian dollar: +31,719
Australian dollar: +45,458
New Zealand dollar: +8,627
Mexican peso: +95,245

Go to the Commitment of Traders CME raw futures data

Further COT Resources from around the web: