March 10 (Bloomberg) — Charles Nenner, founder of the Charles Nenner Research Center, talks about the outlook for the euro and oil prices. Nenner spoke March 8 with Margaret Brennan on Bloomberg Television’s “InBusiness.” (Source: Bloomberg)
EUR/USD: Euro backpedals as sovereign debt woes mount, Rises in Asian session
By GCI Forex Research
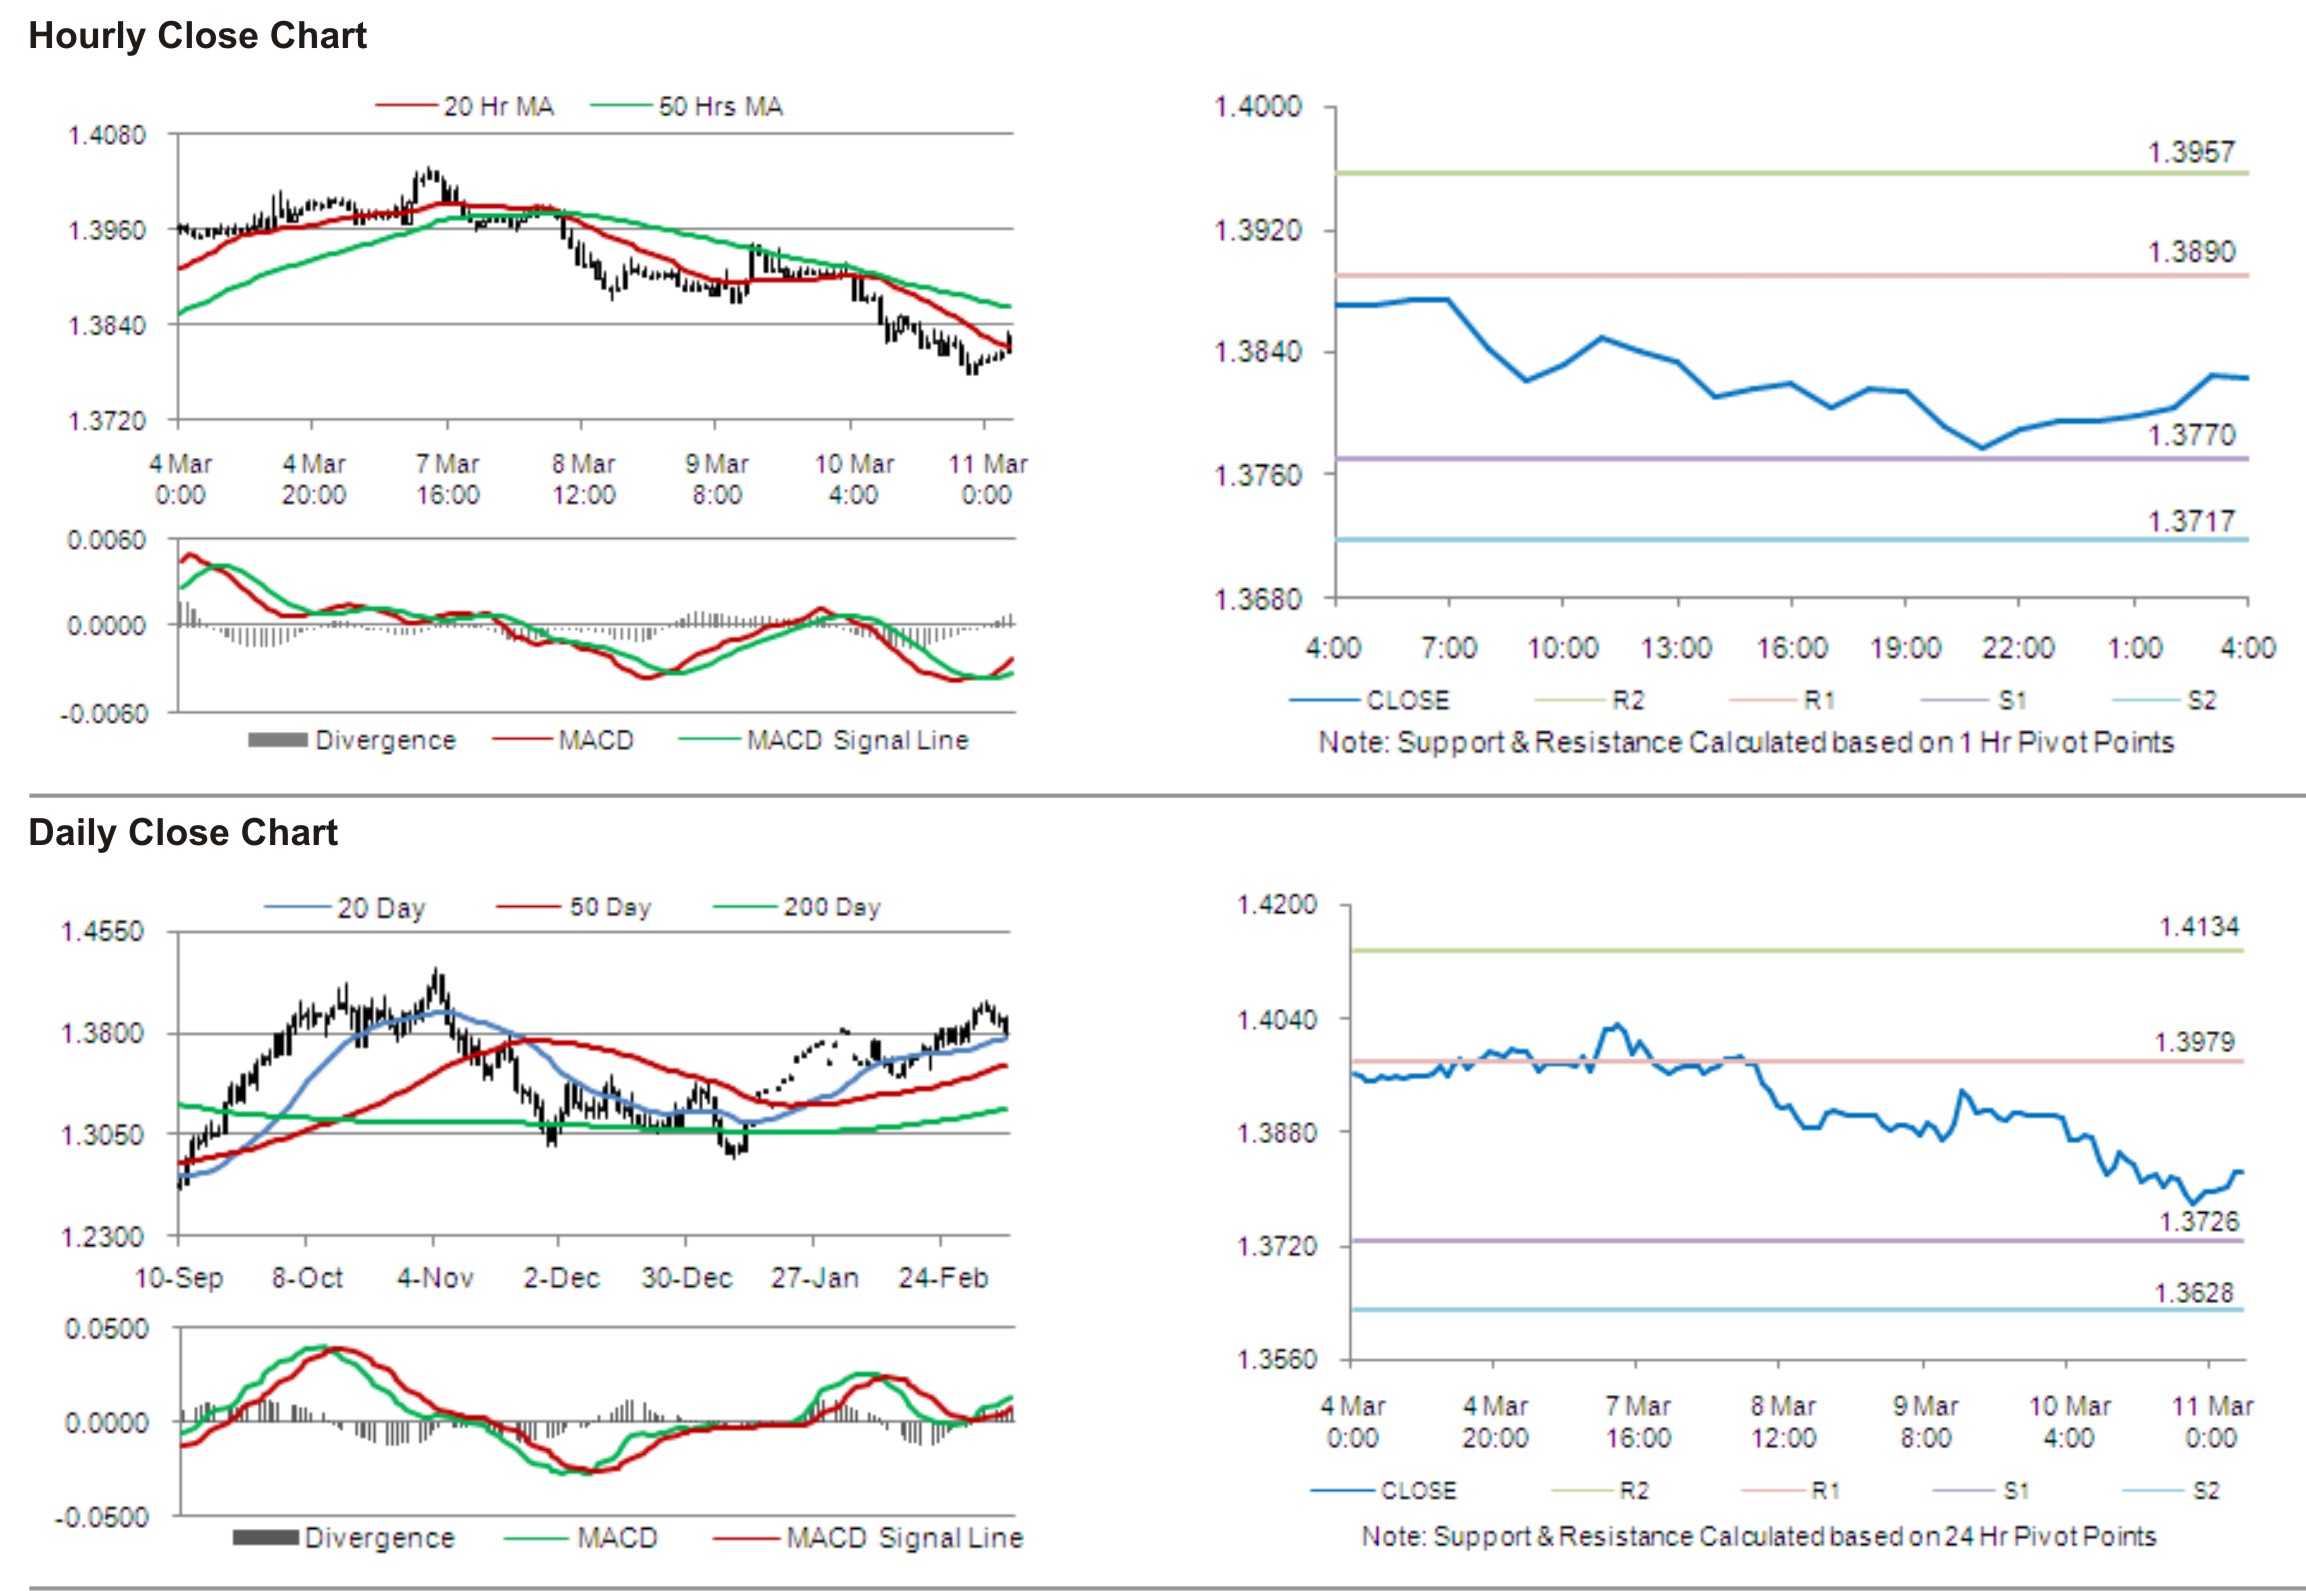 EURUSD Movement
For the 24 hours to 23:00 GMT, EUR declined 0.78% against the USD and closed at 1.3795, after Moody’s Investors Service downgraded Spain’s sovereign debt rating by a notch to Aa2 with a negative outlook, citing that it was uncertain about the country’s ability to improve its finances.
The European Central Bank (ECB) in its monthly bulletin increased its projections for inflation. The ECB’s projection for inflation now stands at 2.0% to 2.6% for 2011 and 1.0% to 2.4% for 2012. Meanwhile, lower end for Euro-zone’s Gross Domestic Product growth has been revised upwards and now stands at 1.3% to 2.1% for 2011.
In Germany, trade surplus fell to €10.1 billion in January from €12.2 billion surplus in December.
In the Asian session, at 4:00GMT, the EURUSD is trading at 1.3823, 0.20% higher from the levels yesterday at 23:00GMT.
The pair has its first short term resistance at 1.3890, followed by the next resistance at 1.3957. The first support is at 1.3770, with the subsequent support at 1.3717.
The currency pair is showing convergence with its 20 Hr moving average and is trading just below its 50 Hr moving average.
Forex Daily Market Commentary provided by GCI Financial Ltd.
GCI Financial Ltd (”GCI”) is a regulated securities and commodities trading firm, specializing in online Foreign Exchange (”Forex”) brokerage. GCI executes billions of dollars per month in foreign exchange transactions alone. In addition to Forex, GCI is a primary market maker in Contracts for Difference (”CFDs”) on shares, indices and futures, and offers one of the fastest growing online CFD trading services. GCI has over 10,000 clients worldwide, including individual traders, institutions, and money managers. GCI provides an advanced, secure, and comprehensive online trading system. Client funds are insured and held in a separate customer account. In addition, GCI Financial Ltd maintains Net Capital in excess of minimum regulatory requirements.
DISCLAIMER: GCI’s Daily Market Commentary is provided for informational purposes only. The information contained in these reports is gathered from reputable news sources and is not intended to be U.S.ed as investment advice. GCI assumes no responsibility or liability from gains or losses incurred by the information herein contained.
Japan Hit by 8.9 Maginitude Earthquake, 10-Meter Tsunami
March 11 (Bloomberg) — Bloomberg’s Mike Firn reports from Tokyo on the 8.9-magnitude earthquake that struck off the coast of northern Japan. Mark Barton also speaks on Bloomberg Television’s “Countdown.”
Quake will have short term financial consequenses
The Nikkei Average fell after the quake. However long term global consequenses are unlikely, says seniorstrategist Ib Fredslund Madsen.
An 8,9 magnitude earthquake hit northern Japan today triggering a massive tsunami. The financial markets reacted instantly sending down the stocks in Tokyo.
The last major earthquake hit Japan in 1995 and did not have a long term affect on the global market.
Video Courtesy of en.jyskebank.tv
Buy Signals on Platinum

The platinum prices are once again dropping, and it is currently traded around $1770 an ounce. However, there is much technical data that supports a bullish move for today as described below. Forex traders involved with commodities like this can take advantage of this knowledge by going long on platinum now, and at a great entry price!
• The technical indicators used are the Slow Stochastic, Relative Strength Index (RSI) and MACD.
• Point 1: There is a “doji” candlestick formed in the chart, indicating that a reversal should take place.
• Point 2: The Slow Stochastic shows a fresh bullish cross which may indicate an impending bullish movement.
• Point 3: The Relative Strength Index (RSI) indicates that the price of this cross currently floats in the oversold territory, signaling upward pressure.
• Point 4: The MACD indicates an impending bullish cross, which may signal an upward movement is going to occur in the near future.
Platinum 8-Hour Chart

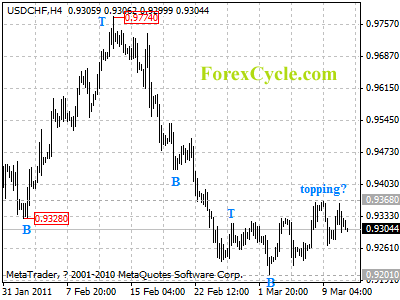
USDCHF might be forming a cycle top at 0.9368
USDCHF might be forming a cycle top at 0.9368 level on 4-hour chart. Another fall to test 0.9201 key support would likely be seen later today, a break below this level will indicate that the downtrend from 0.9774 has resumed, then next target would be at 0.9100 zone. However, above 0.9368 will suggest that lengthier consolidation of downtrend from 0.9774 is underway, then further rally could be seen to 0.9400-0.9450 area.
ISS: Buy shares in connection with the IPO
The ISS-IPO starts today, Tuesday. Equity analyst Martin Bo Hansen recommends investors to buy shares in connection with the IPO.
S&P500 Major Levels are in Play. Are the VIX and “Usual Suspects” giving Signals?
By JW Jones, optionstradingsignals.com
Many readers might remember that exactly two years ago the S&P 500 tagged the infamous 666 price level before putting on a monster 2 year rally that saw it surge over 100% to the February 2011 highs. Investors today are staring at a rising wall of risk while corporate credit spreads remain bullish, corporations have been able to expand margins and produce increasing profits, and Federal Reserve Chairman Ben Bernanke has declared that there are no inflationary concerns. Quite frankly I am going to leave Ben Bernanke alone simply because so many other people will do a better job of declaring him incompetent and the creator of massive bubbles in risk assets, but I digress.
Right now investors have to weigh rising oil prices, geopolitical conflict in the Middle East, the threat of higher interest rates and inflation against the bullish backdrop discussed above. The price action in the broader market place is talking, but we have to listen with an open mind currently. There are two key price levels that are obvious when we look at a daily chart of SPX. First of all, the SPX 1331-1332 price level is acting as major resistance and holding the bulls in check. Should this level be breached to the upside on a daily close, we could see prices extend higher to test recent highs. The chart below illustrates the key upside level around 1331-1332.

However, it is important to note the bearish wedge forming on the SPX daily chart. If price can push below the recent lows around 1294, we should see an extension lower to the 1260-1280 area before support comes back into focus. If we were to test the 1260-1280 price level, it is hard to say where price action could go. We could see an extension higher which pushes to higher highs or we could rollover and test the 1250 price level below. I will wait until we get confirmation in either direction before making any major assessment, but for right now those are the key levels for traders to watch. The chart below illustrates the bearish wedge located on the SPX daily chart.

My bias remains to the downside due to what I am seeing in the Volatility Index (VIX) and what I refer to as the “usual suspects”. The usual suspects include small caps represented by IWM, transports represented by IYT, and the financials represented by XLF/KBX. I look at all of these metrics daily in order to facilitate my view of the marketplace and where I expect price action to be headed. Of course I take into consideration other analysis metrics such as market internals and chart formations, but the crux of my daily analysis is derived from the analysis of the VIX and the suspects.
Take for example the Volatility Index (VIX) daily chart and it is obviously trending higher and is well above key moving averages. I believe that in the future we will see the VIX test the 200 period moving average and potentially breakout. The test I am sure about, the breakout remains to be seen. The key levels on the VIX are shown below:

IWM has a similar trading pattern as the S&P 500 index but at current price levels it is well off of the recent highs. It is also building a bearish wedge and I will be watching it closely to see which way it breaks. If IWM breaks down ahead of the SPX it is likely that the SPX will follow suit. The transports (IYT) have gotten banged up the worst as the rise in oil price negatively impacts the entire sector. Transports are also trading well below recent highs and also have a bearish wedge formed on the daily chart.
The financials (XLF/BKX) exhibit a bearish wedge but they also have head and shoulders patterns forming on their daily charts. Should price break the neckline we could see heavy selling pressure set in on the financial complex. Most regular readers know that I put a lot of emphasis on the price action in the financials (XLF) and as such should they breakdown the broader indices will move in tandem. The daily chart of XLF is listed below:

Interestingly enough the U.S. Dollar Index futures appear to have formed a short/long term bottom on the daily chart. It is obviously unknown whether this is just a bounce to work off oversold conditions or the beginning of a longer term move higher. The primary point for traders to consider is that a rising dollar could place additional selling pressure on the S&P 500, crude oil, and precious metals.
By now I’m guessing most readers are starting to get the theme here. We have bearish wedges forming on key indices, however that does not mean that they will follow through to the downside. We could see a failure and a breakout higher just as easily as a bearish breakdown, thus the reason why the key levels are so important on the S&P 500. I am going to wait for a clear breakout/breakdown and will accept directional risk on the broad indices at that point. Until then, I am not going to get involved in the daily chop.
Get My Trade Ideas Here: www.optionstradingsignals.com/profitable-options-solutions.php
JW Jones
Dollar Gains as Equities Tumble

Traders flocked to the safety of the US dollar and the Swiss franc following reports of Saudi police firing on protesters in the Saudi Kingdom. In response, equities sold off and crude oil trimmed its losses in volatile trading.
In the New York session, uncharacteristic volatility was felt with the dollar rising sharply versus the euro and the pound. The dollar built on its gains for the day after reports hit the wires of Saudi demonstrators being met by gunfire to break up protests.
In response to the news, the EUR/USD fell to a fresh low at 1.3775 following the report. The Swiss franc gained versus the dollar and the euro while crude oil prices came off of their lows for the day and surged more than $2 in less than an hour.
The Dow Jones Industrials Average had its worst day since August 2010, finishing down 1.9% and closing below 12,000 for the first time since January 31st, though the index did manage to finish off its lows. The NASDAQ was also down 1.8%.
The Saudi report contributed to the negative tone of the trading day that began with a downgrade of Spanish sovereign debt by Moody’s. Traders were also disappointed when the Bank of England decided not to raise interest rates, prompting traders to sell the pound.
Market sentiment has quickly turned from the previous week where traders were focusing on higher yields in the Eurozone when euro was pushing to new highs. This week the European debt crisis has reemerged combined with geopolitical concerns in the Middle East which has caused a rush to the dollar as a safe haven play.
Tomorrow traders will be eyeing the EU Economic Summit for progress by European finance ministers working towards a resolution of the European debt problem. US core retail sales and UofM Consumer Sentiment are also on tap.
Midweek Technical Trading Analysis: Gold & Equities on the Verge of Breaking Out!
By Chris Vermeulen, thegoldandoilguy.com
The past couple weeks we have seen strong distribution selling in the equities market followed by equally large days of buying. These buying and selling frenzies have formed a sideways consolidation.
Intraday movements have been sizable and more than enough to shake those trying to pick a direction early out of the market a few times. As fewer traders get involved the price range narrows and becomes compressed. Eventually there will be a breakout in a direction on heavy volume and with any luck it will start a new trend.
As much as I love to trade, I have been sitting on the sidelines for a few weeks giving this market some time to sort it’s self out… As we all know there are times when you get really aggressive and other times when it’s best to stand aside.
It is very important to note that each trader sees the market in a different way and once it is aligned with what you are comfortable with trading, only then should you step in and trade. If not, then it’s best to wait for more favorable price action. It took me years to figure this out but now that I know what I am looking for and on what time frames, trading is less stressful and I know I don’t need to be trading all the time, there is always another opportunity just around the corner…

Gold has been trading sideways for almost two weeks now as it tries to break free of the December high. It is much in line with the SP500 chart above. I feel Friday or early next week that the market, dollar, metals and oil make some sizable moves either up or down…

Mid-Week Conclusion:
In short, I don’t think it is wise to jump the gun and take on any large positions until we see what happens on Friday overseas…
If nothing happens which is kind of what I am thinking, we should see the extra fear value come back out of the price of gold, silver and oil (drop in price) and possibly help boost equity prices.
Chris Vermeulen
