8.8% Is NOT the Real Unemployment Rate

By Jared Levy, Editor, Smart Investing Daily, taipanpublishinggroup.com

Headlines declare that the unemployment rate dropped again this past month. There were many experts who thought we would see a rise in unemployment. So perhaps the “seemingly” positive data was a main driver of the recent stock market rally in the face of not-so-strong economic data here in the States, the catastrophe in Japan and revolution in the Middle East.

It is true (I think?) that 216,000 jobs were added last month and that number does seem to be growing each month, but when I hear quotes of 8.8% as our national unemployment rate, I just cringe!

It pains me to see people get misled day in and day out. I know that in my own life I wish everyone I met would tell me the raw truth. But we all know that the truth is often polished, augmented, twisted or thrown away altogether.

Being cordial is one thing, but when masses of people are “taught” to believe a partial truth that has direct ramifications on their monetary and social well-being, a line must be drawn.

A “Peculiar” Figure

The percentage number we are told is the official unemployment rate is called the “U3” measurement, which doesn’t calculate the full unemployment picture. It actually measures the amount of unemployed workers divided by the people in the participating labor force.

The devil is in the details in how they define “unemployed workers” and the participating labor force itself. I’ll show you how this can present a serious statistical conundrum in just a moment.

There are several measurements that the BLS (Bureau of Labor Statistics) offers us, as noted in the chart below. As a total figure, U3 is the most limited in scope and is about half of the U6 measure at present. The U6 at least gives a slightly more accurate reading.

Bureau of Labor Statistics
View larger chart

To be fair, figuring out exactly how many people are truly and fully employed is a daunting task. The BLS releases a massive amount of data on a monthly, quarterly and annual basis. I understand that the immense amount of data can be a challenge to sift through, but it is more about the way the data is presented and interpreted by the media that bothers me.

The data is flawed in my opinion because there are several components and measurements that go into the formula. Furthermore, part of the equation is a bit nebulous.

The “Participation Rate”

This is a highly misleading part of the unemployment equation. The participation rate is the ratio between the amount of people who are currently employed or who are ACTIVELY looking for a job as a percentage of the total people who are able to work (labor force). Talk about a subjective definition!

Right now the participation rate is at a 25-year low of 64.2%. Here is what that means:

  • Let’s assume that the eligible working population increases by 1 million per year — and the participation rate stays flat. The economy will need to add about 53,500 jobs per month to keep the unemployment rate stable.
  • If the participation rate drops (like it’s been doing) from 64.2% to 60%, it would only take 50,000 new jobs per month to keep the official unemployment rate “stable” in the above scenario.
  • A drop in the participation rate can make the employment situation seem better than it is. But there are drawbacks to moves in either direction!

I know this concept is about as clear as mud and that is part of the problem. There are so many ambiguous concepts and measurements, that getting a true reading is next to impossible.

Courtesy of Zero Hedge
EUR/AUD Chart
View larger chart

(Investing doesn’t have to be complicated. Sign up for Smart Investing Daily and let me and my fellow editor Sara Nunnally simplify the stock market for you with our easy-to-understand investment articles.)

Who’s Not Counted as Participating Workers?

Marginally Attached

In the BLS table above, you will notice the term “marginally attached.” According to the BLS, persons marginally attached to the labor force are those who currently are neither working nor looking for work but indicate that they want and are available for a job and have looked for work sometime in the past 12 months. These people are not counted in the U3 reading (official unemployment rate).

Discouraged

Discouraged workers are a subset of the marginally attached. Basically these are people who have given a job-market related reason for not currently looking for work. So if they don’t feel anyone will hire them because of their skill set, education or where they live, they are omitted from the official unemployment rate.

Discouraged also refers to a person employed part time for economic reasons who is available for full-time work but can’t get the hours and are forced onto a part-time schedule or work for less pay. They are not counted in the official unemployment rate.

Non-active

If you are not actively looking for work at all and don’t want a job, you are NOT counted in the participation rate or in the official unemployment rate.

Births and Deaths

Obviously the amount of people entering and leaving the population also affects our national unemployment rate. If fewer people are available to work and the amount of jobs remains the same, the unemployment rate goes down and vice versa.

Which Rate Is Correct?

There are so many complex pieces to this puzzle. Hopefully this opens your mind to the topic. I encourage you to learn about the different factors that go into finding the different unemployment rates. I would also recommend you keep track of the participation rate and population changes so that you can get behind the headlines, which are usually misleading.

It might help you get ahead of some significant market swings.

For example, if unemployment does drop and companies can’t find workers to fill specific positions, they may have to raise salaries. While that may be a good thing, it may add inflationary pressures and cause our friends at the Fed to raise rates… not good for housing or the equity markets.

As for our current situation, I think it’s quite brash of any politician to claim major victory with regard to unemployment in this country. Aside from the understated unemployment rate, I have a feeling Americans are going to witness a major shift in the way we have to earn a living. For many, the change will not be welcome. The days of spending 40 years with a company and retiring with a healthy pension and Social Security are no more.

For now, maybe those claiming how many jobs they are adding should be looking at the data more closely and thinking about how America will reinvent itself and its workforce.

Editor’s Note: Things are about to change drastically in the U.S. and around the world. But it may not be the reason you think. There’s a growing crisis creeping just under the surface of our nation’s financial problems. When this “under-crisis” finally breaks through the surface, expect all hell to break loose. Find out where the real danger lies in this eye-opening financial investment report.

About the Author

Jared Levy is Editor of WaveStrength Options Weekly, our options trading research service and Co-Editor of Smart Investing Daily, a free e-letter dedicated to guiding investors through the world of finance in order to make smart investing decisions. His passion is teaching the public how to successfully trade and invest while keeping risk low.

Jared has spent the past 15 years of his career in the finance and options industry, working as a retail money manager, a floor specialist for Fortune 1000 companies, and most recently a senior derivatives strategist. He was one of the Philadelphia Stock Exchange’s youngest-ever members to become a market maker on three major U.S. exchanges.

He has been featured in several industry publications and won an Emmy for his daily video “Trader Cast.” Jared serves as a CNBC Fast Money contributor and has appeared on Bloomberg, Fox Business, CNN Radio, Wall Street Journal radio and is regularly quoted by Reuters, The Wall Street Journal and Yahoo! Finance, among other publications.
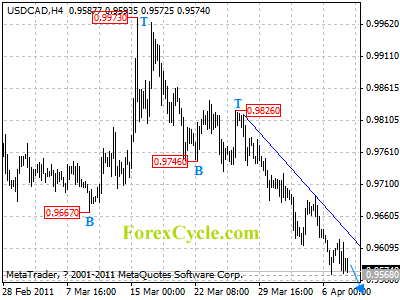
USDCAD remains in downtrend from 0.9826

USDCAD remains in downtrend from 0.9826, the price action from 0.9568 is treated as consolidation of downtrend. Resistance is at the falling trend line on 4-hour chart, as long as the trend line resistance holds, downtrend could be expected to continue, and next target would be at 0.9500 zone. However, a clear break above the trend line resistance will indicate that a cycle bottom has been formed at 0.9568 on 4-hour chart, then range trading between 0.9568 and 0.9650 could be seen.

usdcad

Daily Forex Forecast

Options Report: April 7, 2011

Welcome to the Financial News Network Options Report. On the call side, Fifth Third Bancorp calls are at close to 9 times the average amount after the company was upgraded by analysts. EMC Corp and Southwest Airlines calls are both over 5 times the average volume as investors await quarterly earnings results from both companies later this month. Eli Lilly calls are not far behind at 5.2 times their normal volume. Finally, Calls on shares of The Gap are at 4.6 times the normal amount after the company announced that it will be selling 10-year bonds and news of a new loan and credit facility. Taking a look at the put side of the ledger, Power-One puts are at close to 4.5 times their average volume after the company was downgraded by investors. Star Scientific puts are at just over 3.5 times their normal volume as investors are bearish on the company today. Puda Coal puts continue to be active this week. Today they are trading at just over 3 times the average amount. Finally, Cephalon and United Continental close out the list with just under 3 times the average amount of puts. This has been you daily options update from the Financial News Network. Stay tuned for more insight into where the big money is placing their bets each day.

Google’s YouTube in talks with Hollywood and music producers

Google’s (GOOG) YouTube is in negotiations. According to Bloomberg, the online search engine is in talks with Hollywood and music producers for material. However the discussions are preliminary and no plans have been solidified. The talks would help Google in revamping YouTube into a lineup of new channels.

Nokia Heads South on Moody’s Debt Downgrade

Nokia Corp. (NOK) has been in and out of the red in choppy trade this morning after Moody’s Investors Service downgraded the company’s senior ratings to “A3” from “A2,” with a negative outlook. The company’s American depositary shares hit a high of $9.09 before turning lower. Shares are now down fractionally at $8.98. Moody’s cited weakness in its core business of mobile devices. The ratings, still investment grade, apply to about 5.3 billion euros ($7.6 billion) of debt. Moody’s said Nokia’s inflexible smart phone operating system, slowness in putting out new models and more attractive innovation by competitors is putting it at a disadvantage.

Stock Market Crash Warning — Three Storm Fronts Converge

By Justice Litle, Editorial Director, Taipan Publishing Group, taipanpublishinggroup.com

A Note from Editor Sara Nunnally: Today, I’m traveling back to Baltimore for an editorial meeting with the Taipan Publishing Group. While I’m traveling, I’d like to share with you an inside look at Justice Litle’s service, Macro Trader.

Justice is our editorial director, and his big-picture thinking follows major global trends. As our economy becomes more and more obviously enmeshed with the rest of the world, this service can really guide investors through the intricacies of macro trends.

Here’s a recent article (March 16) to show you what I mean…

Crash Warning — Three Storm Fronts Converge

Justice Litle’s Quote of the Week

The past six weeks have brought enough market-moving news to fill a reasonably exciting year, or, for that matter, a dull decade… as we go to press, after a catastrophic earthquake and tsunami, Japan is now faced with a meltdown — not in the figurative, but in a very literal sense; the Middle East is once again proving flammable in the extreme, as the decades of neglect of festering political sores play out in the only way they could have… Europe is back in crisis mode (the only mode in which the European Union actually gets anything done)…

— Hedge fund manager Eric Kraus, “Trading Strategies for the Apocalypse”

Stock Market Commentary

The phrase “perfect storm” is much overused in the financial press, and should be restricted to the most severe of circumstances if not retired outright.

But if ever there were a time to highlight “perfect storm” conditions, this would be it…

Right now we have three fronts converging on the equity markets, coupled with a fourth “portfolio contagion” factor that threatens to act like kerosene on a fire. Those three converging fronts come from Japan, Europe and the Middle East.

Front One: Japan “Effectively Out of Control”

The phrase “effectively out of control” is not what you want to hear in respect to nuclear reactors. But those are the words Günther Oettinger, the European Union commissioner for energy, used to describe the situation in Japan.

“In the coming hours there could be further catastrophic events which could pose a threat to the lives of people on the island,” he added.

Japan has asked the U.S. military for help in containing the nuclear reactor situation. Various rescue missions and helicopter operations have had to be called off because of potential radiation threats to rescue personnel. The situation is fluid and may have changed substantially even by the time you read this.

It is sadly ironic that Japan would suffer a nuclear crisis, because the Japanese financial situation has long been described in “nuclear” or “time bomb” terms. Noted hedge fund manager Hugh Hendry is on record as calling Japan “a nuclear bomb strapped to the chest of the world economy.” It should be noted he made that metaphor a long time before the present turn of events.

Japan’s fiscal situation is deadly serious because the country is sitting on a huge and unsustainable debt load in the form of Japanese government bonds, or JGBs. The Japanese government is leveraged to the hilt after 20 years of failed stimulus policies and zero or near zero interest rates. Japan watchers have long predicted that, at some point, the JGB “time bomb” would go off — probably when Japanese retirees stopped putting their savings into bonds — and a major currency meltdown would follow.

The irony of the situation is that Japan’s currency has risen sharply in response to the crisis. The expectation is that large capital flows of yen will return home, pushing up the value of the currency. Meanwhile the BOJ (Bank of Japan) is scared to intervene in a large way because they fear accidentally setting off the JGB “time bomb.”

But when that debt time bomb does go off, as eventually it must, we could see the Japanese yen transform from one of the strongest currencies in the world to a new version of the Thai baht or the Chilean peso.

Right now the unknowns of Japan center around human catastrophe and global supply chains. Japan is a major hub for many important electronics and high-end manufacturing parts, and so the nuclear power plant catastrophe threatens disruption and shutdown to significant portions of global trade. But the bigger unknown is how the JGB question and the inherent leverage in Japan’s economy plays out…

Front Two: The Middle East, Bahrain Burning, Rebels on the Brink

Meanwhile, even as the world fixates on Japan, the situation in the Middle East is going from bad to worse. Libya’s rebels are begging the West to flat-out assassinate Gadhafi, or otherwise establish no-fly zones, as Gadhafi pounds them with money and military firepower.

As the WSJ reports,

Col. Moammar Gadhafi’s forces seized the last town standing between them and the rebel capital, raising the specter that, even if the U.S. and Europe decide to intervene on the rebels’ behalf, their help may come too late.

In a devastating development for the rebel cause, Col. Gadhafi’s fighter jets bombed the center of the town of Ajdabiya, and his troops outmaneuvered rebel forces there, clearing a path to the rebel capital of Benghazi, in eastern Libya.

“The city is in ruins,” said Ali Faraj Hammada, leader of Ajdabiya’s revolutionary committee, as he fled toward Benghazi in a blood-soaked car…

Meanwhile the situation is going from bad to worse in Bahrain, where Saudi troops have intervened aggressively and even opened fire on protesters. As the Financial Times reports,

The crisis escalated this week after protesters over-ran the police on Sunday and took effective control of large swaths of the capital, spurring the arrival of more than 1,000 Saudi Arabian troops and light armour on Monday.

The arrival of Saudi soldiers and some police from the United Arab Emirates has escalated tensions in the already volatile Middle East region.

While the opposition denies there are any ties between Iran and the protesters, Saudi Arabia’s military intervention has sparked concerns that Tehran could try to take advantage of the unrest in Bahrain.

As we have written of previously, Saudi Arabia is “Sunni” Muslim… Iran is “Shia” Muslim… and there is no love lost between the two. At the same time, Saudi Arabia has a disgruntled Shia minority situated in very oil-sensitive areas of the country. And so Iran has not been able to miss this golden opportunity to stir up trouble…

The net result is that the little country of Bahrain may wind up becoming a proxy battleground for a massive Sunni/Shia fight between Saudi Arabia and Iran.

(I may be a guest editor for Smart Investing Daily, but editors Sara Nunnally and Jared Levy simplify the stock market everyday with their easy-to-understand investment articles.)

Front Three: Europe Still in Crisis

And last but not least we have Portugal contributing to the mix again today… as long-time Macro Trader readers know, we consider the fiscal situation in Europe to fall somewhere between a disaster and a farce, with the high likelihood of ending in tears.

It simply does not make sense for the powerhouse export machine that is Germany to be linked together with the much more fragile and debt-laden periphery countries (Portugal, Spain, Italy, etc.). This linkage is political in nature, an “experiment” that never gave true weight to crisis considerations.

And so now we are seeing monetary union with a lack of true cultural or political union cause Europe to lurch from crisis to crisis, with the endgame (in our opinion) being a massive devaluation of the euro as the European Central Bank (ECB) is forced to run the printing presses full tilt. As Reuters reports,

Portugal‘s government blamed higher rates paid at a debt auction on Wednesday on the opposition’s refusal to back its latest austerity plans, warning a political standoff could force it to seek a bailout.

Pressure on Lisbon mounted after Moody’s rating agency downgraded Portugal by two notches late on Tuesday, highlighting the challenges it faces in riding out its debt crisis.

The worsening financing situation for Portugal — which many economists say is the next likely eurozone country to need a bailout after Greece and Ireland — suggests the deal to boost the eurozone rescue fund may have come too late for it…

The Fourth Vector: Portfolio Contagion

Another major issue the markets face is that of “portfolio contagion” — the risk that overleveraged long investors, hedge funds, mutual funds and the like, are forced to sell positions in healthy parts of their portfolios simply to “stop the bleeding.”

The portfolio contagion issue is intensified by the fact that hedge funds became more leveraged in January (according to Bloomberg) than at any point since 2007 in their willingness to make leveraged long equity bets. This “leveraging up” was a function of the “can’t lose” mentality associated with the Bid ‘Em Up Bernanke stock market.

But now all that leverage threatens to have a powerful reverse effect in the form of contagion. The more exposure that leveraged long investors have to sharp declines, the more aggressively they will have to cut losses and get out.

And when too many of them attempt to do this all at once, the result is a cascading avalanche of selling that feeds on itself… i.e. a full-blown stock market crash.

Editor’s Note: You’ll be hearing from Justice later this week, so keep your eyes peeled for his letter. If you want to learn more about Justice’s Macro Trader, you can visit the website here.

Also, don’t miss out on this amazing investing opportunity. Our Pulitzer Candidate financial journalist, Michael Robinson nailed four mining stocks poised for huge potential gains. In just six months, these four special mining companies are up 381%, 180%, 126% and 113%… But if you act today, there’s a chance you could still book 1,158% gains thanks to the rarity of the substance they mine. It’s not silver or gold, but something much more valuable… learn what these stocks are in his urgent video report.

About the Author

Justice Litle is the Editorial Director of Taipan Publishing Group, Editor of Justice Litle’s Macro Trader and Managing Editor of the free financial market news e-letter Taipan Daily. Justice began his career by pursuing a Ph.D. in literature and philosophy at Oxford University in England, and continued his education at Pulacki University in Olomouc, Czech Republic, and Macquarie University in Sydney, Australia.

Aside from his career in the financial industry, Justice enjoys playing chess and poker; he enjoys scuba diving, snowboarding, hiking and traveling. The Cliffs of Moher in Ireland and Fox Glacier in New Zealand are two of his favorite places in the world, especially for hiking. What he loves most about traveling is the scenery and the friendly locals.

Blanchflower Says Rate Rise by ECB `Pretty Big Mistake’

April 7 (Bloomberg) — David Blanchflower, professor of economics at Dartmouth College and a former policy maker at the Bank of England, talks about the European Central Bank’s decision to raise its benchmark interest ratea quarter percentage point to 1.25 percent and the impact on euro-zone economies and the region’s sovereign-debt crisis. Blanchflower speaks with Margaret Brennan on Bloomberg Television’s “InBusiness.” (Source: Bloomberg)

Warren Buffett – The Difference Between Gold and Silver?

Warren Buffett – The Difference Between Gold and Silver?

By Adrian Ash on 6 April 2011

The bluntest difference between gold and silver? Warren Buffett…

WE’VE BEEN inundated here at BullionVault with comments and queries in response to Gold Value $3844, Paul Tustain’s new video presentation.

Apologies if we’ve not got round to answering your email yet. Chief amongst the queries? “What’s your view of silver?” Which on a risk-adjusted, ‘fair value’ basis, is tougher still to answer.


Just as you can with gold, you could plug your own forecast for changes to the silver price – under different levels of consumer-price inflation – into Paul’s gold value calculator (see column E. You’d also need to reset the “Current price” to $40 of course in cell E3). Simply running this exercise for silver but using Paul’s view of the various gold price outcomes, the current “fair value” would come out nearer $109 per ounce – again, like gold, significantly higher than today’s market price.

But silver is a very different market to gold. Most crucially, there’s no commonly accepted benchmark value – such as a suit of men’s clothes for an ounce of gold – against which to measure silver across time.

See Forbes magazine, for instance, on long-term valuations. All gold, no silver. Looking back 2,500 years, Stephen Harmston – writing for the World Gold Council in 1998 – found the same long-term value reversion in gold prices vs. the cost of bread. Again, no silver. Not having a base value for silver doesn’t interfere with Paul Tustain’s mathematics on his calculator. But it does mess with the methodology, denying the vital importance – in the absence of cashflow – of “over-” or “under-valuation”.

Sure, you could plug in a base value for silver, figured off that suit of men’s clothes, using the gold/silver ratio. But that would:

a) rely on agreeing a long-term ratio (open to fierce debate);
b) ignore silver’s changing industrial use (and thus its changing economic value);
c) relegate silver’s value to merely a function of gold.

Another route might be to track mining-output costs per ounce. Because, other things being equal, the price of a commodity should – in a free market — revert long-term towards its cost of production. Interestingly, the GFMS consultancy now puts total costs per ounce of gold, including infrastructure spend, above $800 per ounce…not too far from Paul’s current “suit of men’s clothes”. (Using Google to average the top 20 prices for a good men’s suit in the US, Tom Anderson at PassantGardant finds a base value of gold at $800-$850 per ounce today.) But silver is typically a by-product of other mineral extraction, rather than the primary target. So it’s impossible to judge today’s global “average”, let alone calculate historical mining costs for the kind of back-check which Paul runs for 1980 gold.

Yes, both gold and silver have been used as money throughout history. But while gold has tended to adopt the “store of value” function of money, silver has been used more as a “means of exchange”. India continued to mint silver rupees until 1947, for example, long after the Great Britain quit the gold standard. US silver certificates could be redeemed for Silver Dollar coins until 1968, almost 35 years after private gold-ownership had been banned.

Longer-lived than gold money, the purchasing power of silver coins was much more variable over time, thanks to regular debasement by greedy governments. The English Pound, for instance, contained barely one-third as much silver in 1600 as it did 300 years earlier, while the Genoese Lira in Italy shrank by nearer 90%. Gold coins was remarkably stable in comparison.

Silver’s other big difference from gold has been its changing industrial use. Some 60% of annual demand now comes from industry, rather than those store-of-wealth uses (coin, bar, jewellery and ornament) accounting for more than 89% of gold demand. The composition of silver’s industrial demand has also changed dramatically over time. In only the last 10 years, for instance, photographic demand has collapsed, while other existing uses (such as in solar panels) have surged and many new uses have been developed (in hospital linen, deodorants, wood preservatives).

The bluntest difference? Perhaps it’s Warren Buffett. The famous “value investor” has said he doesn’t understand gold, because it has “no utility”. Never mind its 5,000-year history of storing wealth. Anyone watching the gold market from Mars “would be scratching their head” to see it “dug up in Africa” only to be buried again in a vault underground, says Buffett.

Yet his Berkshire Hathaway fund tried to corner the silver market in the late 1990s, selling its massive position in 2006 for a fair profit. So while Buffett doesn’t “get” gold, his Graham-and-Dodd value investing made silver a valid play. Because he thought it was undervalued against the outlook for industrial demand.

Gold analysts are spared having to guess how technology might affect prices. Whereas the bigger prize – for you, Warren Buffett and for the Hunt brothers, who famously attempted a silver corner in the late 1970s – may look to be in judging silver’s future mix of monetary, investment and industrial use.

Adrian Ash
for Money Morning Australia

Adrian Ash is head of research at www.BullionVault.com

Euro on the defensive in Forex Trade despite the ECB raising interest rate by 25 basis points

By CountingPips.com

The European common currency has been on the defensive in forex trading this morning following the widely expected interest rate hike by the European Central Bank. The ECB increased the interest rate by 25 basis points to the 1.25 percent level. This marked the first interest rate increase for the ECB since July 2008 which occurred just a few months before the global financial crisis.

The rate hike is an attempt to combat rising price inflation as the latest inflation data out of the EU showed that prices rose by 2.6 percent on an annual basis in March. February’s annual inflation rate had registered an increase of 2.2 percent.

The ECB annual inflation target is 2.0 percent.

The Bank of England was also out with its interest rate decision today and held its interest rate at the 0.50 percent level as widely expected. The bank maintained its bond buying program at the 200B GBP level.

Euro falls in Forex

The euro has been lower in forex trading against the major currencies so far today. The euro has fallen against the US dollar, Swiss franc, British pound sterling, Japanese yen, New Zealand dollar, Australian dollar and the Canadian dollar, according to currency data by Oanda.

David Song, currency analyst at DailyFX, commented on the euro dollar exchange rate saying, “As the EUR/USD maintains the upward trend from earlier this year, the exchange rate should work its way towards the 78.6% Fibonacci retracement from the 2009 high to the 2010 low around 1.4440-50, but fears surrounding the euro-area may continue to drag on the single-currency as the EU maintains a relaxed approach in addressing the sovereign debt crisis.”

EUR/USD Chart – The euro coming down off of yesterday’s high at the 1.4350 level to today trading below 1.4300 near 1.4280. Likely support will come in around the 1.4265 level.